Maintaining financial discipline is one of the biggest challenges for any organization. Even when budgets are carefully planned, teams struggle because actual spending spreads across emails, Excel sheets, and manual reports. Without real-time visibility, leaders cannot identify overspending, control deviations, or make timely financial decisions.
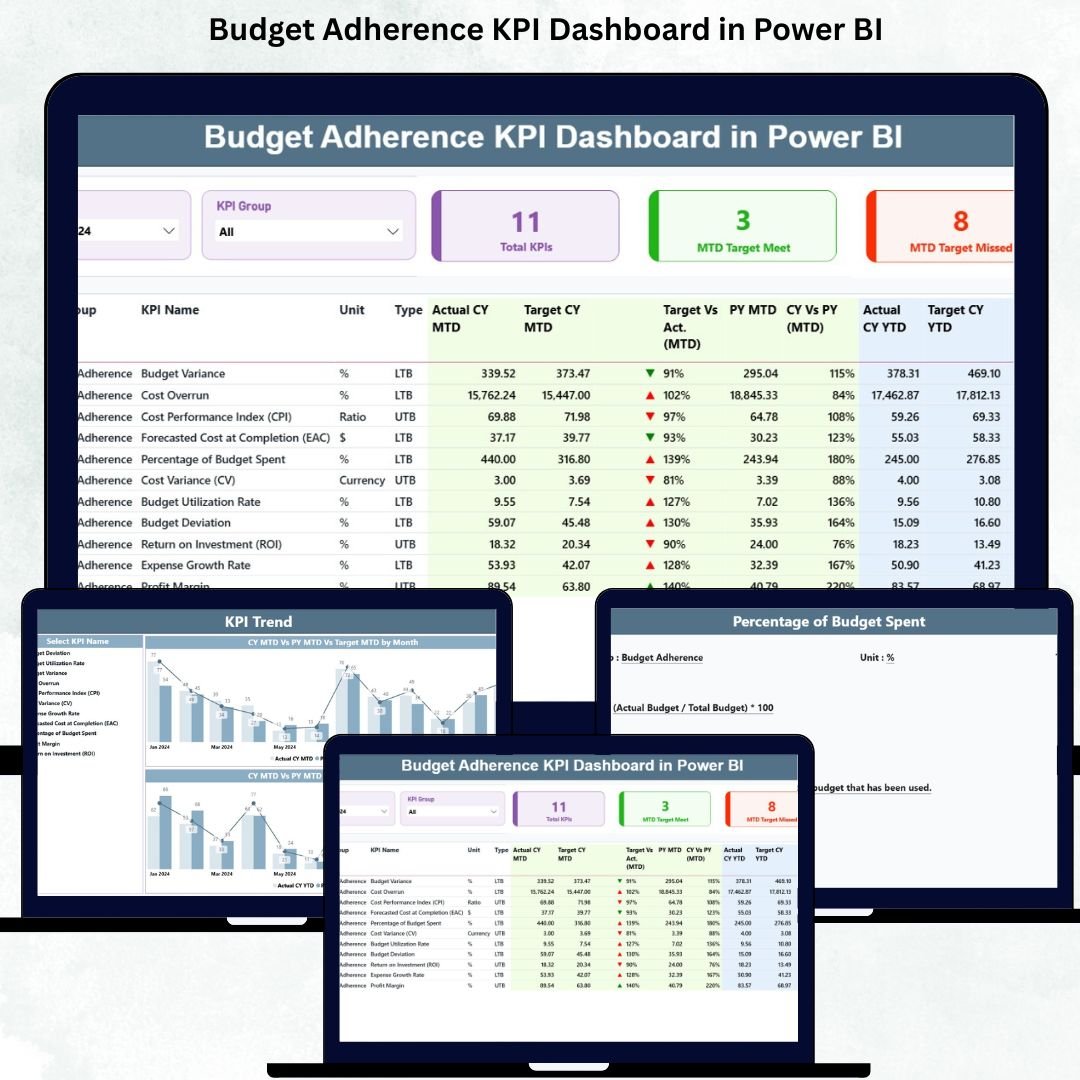
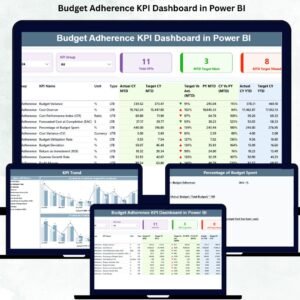
The Budget Adherence KPI Dashboard in Power BI solves this problem instantly. It brings all financial KPIs into one interactive, visual, and automated dashboard. Finance managers, department heads, controllers, and senior leaders can monitor actual vs target spending, track MTD and YTD performance, compare results with previous years, and identify variances early. With clean visuals, smart filters, color-coded indicators, and drill-through pages, managing your organization’s financial health becomes effortless.
Below is everything included inside this powerful dashboard and how it helps your business.
✨ Key Features of the Budget Adherence KPI Dashboard in Power BI
The dashboard is designed to give complete clarity on how well your organization adheres to its financial plans. Key features include:
✔ Interactive Summary Page
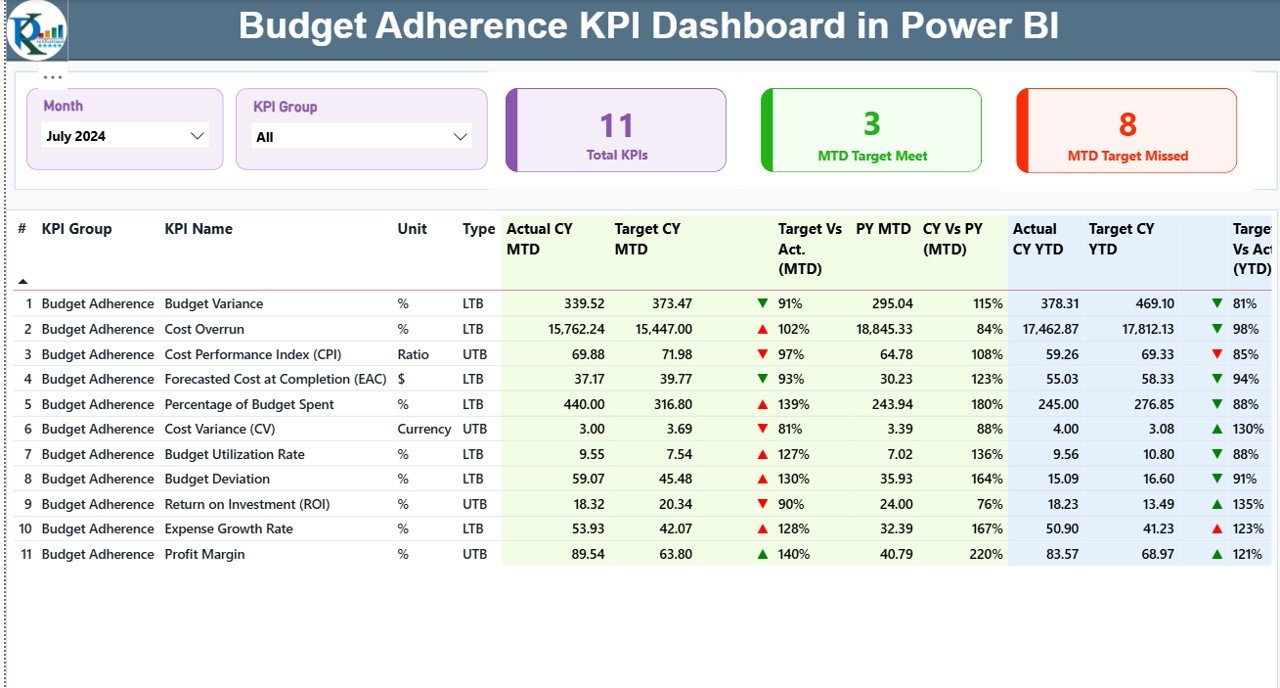
A clean overview of MTD, YTD, and previous year comparisons with slicers for Month and KPI Group.
✔ Smart KPI Cards
Shows total KPIs count, MTD target met, and MTD target missed—perfect for instant performance checks.
✔ Detailed KPI Table
Includes KPI Number, Group, Name, Unit, Type (UTB/LTB), Actual vs Target MTD/YTD, PY comparisons, and performance icons (▲ ▼).
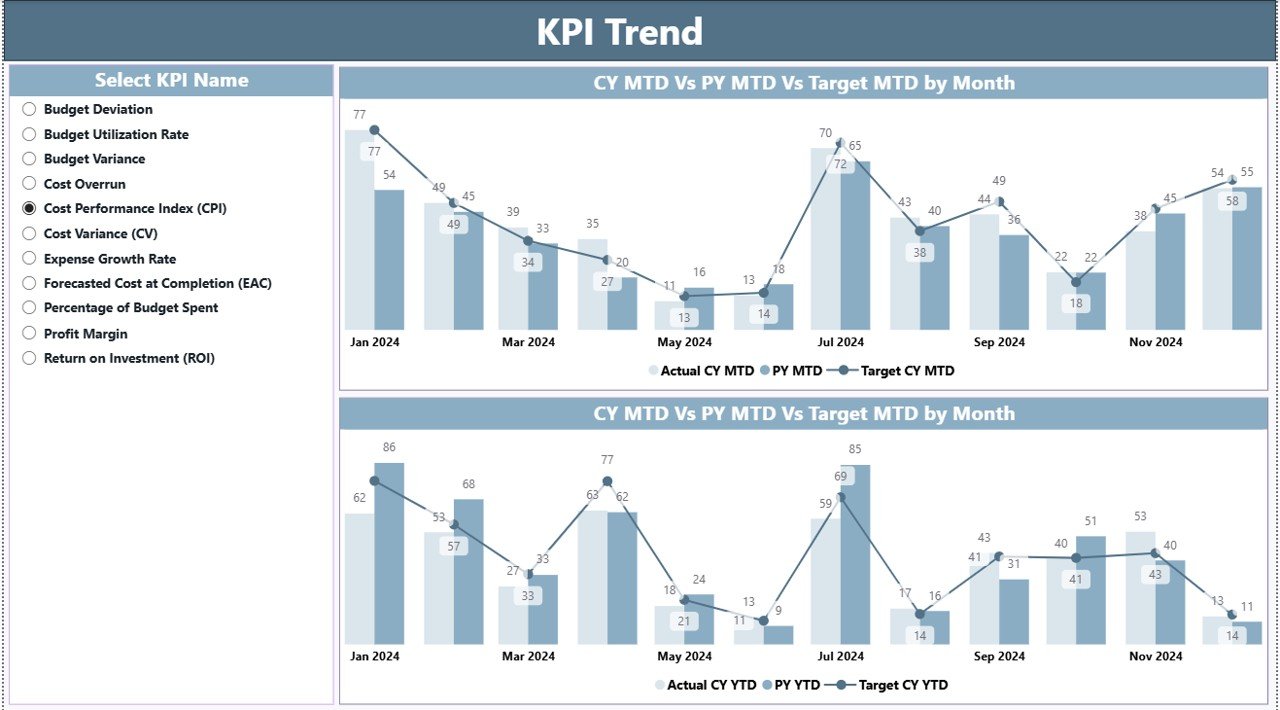
✔ Trend Analysis Page
Two combo charts show MTD and YTD trends for actuals, targets, and previous year numbers.
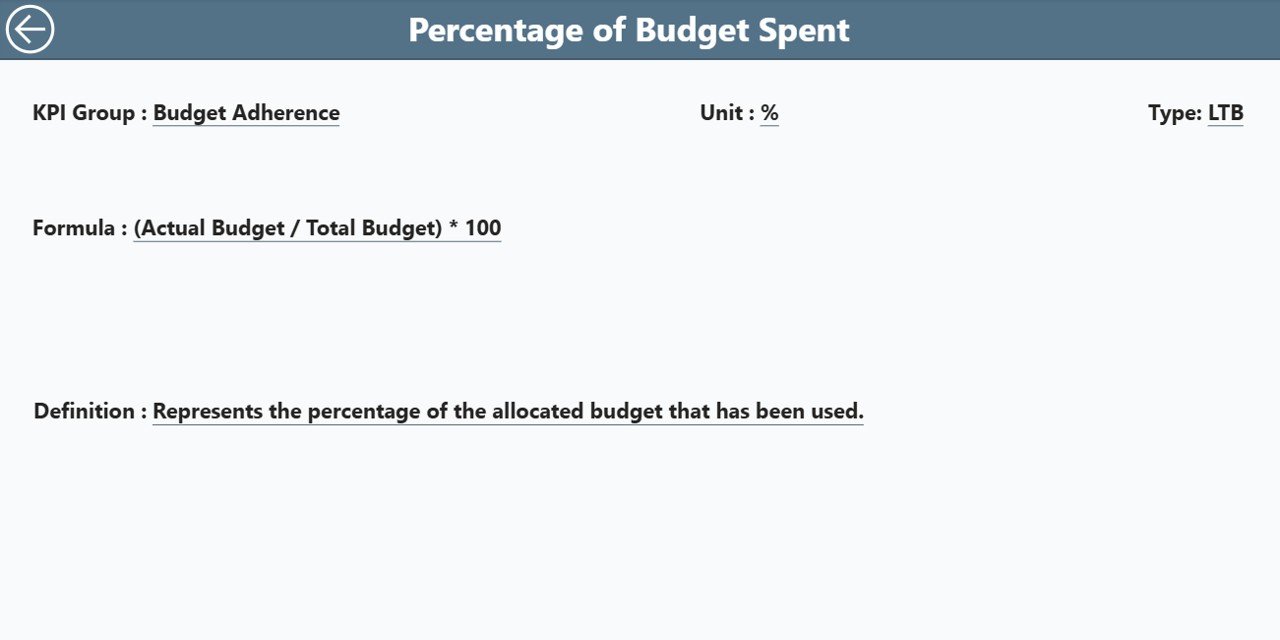
✔ KPI Definition Page
Drill-through page that displays KPI formulas, definitions, units, and types for full transparency.
✔ Excel-Based Backend
The dashboard reads data from three simple sheets: Input_Actual, Input_Target, and KPI Definitions.
With these features, teams enjoy an easy-to-use, highly visual, and fully automated financial monitoring system.
📦 What’s Inside the Budget Adherence Dashboard
(Heading 2)
When you download this dashboard, you get:
🗂 Power BI (.pbix) File
A fully built dashboard with 3 pages: Summary, KPI Trend, and KPI Definition.
📘 Excel Data File
Contains Input_Actual, Input_Target, and KPI Definition sheets for seamless data refresh.
🎯 Pre-Configured KPIs
Such as:
-
Budget Utilization %
-
Target Achievement %
-
Spending Variance
-
YTD Budget Performance
-
Previous Year Financial Comparison
🔎 In-Depth Trend Charts
For month-wise analysis of actuals, targets, and prior-year numbers.
🧭 Navigation Ready Layout
Easy slicers, clean visuals, and intuitive design suitable for all users.
This combination creates a complete financial monitoring ecosystem for your organization.
📝 How to Use the Budget Adherence KPI Dashboard
(Heading 2)
Using the dashboard is simple:
1️⃣ Update the Excel Data Sheets
Enter your monthly actuals and targets in the Input_Actual and Input_Target sheets.
2️⃣ Refresh Power BI
Click “Refresh” and the entire dashboard updates instantly.
3️⃣ Use Month & KPI Group Slicers
Filter data by department or time period to get personalized insights.
4️⃣ Analyze KPI Table
Use icons, variance percentages, and previous year comparisons to identify issues early.
5️⃣ Check Trends
Open the KPI Trend page to understand how spending changes month-to-month.
6️⃣ Use Drill-Through Page
Right-click any KPI to view its formula, definition, and type.
No technical skills are required—this dashboard is designed for easy adoption by all finance-related teams.
👥 Who Can Benefit from This Dashboard?
(Heading 2)
This dashboard is useful for anyone responsible for financial control, including:
👨💼 Finance Managers
Monitor MTD & YTD performance easily.
🧾 Controllers
Track variances and identify overspending instantly.
🏢 Department Heads
Check if their teams stay within budget.
📊 Senior Leadership
Get clear visibility across all financial KPIs.
🛠 Project Managers
Track project-based spending against targets.
💼 Business Owners
Understand financial discipline and long-term stability.
No matter the industry, any organization with budget tracking needs this dashboard.


Reviews
There are no reviews yet.