In today’s crowded digital marketplace, brands must do more than simply exist — they must stay visible, memorable, and consistently engaging. However, many marketing teams still rely on scattered reports and disconnected data sources. As a result, decision-makers struggle to measure true brand awareness and campaign effectiveness.
That is exactly why the Brand Awareness KPI Dashboard in Google Sheets is a must-have tool for modern marketing teams.
This powerful, ready-to-use dashboard provides a centralized system to track your most important brand visibility metrics in one dynamic and easy-to-use interface. Instead of manually compiling reports, your team can instantly monitor performance, compare targets, and uncover growth opportunities.
Built entirely in Google Sheets, this solution is flexible, collaborative, and cost-effective — making it perfect for fast-moving marketing environments.’
🚀 Key Feature of Brand Awareness KPI Dashboard in Google Sheets
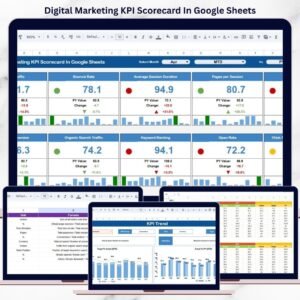
✅ Fully Interactive Dashboard – Select any month and watch the entire dashboard update automatically.
✅ MTD & YTD Performance Tracking – Monitor both short-term and long-term brand trends with zero manual effort.
✅ Actual vs Target Comparison – Instantly identify performance gaps and campaign effectiveness.
✅ Smart Conditional Formatting – Up/down arrows and color signals highlight KPI status at a glance.
✅ Previous Year Comparison – Evaluate year-over-year brand growth with built-in historical analysis.
✅ Dynamic KPI Intelligence Panel – Each KPI includes unit, formula, definition, and performance type (LTB/UTB).
✅ Google Sheets Collaboration Ready – Share and collaborate with your team from anywhere.
Because of these features, marketing teams gain complete visibility into brand awareness performance without complex BI tools.
📦 What’s Inside the Brand Awareness KPI Dashboard in Google Sheets
This professionally designed solution includes 6 structured worksheets that work together seamlessly.
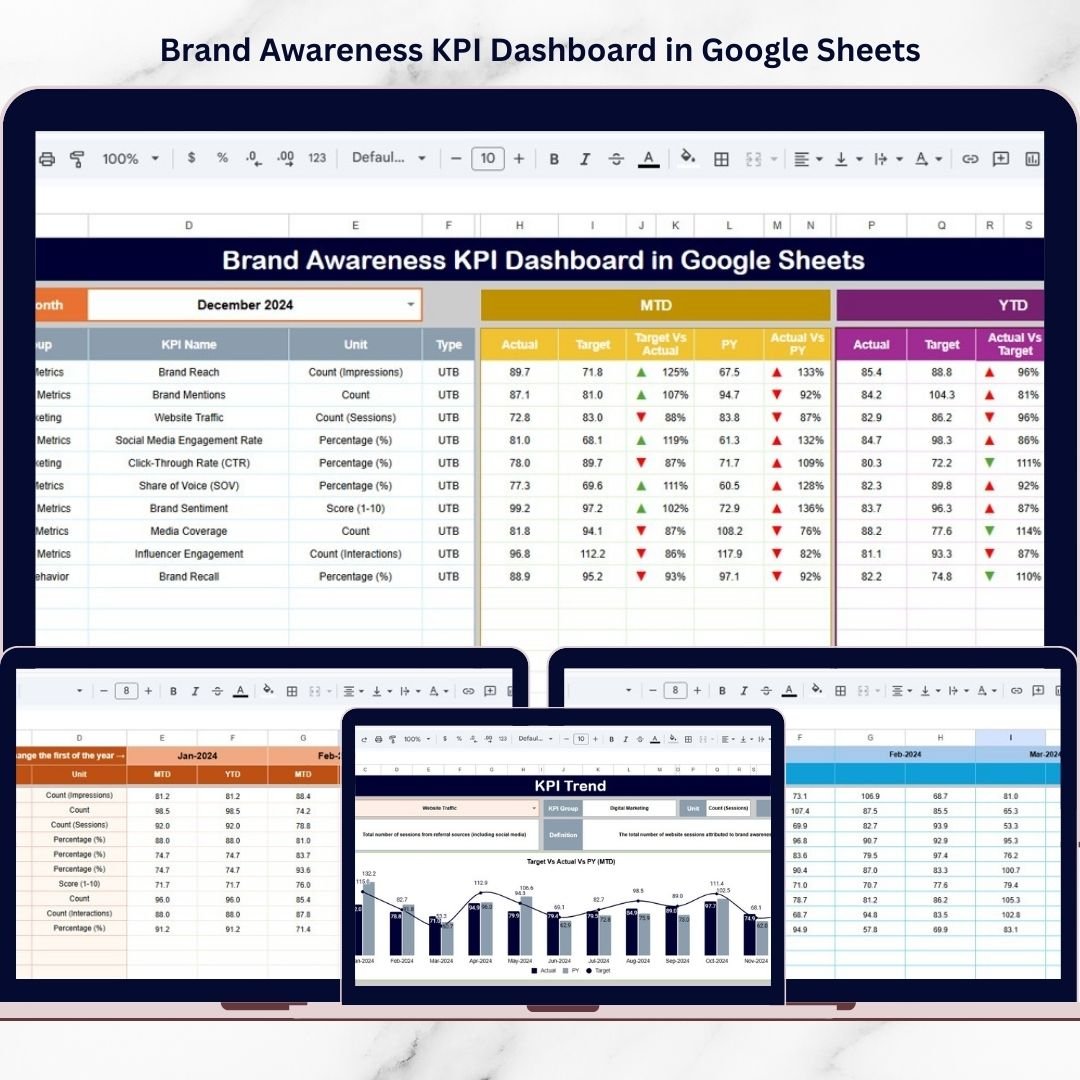
1️⃣ Dashboard Sheet – Main Control Center
The heart of the system where you monitor all KPIs in one unified view. It includes:
-
Month selector (cell D3)
-
Automatic dashboard refresh
-
MTD and YTD performance blocks
-
Target vs Actual comparison
-
Previous Year vs Actual comparison
-
Visual performance indicators
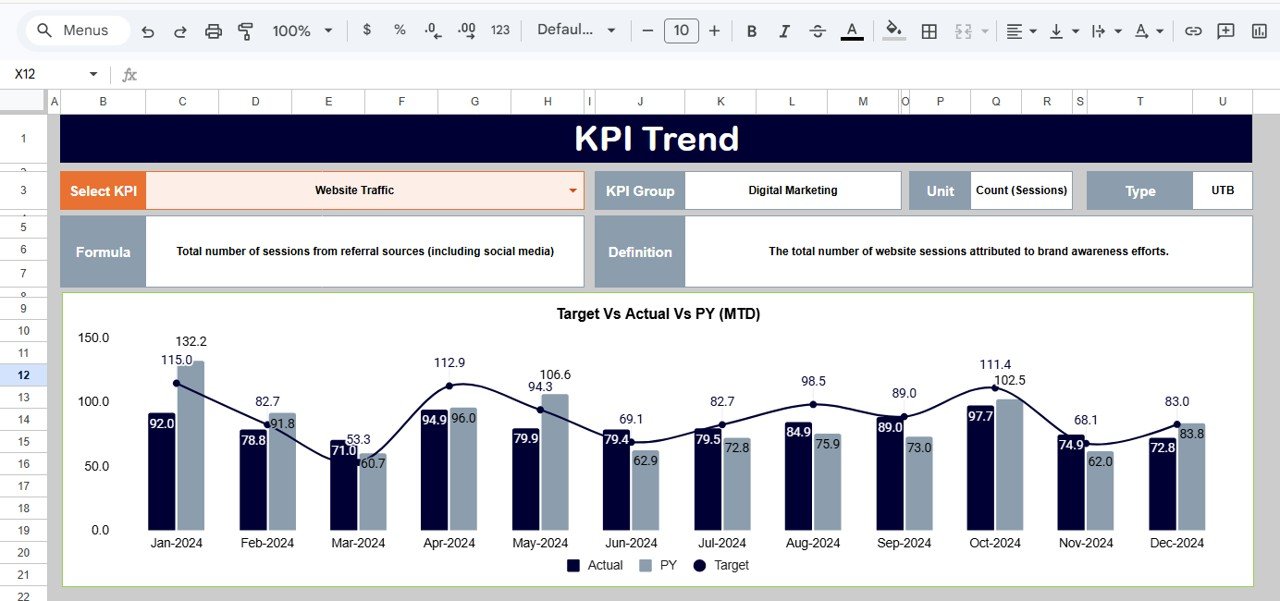
2️⃣ KPI Trend Sheet – Deep KPI Insights
Analyze individual KPIs using the dropdown in cell C3. This sheet displays:
-
KPI Group
-
Unit of measurement
-
KPI Type (LTB/UTB)
-
KPI Formula
-
KPI Definition
-
MTD & YTD trend charts
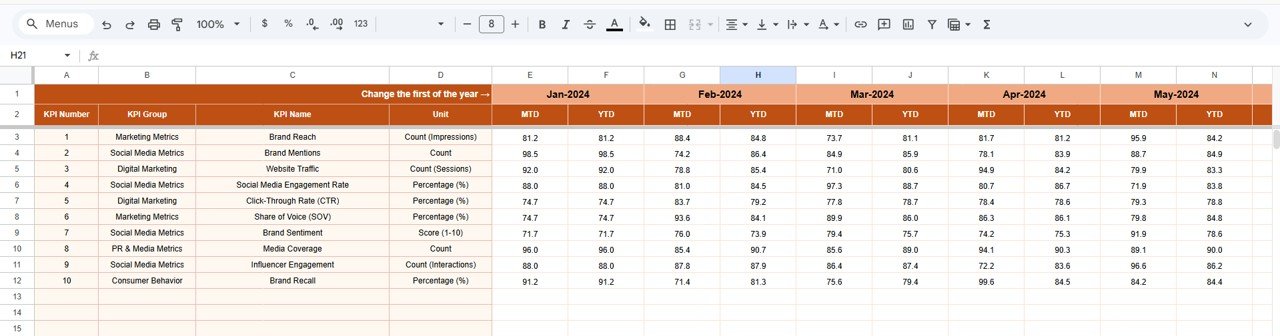
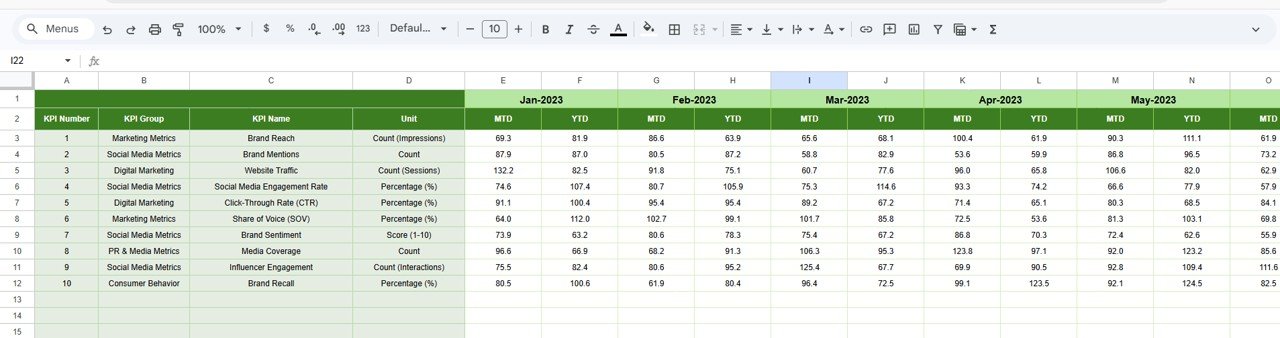
3️⃣ Actual Number Sheet – Current Data Entry
Your primary input area for current-year performance. Simply enter monthly values and the dashboard updates automatically.
4️⃣ Target Sheet – Performance Benchmarks
Define monthly and yearly targets to measure campaign success accurately.
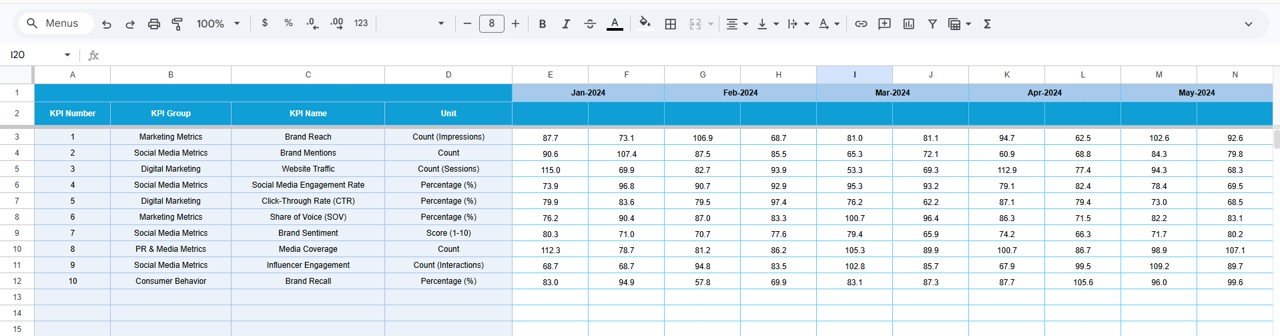
5️⃣ Previous Year Number Sheet – Historical Engine
Store last year’s data to unlock powerful year-over-year analysis and trend visibility.
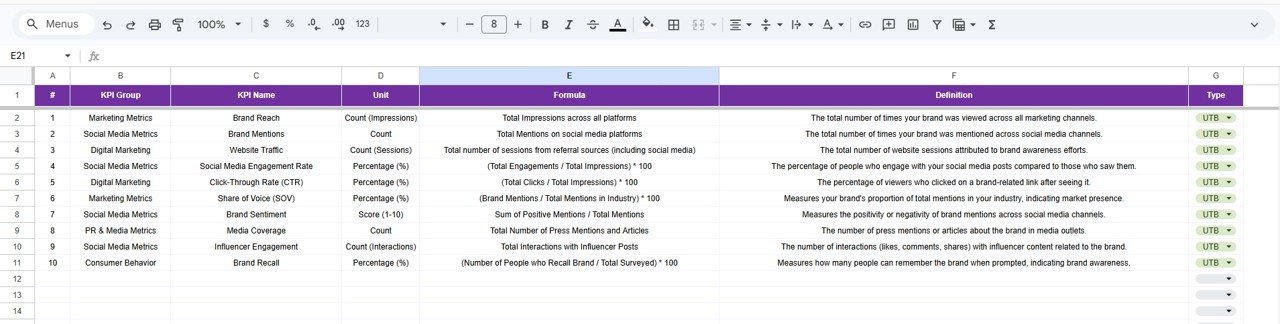
6️⃣ KPI Definition Sheet – KPI Knowledge Hub
Standardizes KPI logic by storing name, group, unit, formula, and definition for every metric.
Together, these sheets create a complete brand awareness performance management system.
⚙️ How to Use the Brand Awareness KPI Dashboard in Google Sheets
Getting started is quick and straightforward:
-
Open the Google Sheets template
-
Update the KPI Definition sheet
-
Enter targets in the Target sheet
-
Input previous year data
-
Add current actual numbers
-
Select the desired month on the Dashboard
-
Review instant brand performance insights
Within minutes, your marketing data transforms into decision-ready intelligence.
👥 Who Can Benefit from This Brand Awareness KPI Dashboard in Google Sheets
This dashboard is designed for any organization serious about brand growth.
Perfect for:
-
📢 Marketing Managers
-
🎯 Brand Strategists
-
📊 Digital Marketing Teams
-
🚀 Growth Marketers
-
💼 Business Owners
-
🧠 Marketing Analysts
-
🏢 Marketing Agencies
Because the dashboard runs in Google Sheets, distributed teams can collaborate in real time from anywhere.
By implementing the Brand Awareness KPI Dashboard in Google Sheets, your organization gains:
-
Centralized performance visibility
-
Faster marketing decisions
-
Improved campaign accountability
-
Clear target tracking
-
Better year-over-year insights
-
Cost-effective analytics
In today’s competitive landscape, guessing your brand performance is risky. You need clear, real-time intelligence to stay ahead.
This dashboard delivers exactly that.
🔗 Click here to read the Detailed blog post
Watch the step-by-step video tutorial: