🔗 Managing blockchain development projects is complex — multiple platforms, sprints, teams, and budgets all running at the same time. Without the right tool, critical insights get buried in spreadsheets and reports.
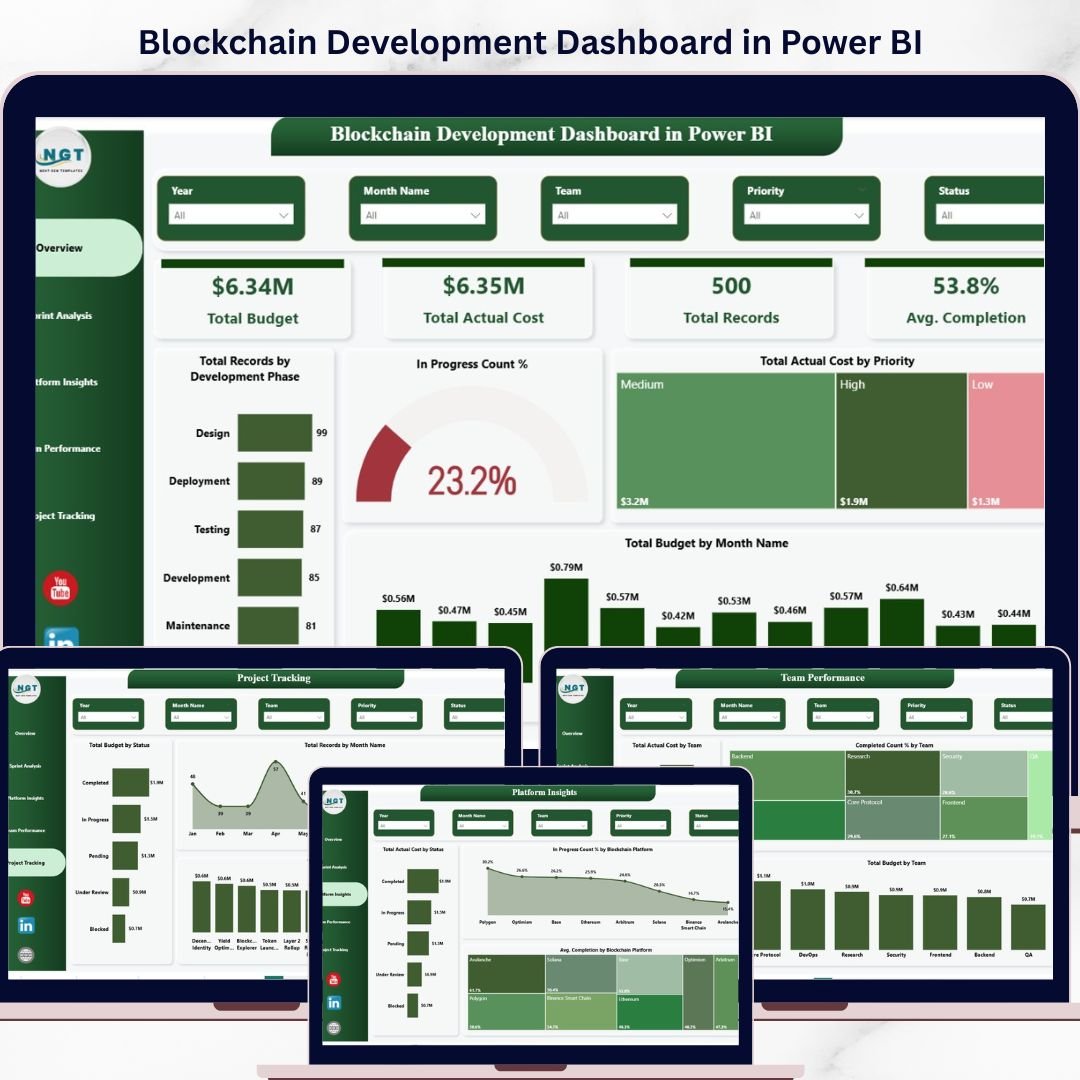
👉 The Blockchain Development Dashboard in Power BI is your complete, ready-to-use solution to monitor, analyze, and manage every aspect of your blockchain development lifecycle — all in one interactive, multi-page report.
This powerful dashboard converts raw project data into clear, dynamic visuals. With just a data update and a single refresh, you get real-time insights into budgets, sprint performance, team efficiency, platform comparisons, and project progress.
🔑 Key Features of Blockchain Development Dashboard in Power BI
✨ 5 Fully Interactive Dashboard Pages – Each page is dedicated to a specific project dimension for focused, deep analysis.
📊 KPI Cards – Total Budget, Actual Cost, Total Records, and Avg. Completion visible at a glance.
🎯 Advanced Filters & Slicers – Filter by phase, priority, sprint, platform, team, and status.
📈 Dynamic Visualizations – Bar charts, donut charts, and trend lines for comprehensive data analysis.
⚡ Real-Time Data Refresh – Connect your data and refresh for instant, up-to-date insights.
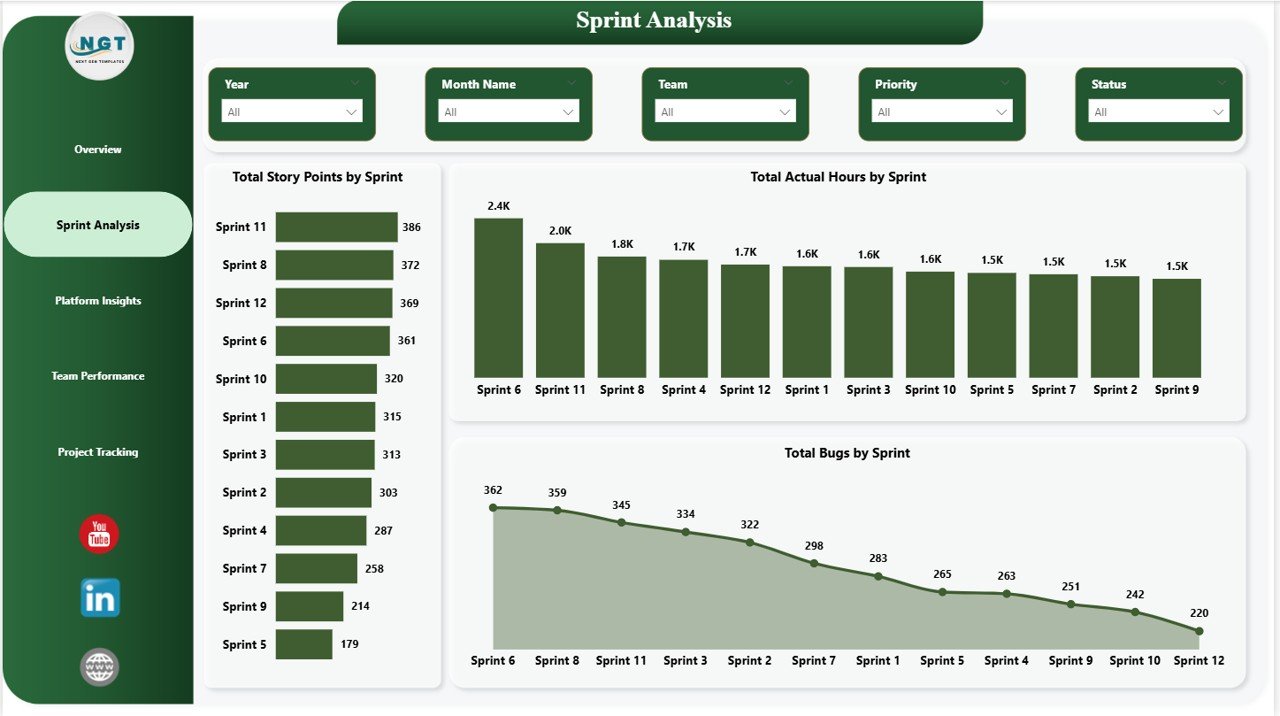
👨💻 Sprint Analysis – Track story points, actual hours, and bug counts per sprint.
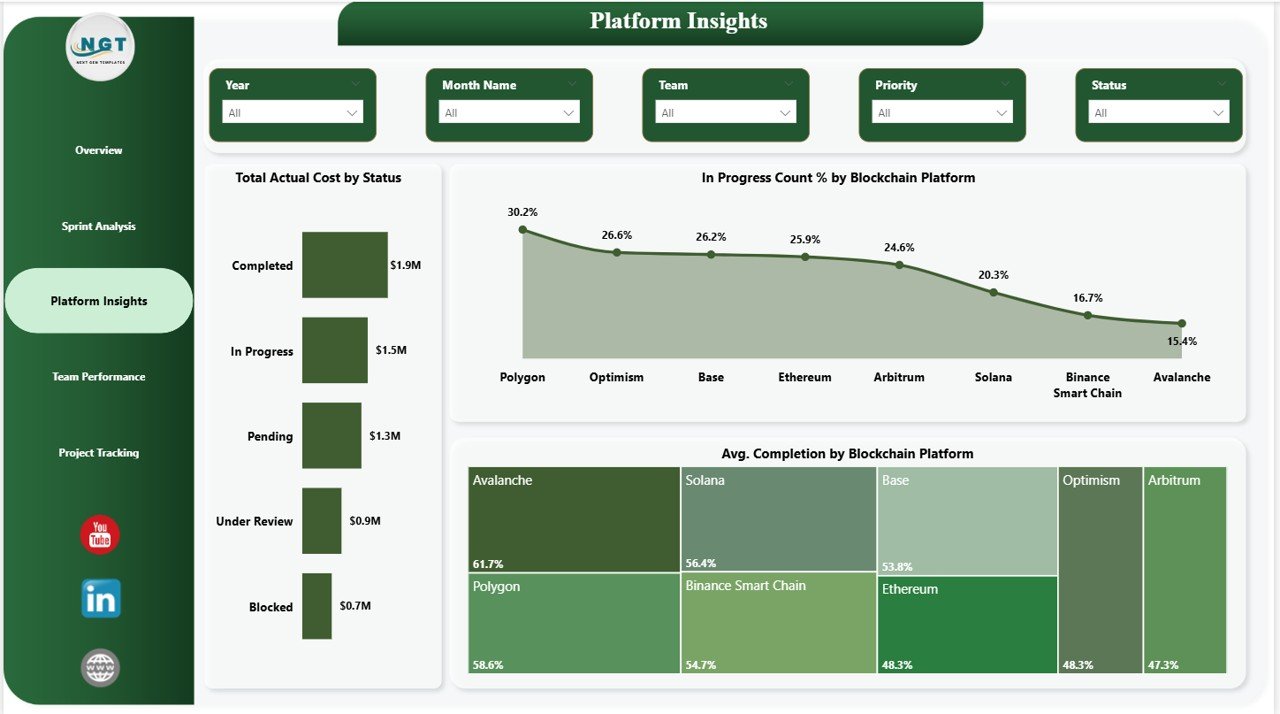
🌐 Platform Comparisons – Evaluate performance across blockchain platforms side by side.
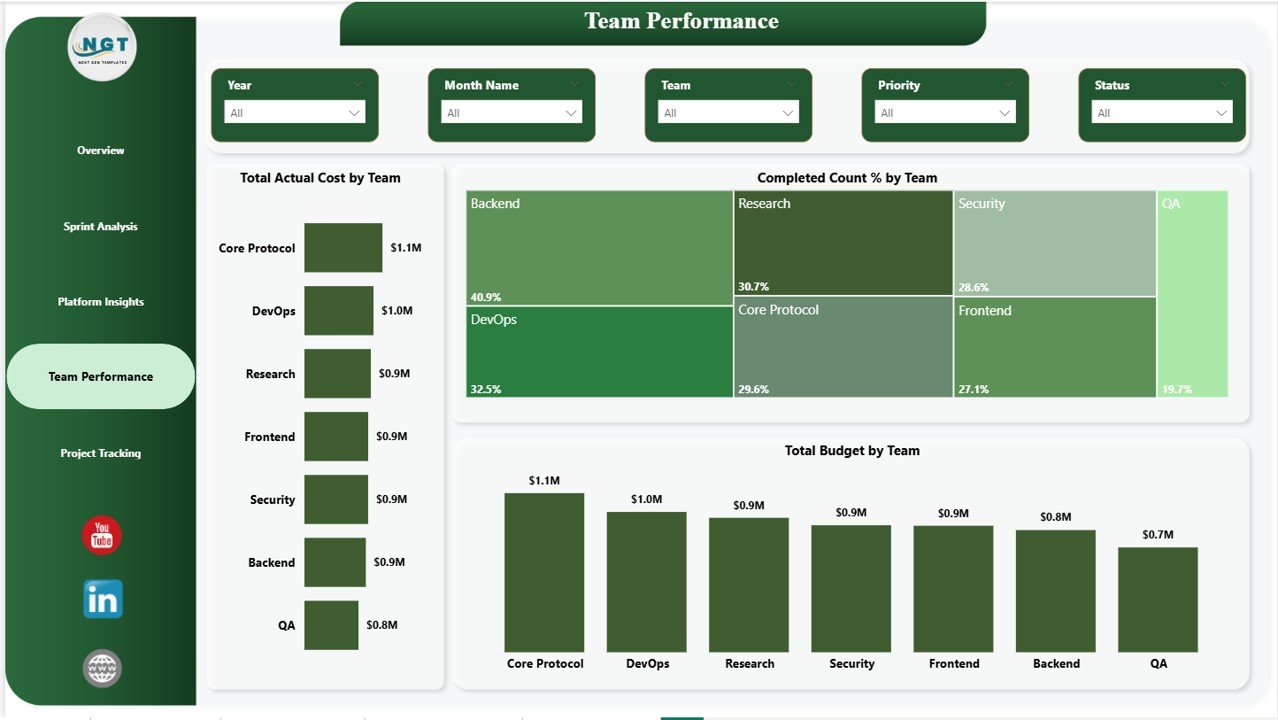
👥 Team Productivity Tracking – Measure budget and completion rates across all teams.
📦 What’s Inside the Blockchain Development Dashboard in Power BI
📁 5 Fully Interactive Pages
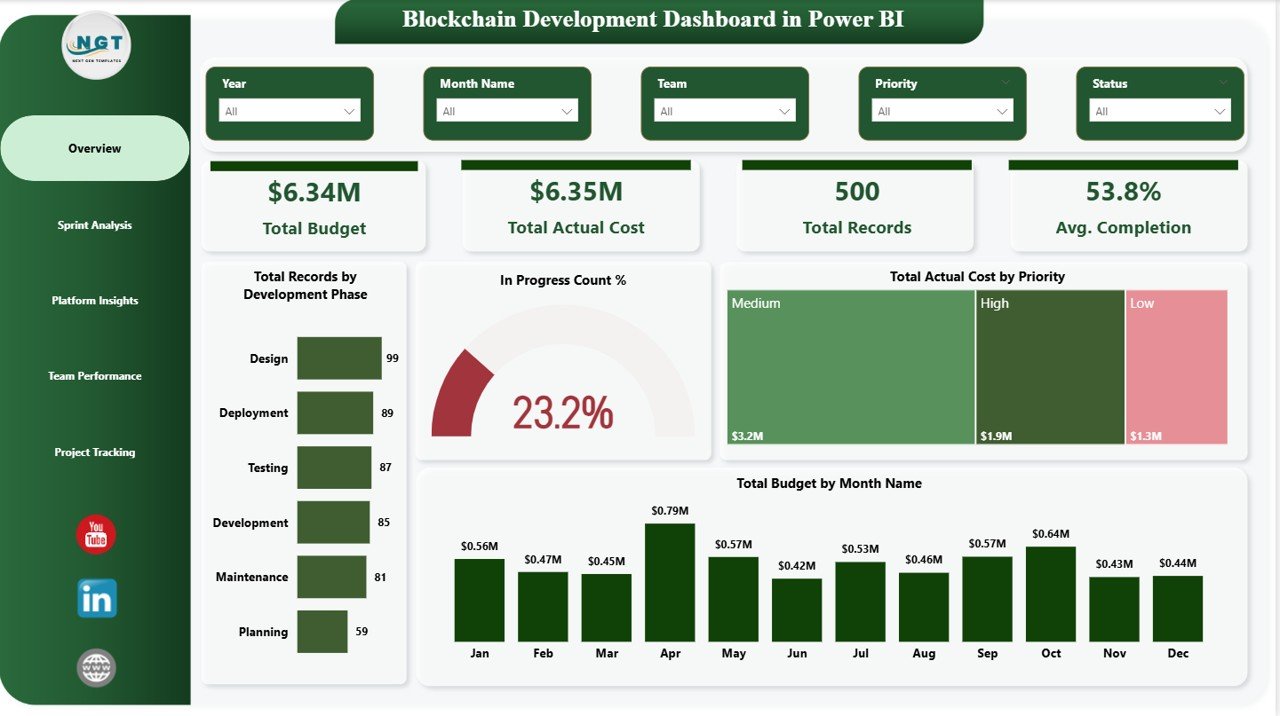
- Overview Dashboard
- Sprint Analysis
- Platform Insights
- Team Performance
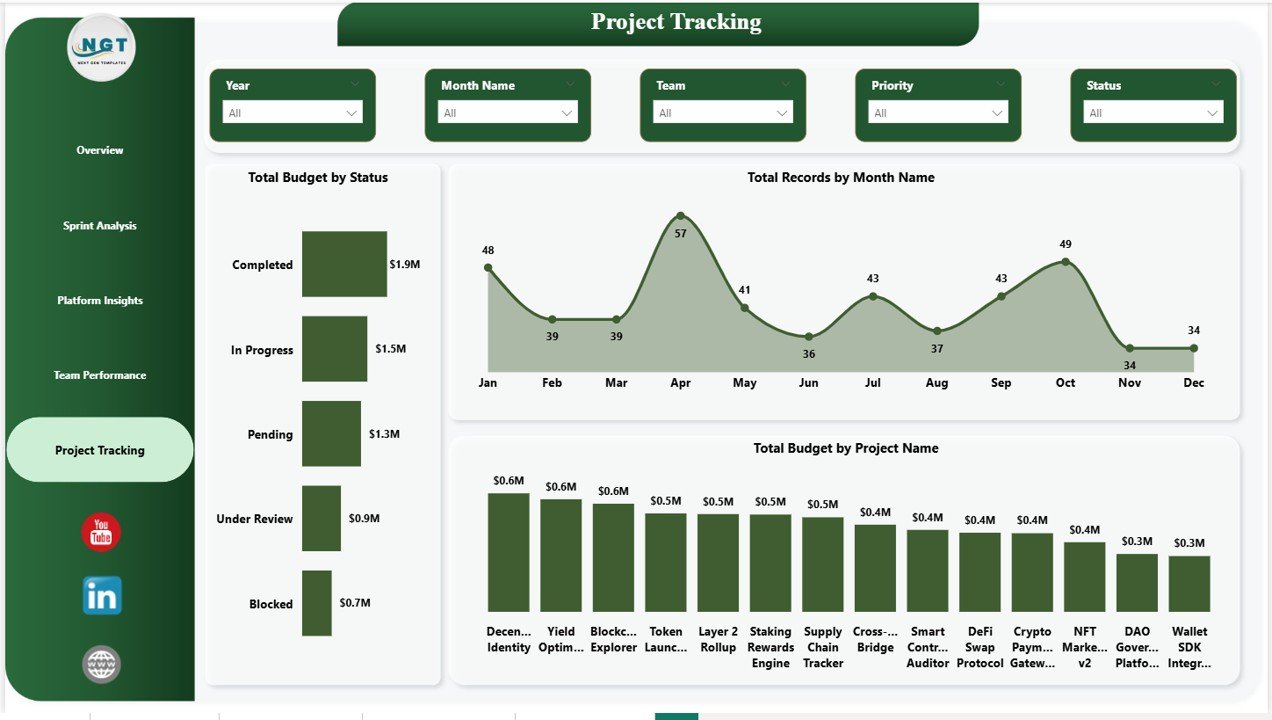
- Project Tracking
📊 Pre-Built KPI Metrics & Charts
- Total Budget & Actual Cost Cards
- Total Records by Development Phase
- In Progress Count % (Donut Chart)
- Actual Cost by Priority & Platform
- Sprint Story Points, Hours & Bugs
- Team Completion % & Budget Allocation
- Monthly Budget & Record Trends
🎛️ Interactive Filters & Slicers
- Filter by Development Phase
- Filter by Priority
- Filter by Sprint
- Filter by Blockchain Platform
- Filter by Team & Status
📂 Ready-to-Use Power BI File
- Fully designed and formatted .pbix file
- Sample data included for immediate preview
- Easy to connect your own data source
- No advanced Power BI skills required
⚙️ How to Use the Blockchain Development Dashboard in Power BI
1️⃣ Download and open the Power BI file
2️⃣ Connect or replace the sample data with your own project data
3️⃣ Click Refresh to update all visuals instantly
4️⃣ Use slicers to filter and explore data dynamically
5️⃣ Analyze KPIs and charts to make faster, smarter decisions
💡 No advanced Power BI expertise required — this dashboard is built for simplicity and maximum efficiency.
👥 Who Can Benefit from This Dashboard
✔️ Blockchain Project Managers
✔️ Agile & Scrum Teams
✔️ Software Development Teams
✔️ Startup Founders & CTOs
✔️ Data Analysts & Business Analysts
✔️ IT Project Managers & Technology Leaders


Reviews
There are no reviews yet.