The Blockchain & Cryptocurrency KPI Dashboard in Power BI is a powerful and insightful tool for financial analysts, crypto investors, and blockchain experts to monitor, analyze, and visualize key performance indicators (KPIs) for cryptocurrency and blockchain performance. This advanced Power BI dashboard enables real-time tracking of cryptocurrency market trends, blockchain transaction volumes, token performance, and more.
With this dashboard, you can easily track the performance of various cryptocurrencies, analyze their historical data, monitor real-time price movements, and assess their impact on the blockchain ecosystem. Whether you’re an investor, a developer, or a business owner exploring blockchain opportunities, this dashboard gives you the data and insights necessary to make informed decisions in the rapidly evolving cryptocurrency space.
Key Features of the Blockchain Cryptocurrency KPI Dashboard in Power BI
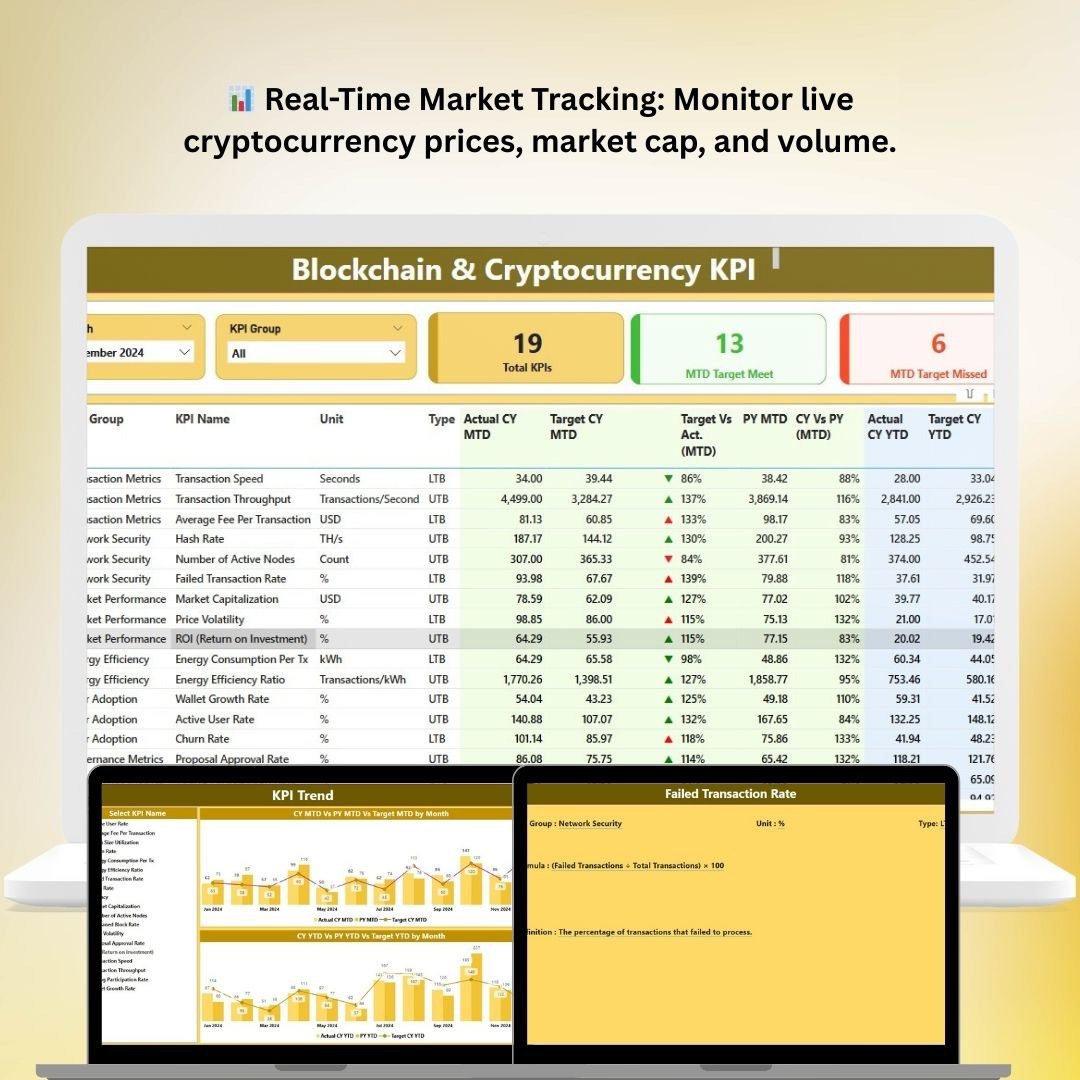
📊 Real-Time Cryptocurrency Market Data
Track live cryptocurrency prices, market capitalization, trading volumes, and other essential market metrics. Get up-to-date data from the top cryptocurrencies like Bitcoin, Ethereum, and other emerging tokens.
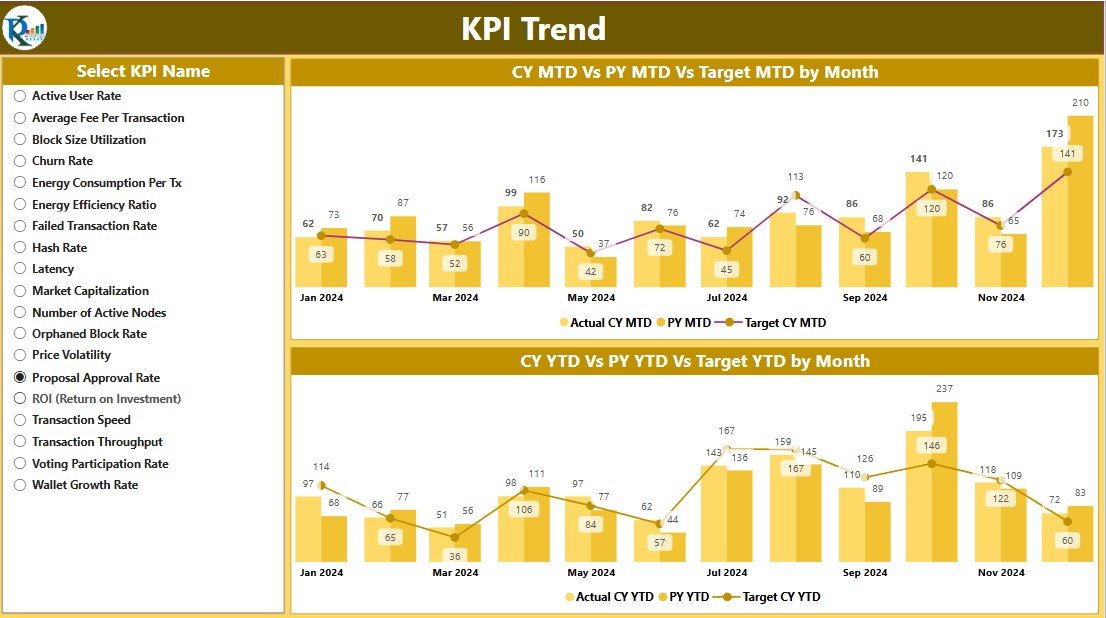
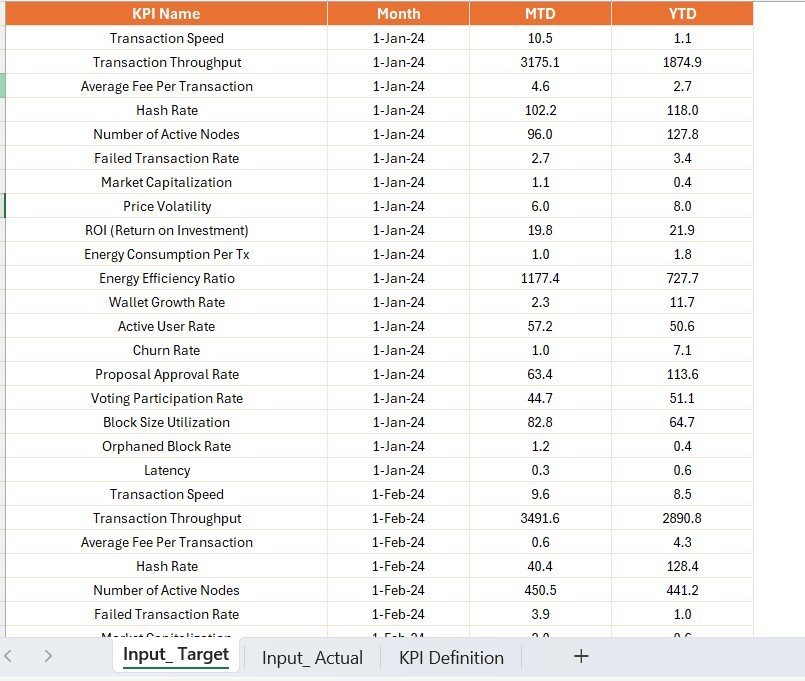
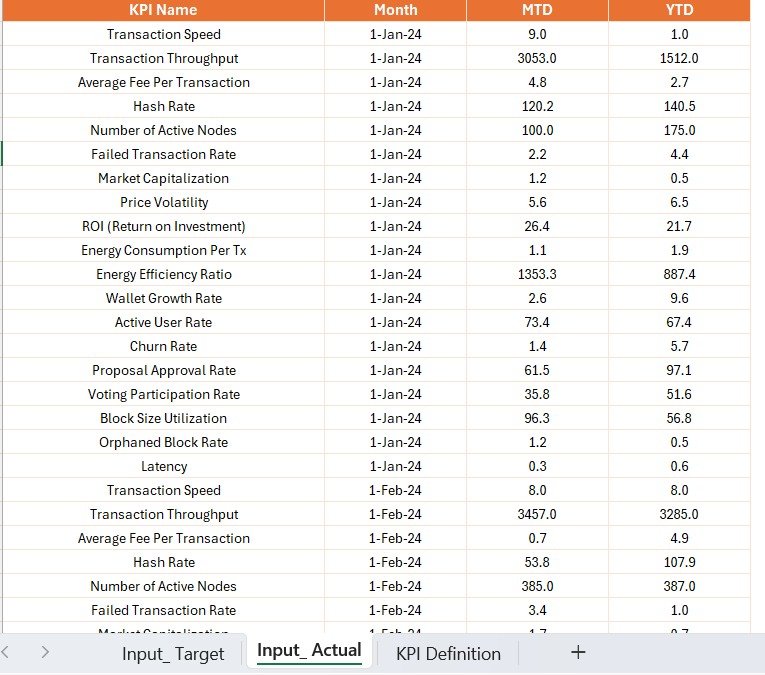
📈 Historical Data & Performance Tracking
Analyze historical data to understand the price trends, market cycles, and volatility of various cryptocurrencies. Identify patterns and make informed predictions based on past performance.
💹 Blockchain Transaction Analysis
Monitor blockchain transaction volumes, network activity, and token transfers. Understand transaction flows and assess the overall health of the blockchain ecosystem.
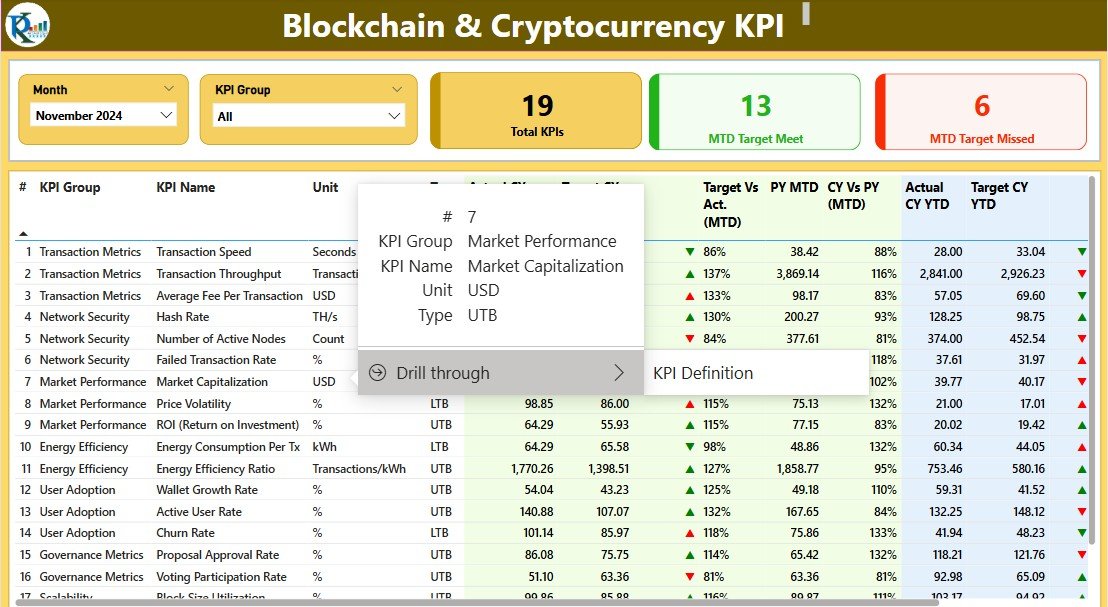
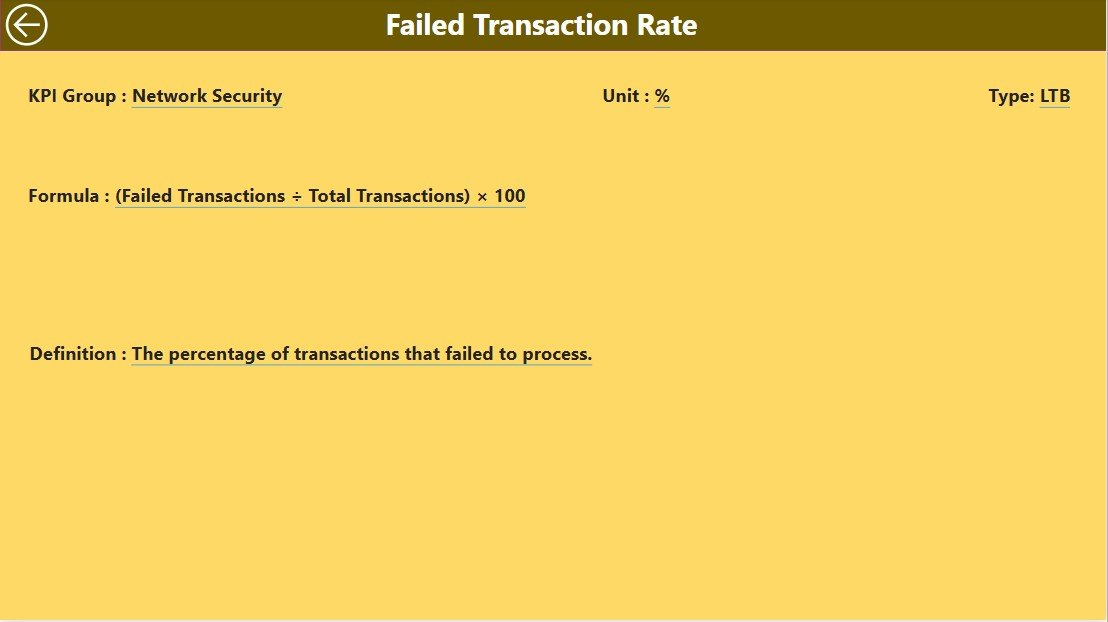
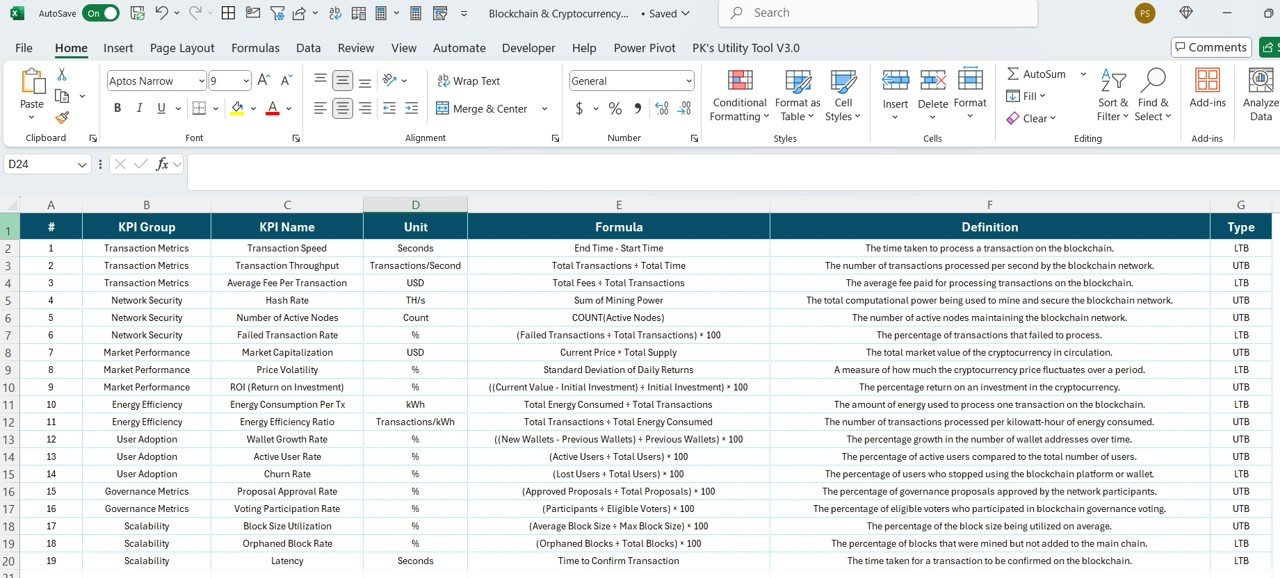
🎯 Customizable KPIs & Metrics
Tailor the dashboard to your specific needs by adjusting the KPIs, performance metrics, and data sources. Whether you’re tracking a specific coin, token, or blockchain network, the dashboard can be customized to suit your business or investment goals.
📝 Risk & Investment Analysis
Evaluate cryptocurrency risk factors, market volatility, and ROI. Use the dashboard to make more informed investment decisions and track the performance of your crypto portfolio.
📊 Data Visualization & Reporting
Visualize data through interactive charts, graphs, and reports. Make quick decisions with visually appealing insights into market trends, blockchain performance, and cryptocurrency data.
Why You’ll Love the Blockchain Cryptocurrency KPI Dashboard in Power BI
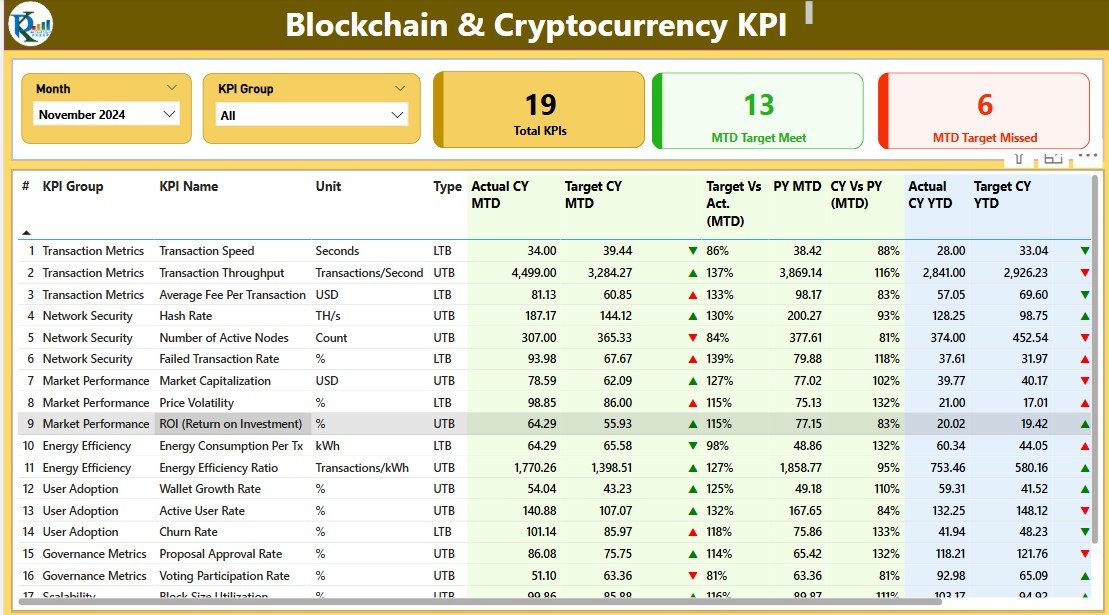
✅ Comprehensive Market Overview
Track all key cryptocurrency and blockchain performance metrics in one centralized dashboard. Gain insights into price movements, transaction volumes, and market trends in real-time.
✅ Real-Time Data Tracking
Access live cryptocurrency prices and blockchain data. Monitor key market movements and stay ahead of changes in real-time.
✅ Informed Investment Decisions
Use the dashboard to track your crypto portfolio and evaluate investment opportunities. Get data-driven insights into market volatility, ROI, and performance risks.
✅ Visualize Blockchain Activity
Track blockchain network activity, token performance, and transaction volumes. Understand the underlying performance of the blockchain ecosystem with interactive visualizations.
✅ Customizable for Your Needs
Customize the dashboard to fit your cryptocurrency tracking needs. Add new KPIs, adjust data sources, and modify charts to match your specific analysis goals.
What’s Inside the Blockchain Cryptocurrency KPI Dashboard in Power BI?
- Real-Time Market Data: Track cryptocurrency prices, market cap, and trading volumes.
- Historical Performance Data: Analyze price trends and historical performance of various cryptocurrencies.
- Blockchain Transaction Volume Analysis: Monitor transaction flows, network activity, and token transfers.
- Customizable KPIs: Adjust the KPIs and metrics to track the data that matters most to your business or investment strategy.
- Data Visualization & Reports: Use charts, graphs, and interactive reports to visualize key performance indicators.
- Risk & Investment Insights: Evaluate market volatility, risk factors, and ROI for cryptocurrency investments.
How to Use the Blockchain Cryptocurrency KPI Dashboard in Power BI
1️⃣ Download the Template: Get immediate access to the Blockchain Cryptocurrency KPI Dashboard in Power BI.
2️⃣ Connect Data Sources: Link the dashboard to your preferred cryptocurrency data sources to track live prices and blockchain activity.
3️⃣ Set Up Custom KPIs & Metrics: Customize the dashboard to track specific cryptocurrencies, tokens, and blockchain metrics.
4️⃣ Monitor Real-Time Market Trends: Track cryptocurrency performance, market volatility, and blockchain transaction volumes.
5️⃣ Analyze & Visualize Data: Use Power BI’s interactive charts to analyze trends and make informed investment decisions.
Who Can Benefit from the Blockchain Cryptocurrency KPI Dashboard in Power BI?
🔹 Crypto Investors & Traders
🔹 Blockchain Developers & Analysts
🔹 Financial Analysts & Portfolio Managers
🔹 Cryptocurrency Exchanges & Blockchain Startups
🔹 Business Owners Exploring Blockchain Technology
🔹 Financial Institutions and Advisors
Make smarter investment decisions, track the performance of your cryptocurrency portfolio, and gain valuable insights into the blockchain ecosystem with the Blockchain Cryptocurrency KPI Dashboard in Power BI.
Click here to read the Detailed blog post
Visit our YouTube channel to learn step-by-step video tutorials
Youtube.com/@PKAnExcelExpert


Reviews
There are no reviews yet.