In today’s fast-paced biotech and healthcare industry, companies deal with massive amounts of complex data every day. However, turning that data into meaningful insights is not always easy. As a result, many organizations struggle with slow decision-making, scattered reports, and missed growth opportunities.
👉 What if you could track funding, valuation, revenue, and performance in one powerful dashboard?
Introducing the Bioinformatics Companies Dashboard in Power BI – a smart, interactive, and ready-to-use solution designed to transform complex data into clear, actionable insights. This dashboard helps you monitor business performance, identify trends, and make faster, data-driven decisions with confidence.
Whether you are managing financial metrics, analyzing product performance, or tracking regional growth, this dashboard gives you everything in one place.
🚀 Key Features of Bioinformatics Companies Dashboard in Power BI
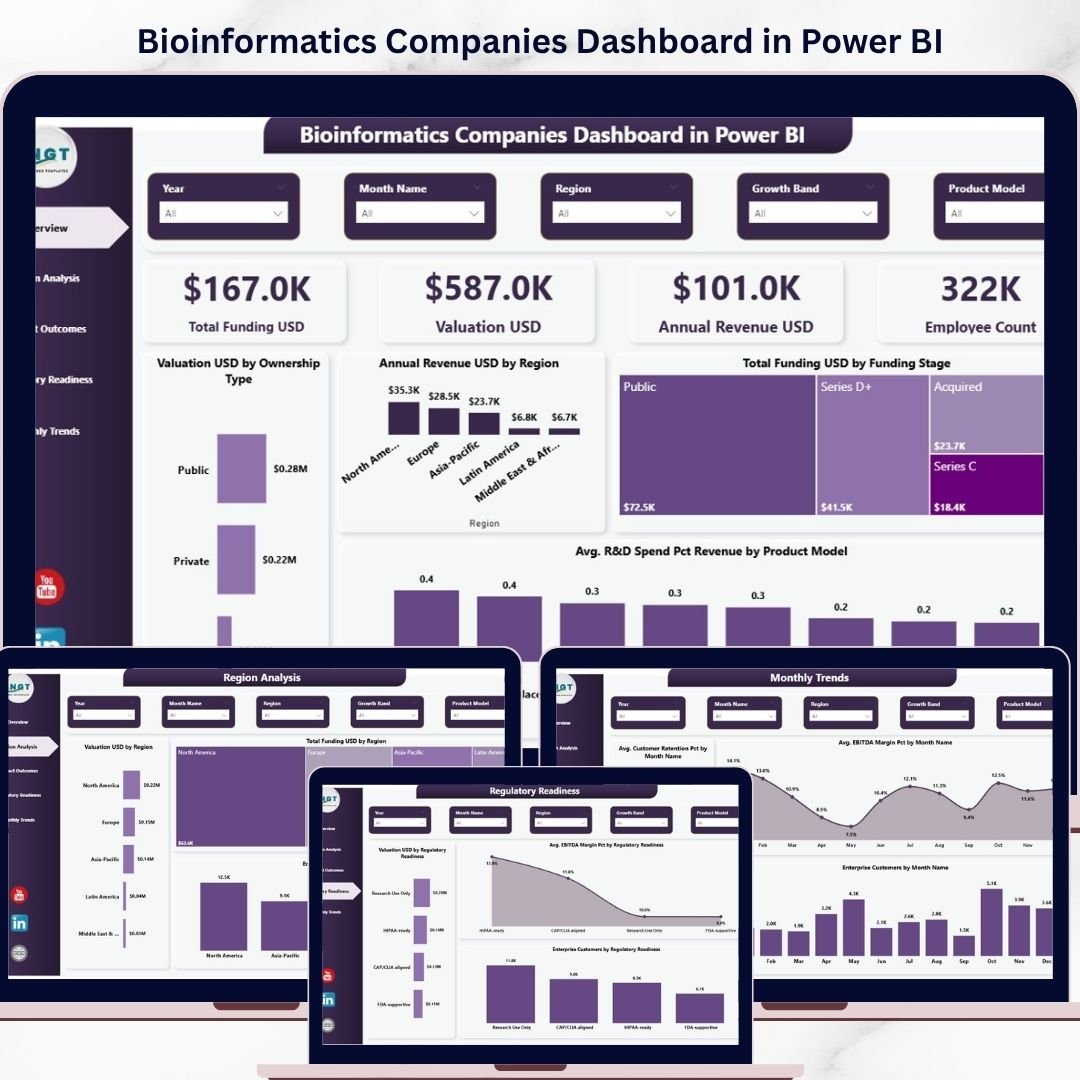
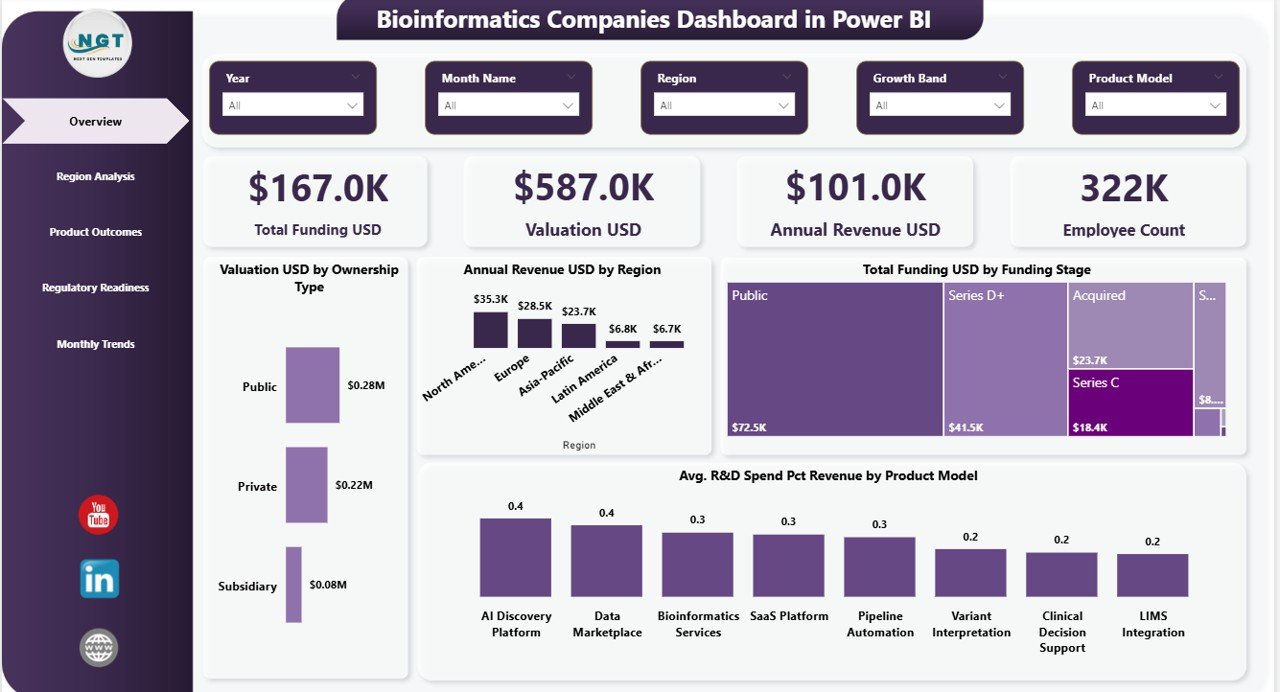
✨ Interactive Overview Dashboard – Get a complete snapshot with KPI cards like Total Funding, Valuation, Revenue, and Employee Count
📊 Advanced Data Visualization – Analyze trends using charts like Valuation by City, Revenue by Region, and Funding by Stage
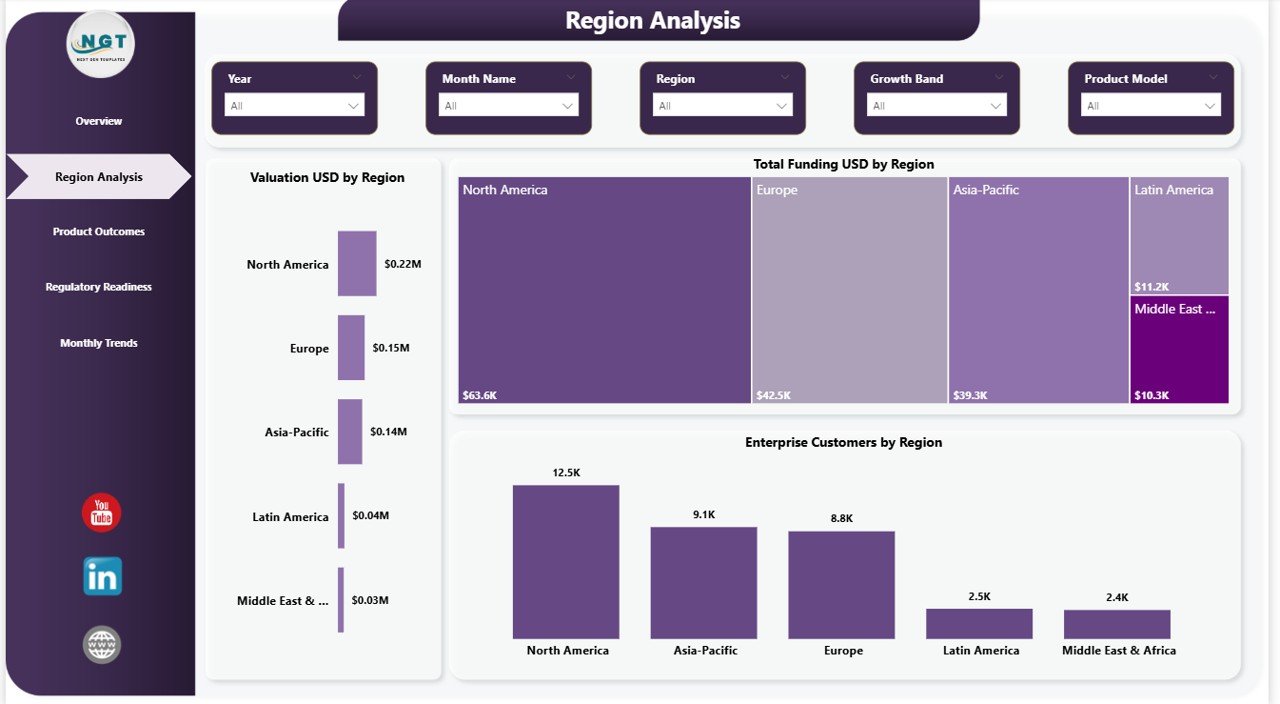
🌍 Region-Based Insights – Identify high-performing regions and growth opportunities instantly
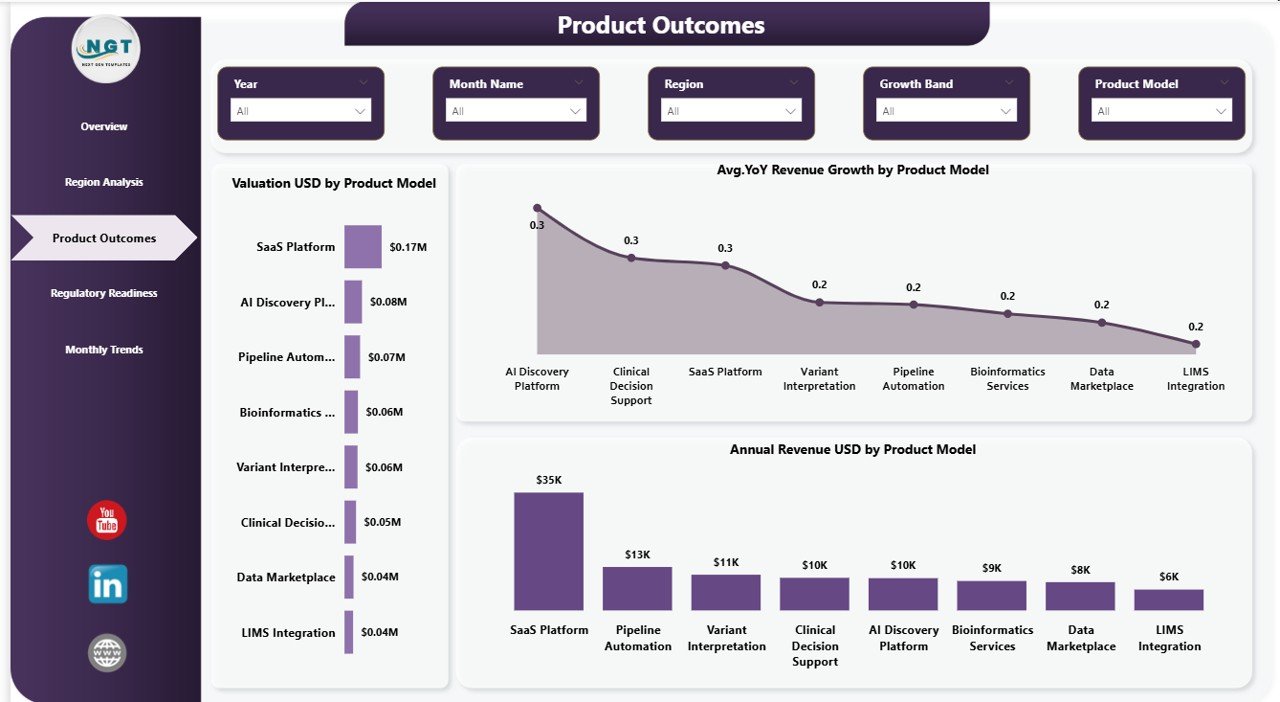
📈 Product Model Analysis – Track performance of different product models and optimize strategies
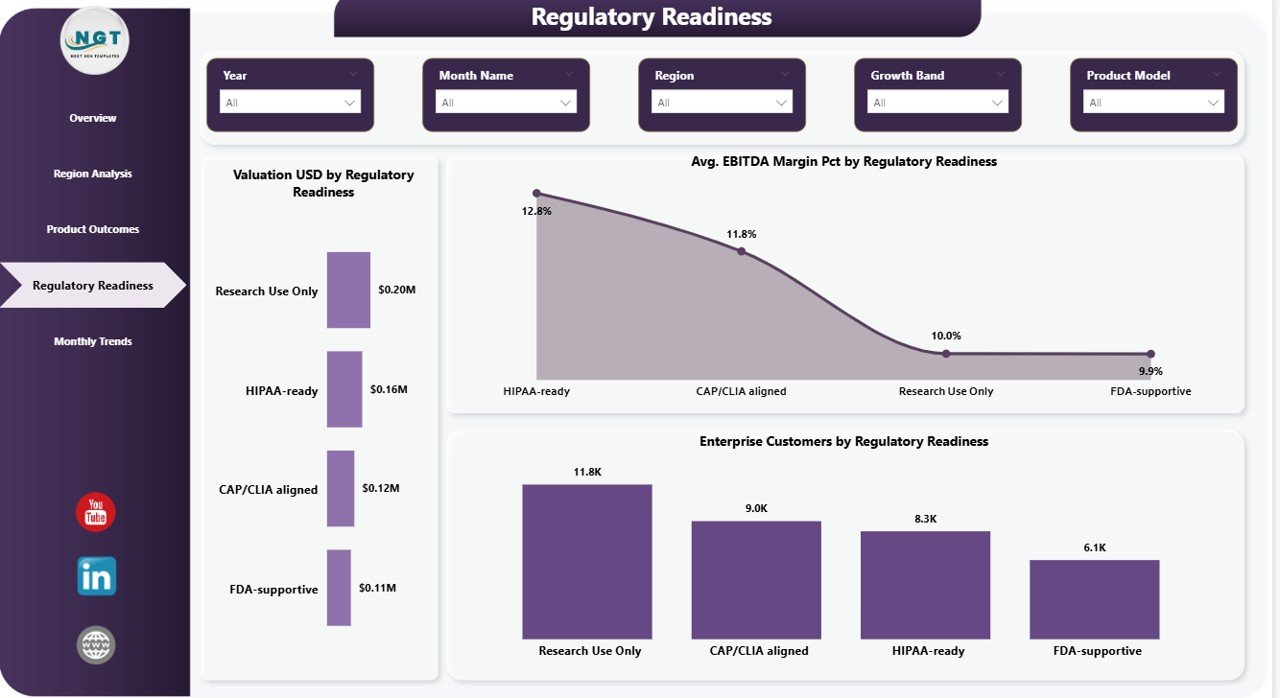
📉 Regulatory Readiness Tracking – Understand how compliance impacts valuation, revenue, and customer growth
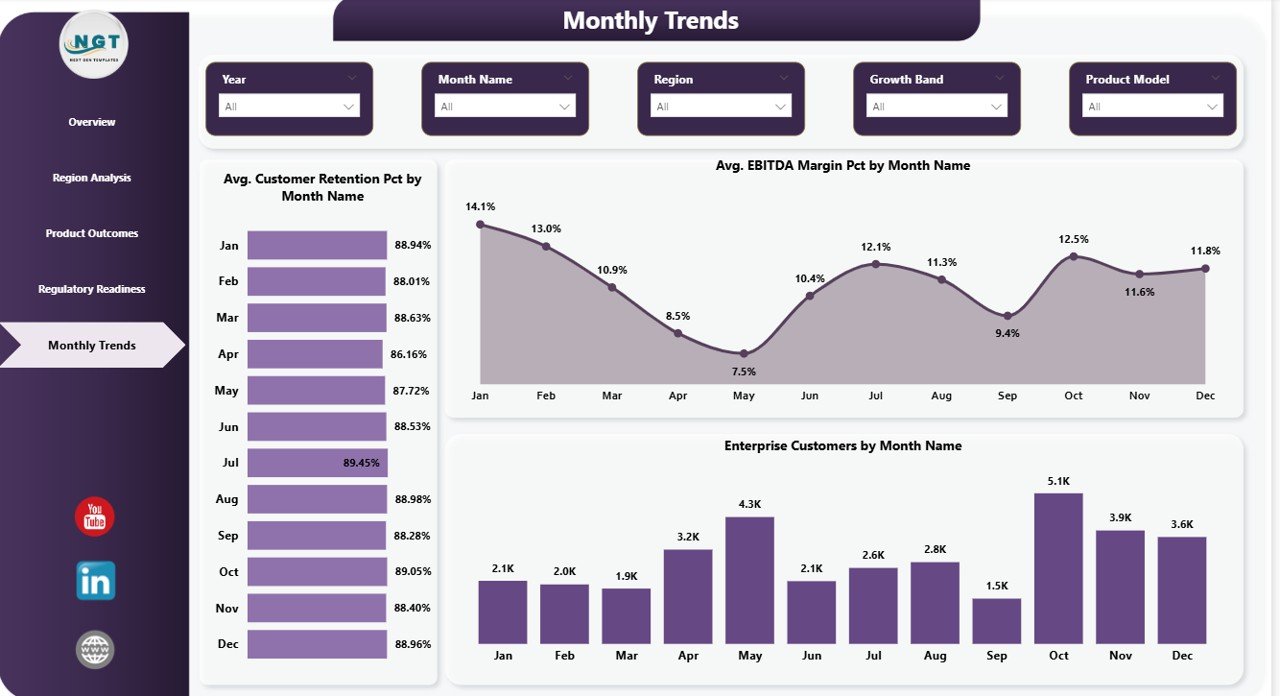
📅 Monthly Trend Analysis – Monitor retention, EBITDA margin, and customer growth over time
🎯 Dynamic Slicers & Filters – Drill down data by region, product model, and time period effortlessly
⚡ Real-Time Insights – Make faster decisions with updated and interactive reports
📦 What’s Inside the Bioinformatics Companies Dashboard in Power BI
📁 Power BI Dashboard File (.pbix) – Fully interactive and ready to use
📊 5 Detailed Dashboard Pages:
- Overview Page (High-level KPIs & summary)
- Region Analysis (Geographical insights)
- Product Model Analysis (Performance tracking)
- Regulatory Readiness (Compliance insights)
- Monthly Trends (Time-based analysis)
📌 Pre-built Visuals & Charts – No need to design from scratch
🎛️ Interactive Filters & Slicers – Easy navigation and deep analysis
📑 Structured Data Model – Organized for smooth performance
⚙️ How to Use the Bioinformatics Companies Dashboard in Power BI
Using this dashboard is simple and requires minimal effort:
1️⃣ Load your dataset into Power BI
2️⃣ Connect your data sources easily
3️⃣ Apply necessary transformations if needed
4️⃣ Use slicers to filter and analyze data
5️⃣ Explore charts and KPI metrics
6️⃣ Generate insights for smarter decision-making
💡 Even with basic Power BI knowledge, you can start using this dashboard immediately.
👥 Who Can Benefit from This Bioinformatics Companies Dashboard in Power BI
This dashboard is perfect for:
👨🔬 Bioinformatics Companies – Track performance, funding, and growth
📊 Data Analysts & Scientists – Analyze complex datasets efficiently
🏥 Healthcare Professionals – Monitor operational and financial metrics
📈 Business Analysts – Generate actionable insights quickly
💼 Investors & Stakeholders – Evaluate company performance
🔬 Research Organizations – Simplify research and financial data
👉 If you work with bioinformatics or healthcare data, this dashboard is a must-have tool.
This dashboard not only simplifies complex data but also empowers you to make faster and more accurate decisions. Instead of wasting hours on manual reports, you can now focus on insights that drive growth and innovation.
Moreover, with real-time analytics and interactive visuals, you can identify trends, optimize strategies, and stay ahead in the competitive biotech industry.


