
In today’s fast-paced healthcare environment, managing bariatric surgery data can be overwhelming. From tracking patient BMI changes to analyzing surgery performance and monitoring costs, healthcare professionals often rely on scattered spreadsheets and manual reports. As a result, decision-making becomes slow and inefficient.
👉 What if you could manage everything in one smart and interactive dashboard?
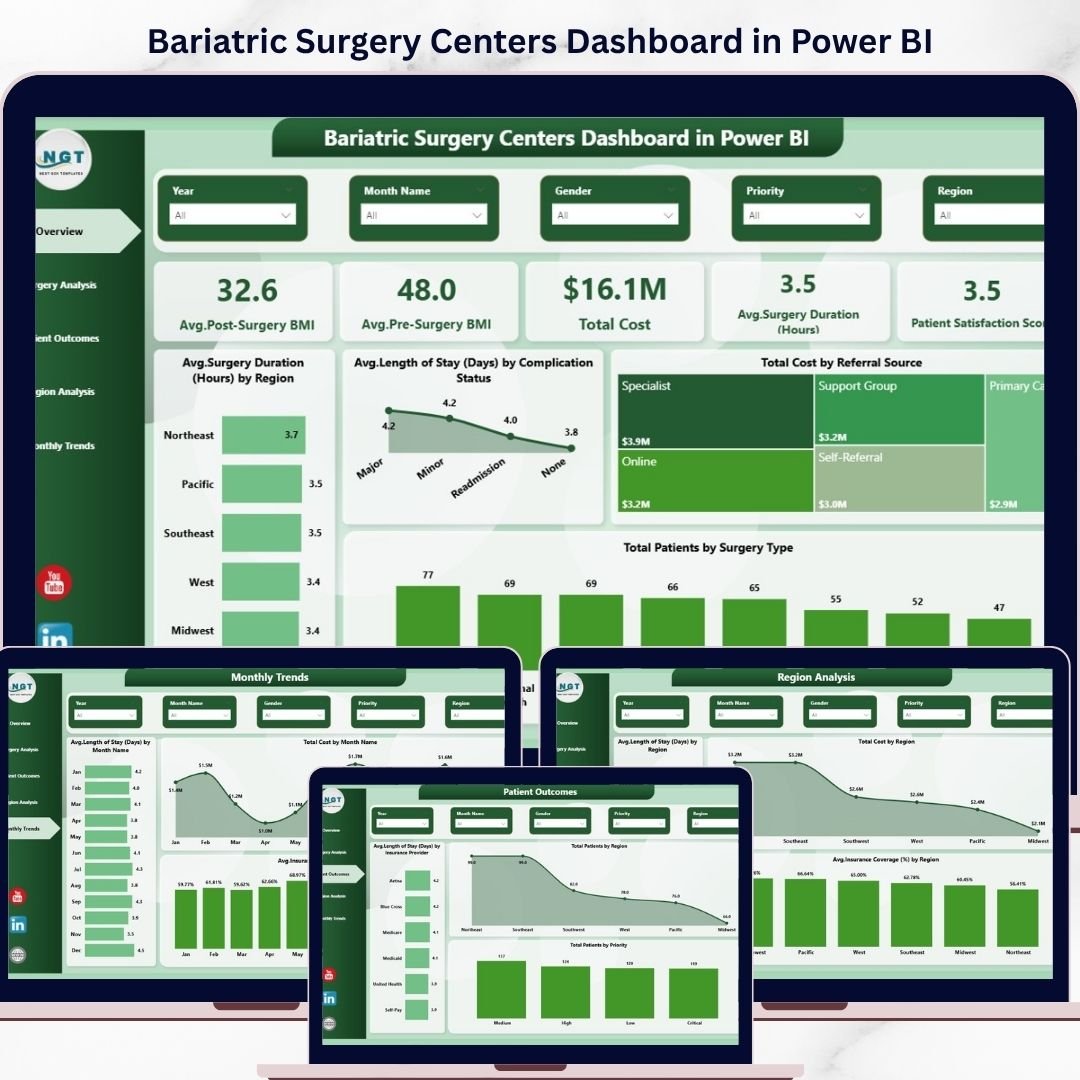
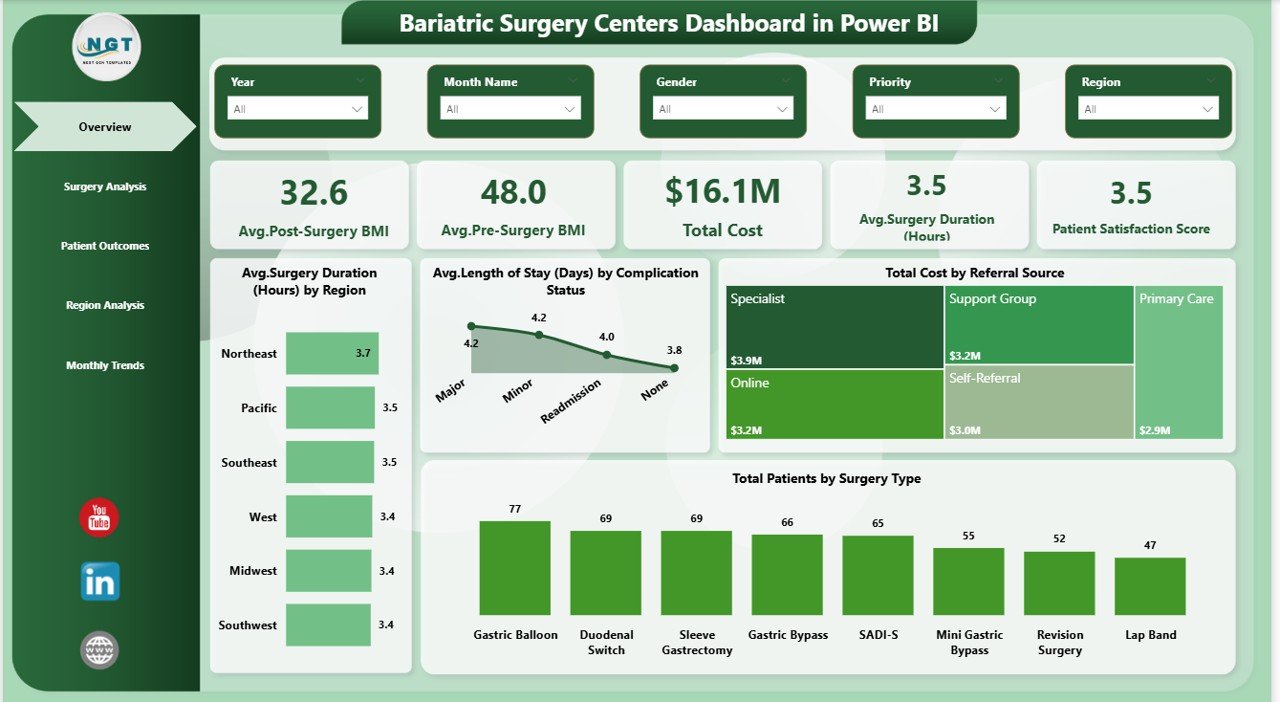
Introducing the Bariatric Surgery Centers Dashboard in Power BI — a powerful, ready-to-use solution designed to help hospitals and surgery centers track key performance indicators, improve patient outcomes, and make faster data-driven decisions.
This dashboard transforms complex healthcare data into simple, visual insights. Whether you want to monitor BMI trends, evaluate surgery performance, or optimize costs, everything is available in one centralized platform.
🚀 Key Features of Bariatric Surgery Centers Dashboard in Power BI
📊 Interactive Overview Dashboard – Get a quick snapshot of KPIs like BMI, cost, surgery duration, and satisfaction score
📉 Pre & Post Surgery BMI Tracking – Easily monitor patient progress and treatment effectiveness
💰 Advanced Cost Analysis – Identify cost trends and optimize financial planning
⏱️ Surgery Performance Insights – Analyze surgery duration and efficiency across different categories
🌍 Region-Based Insights – Compare performance across regions and identify improvement areas
🏥 Patient Outcome Monitoring – Track recovery, complications, and satisfaction levels
📈 Monthly Trend Analysis – Understand time-based performance and forecast future trends
🎯 Dynamic Slicers & Filters – Customize your analysis with interactive filtering options
📦 What’s Inside the Bariatric Surgery Centers Dashboard in Power BI
This professionally designed Power BI dashboard includes 5 powerful and interactive pages:
📍 Overview Page
- KPI Cards: Avg. Pre/Post Surgery BMI, Total Cost, Surgery Duration, Satisfaction Score
- Charts: Surgery duration by region, length of stay by complication status, cost by referral source, patients by surgery type
📍 Surgery Analysis Page
- Compare surgery types based on BMI and duration
- Identify the most efficient surgical procedures
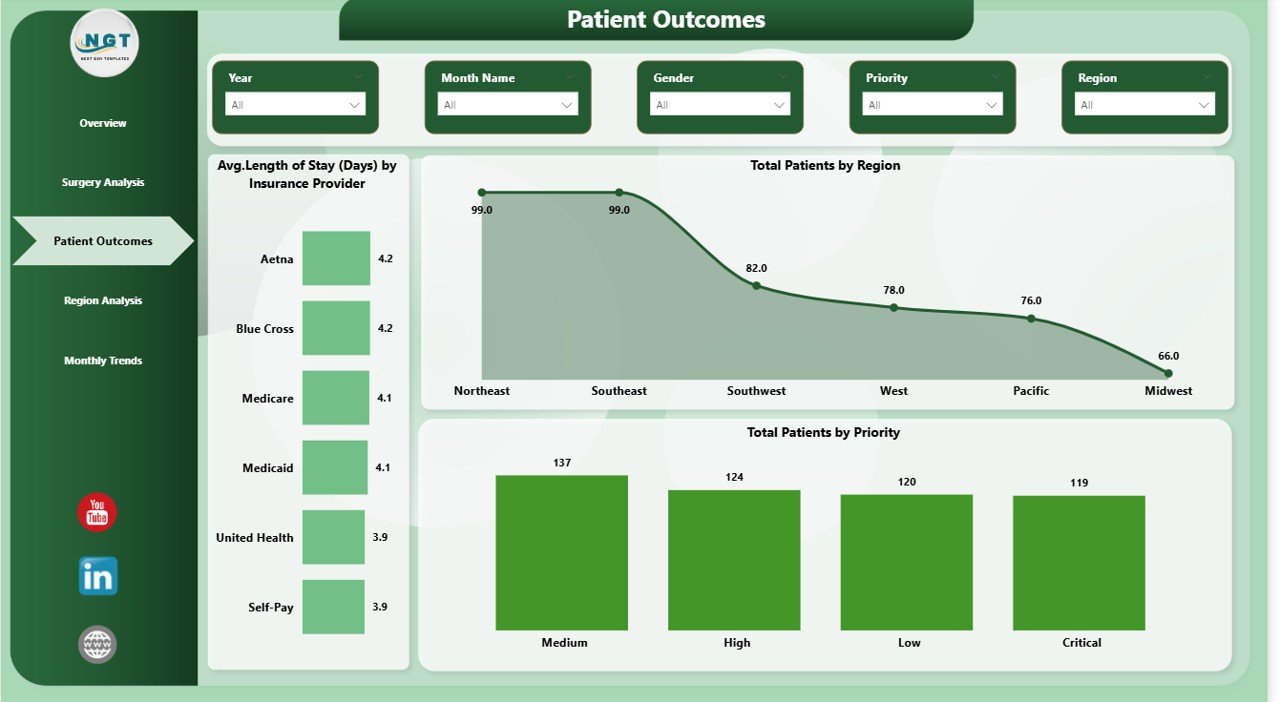
📍 Patient Outcomes Page
- Analyze patient distribution by region and priority
- Evaluate length of stay based on insurance providers
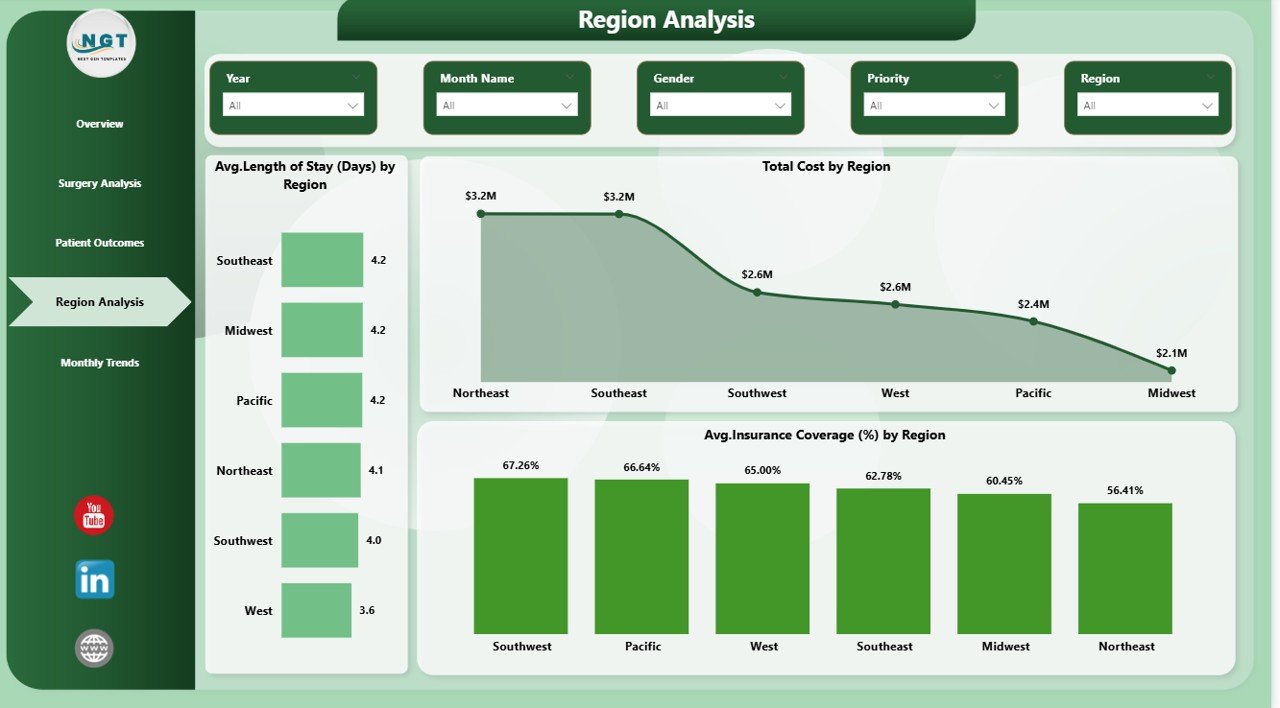
📍 Region Analysis Page
- Compare cost, insurance coverage, and performance across regions
- Identify high-performing and low-performing areas
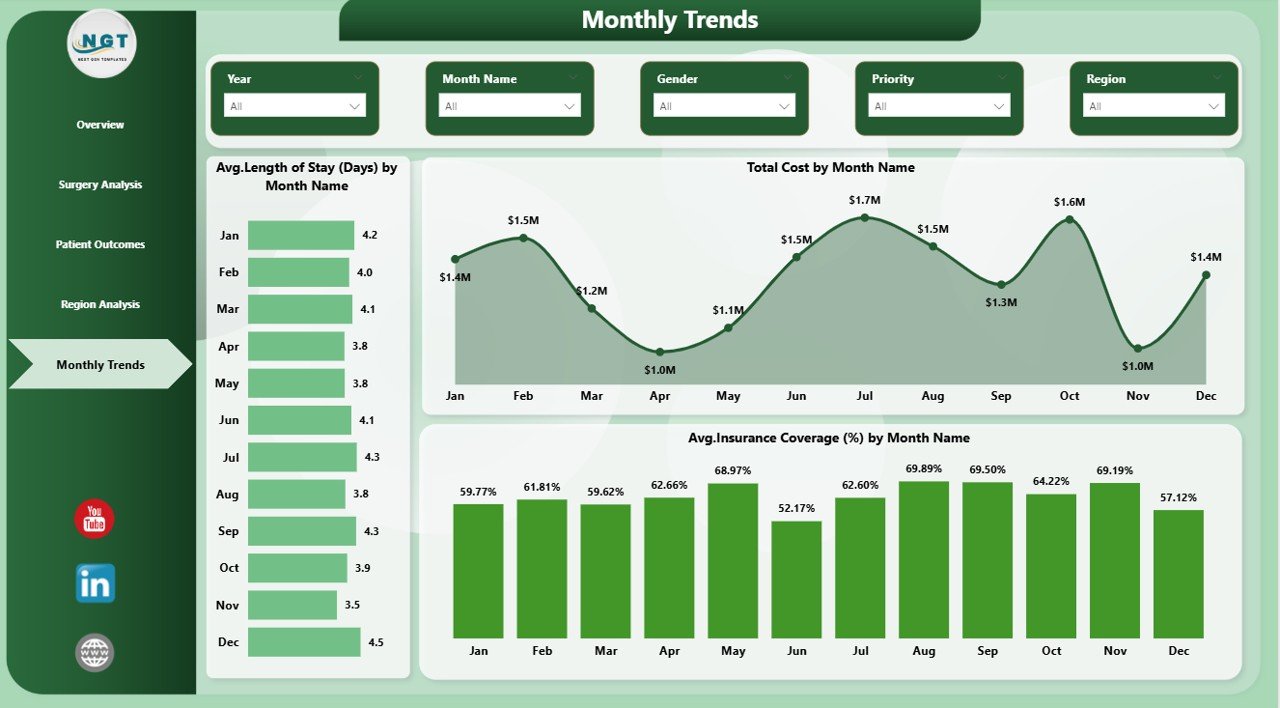
📍 Monthly Trends Page
- Track cost, length of stay, and insurance coverage trends over time
- Support forecasting and long-term planning
⚙️ How to Use the Bariatric Surgery Centers Dashboard in Power BI
1️⃣ Import your dataset into Power BI
2️⃣ Connect your data with the dashboard model
3️⃣ Use slicers to filter by region, surgery type, or time period
4️⃣ Analyze KPI cards and charts to identify trends
5️⃣ Make faster and smarter healthcare decisions
💡 The dashboard is user-friendly and does not require advanced technical skills.
👨⚕️ Who Can Benefit from This Bariatric Surgery Centers Dashboard in Power BI
🏥 Hospital Administrators – Monitor operations and improve efficiency
📊 Healthcare Analysts – Perform deep analysis and generate actionable insights
💼 Financial Managers – Track costs and optimize budgets
👨⚕️ Doctors & Medical Teams – Improve patient outcomes and treatment quality
📈 Decision Makers – Make data-driven strategic decisions
This dashboard eliminates the need for multiple reports and manual calculations. Everything is automated, visual, and easy to understand.
👉 Take control of your healthcare data and unlock powerful insights with this advanced Power BI dashboard today!


