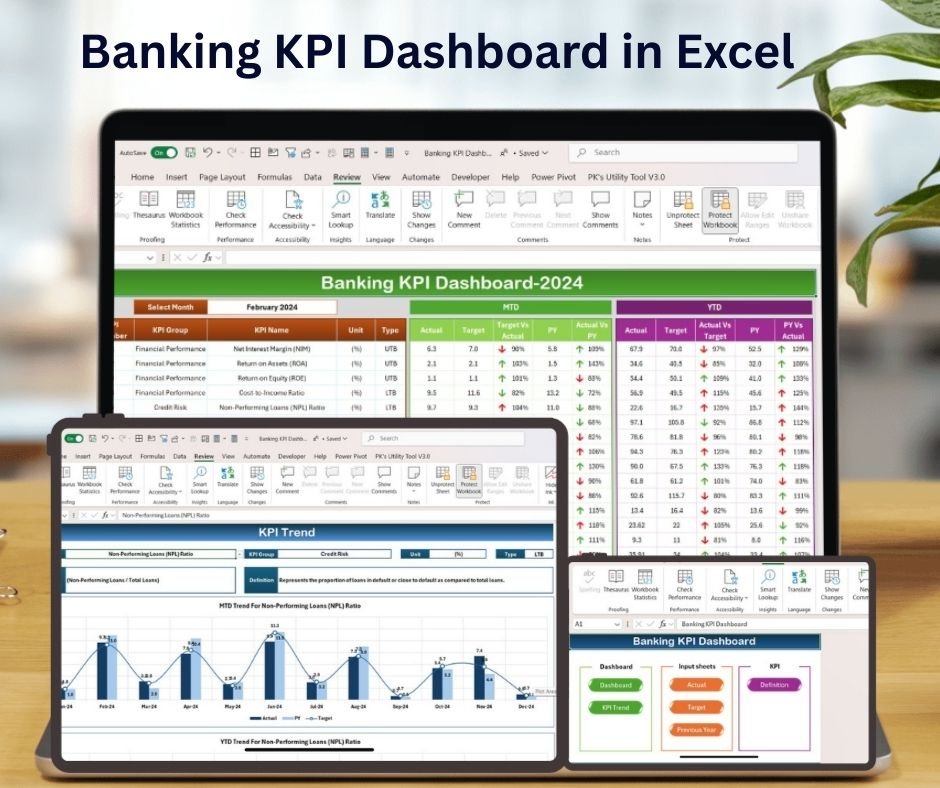
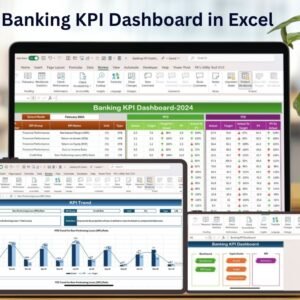
The Banking KPI Dashboard in Excel is an essential tool designed to help banking institutions track, monitor, and optimize key performance indicators (KPIs) that are crucial for financial success and operational efficiency. Whether you are managing retail banking, corporate banking, or investment banking, this customizable dashboard provides a centralized view of vital metrics such as loan performance, customer satisfaction, account growth, and financial performance.
This Excel-based dashboard enables banking professionals to make data-driven decisions, streamline operations, and improve customer service. By tracking KPIs in real-time, this tool helps identify trends, assess risks, and optimize business strategies for better performance.

Key Features of the Banking KPI Dashboard in Excel:
📊 Comprehensive KPI Tracking
Track various banking KPIs, including loan approval rates, deposit growth, account activity, non-performing assets (NPA), and customer satisfaction—all in one place.
📈 Real-Time Performance Monitoring
Monitor the performance of your bank in real-time, ensuring that you stay updated on key financial metrics, loan performance, and customer engagement.
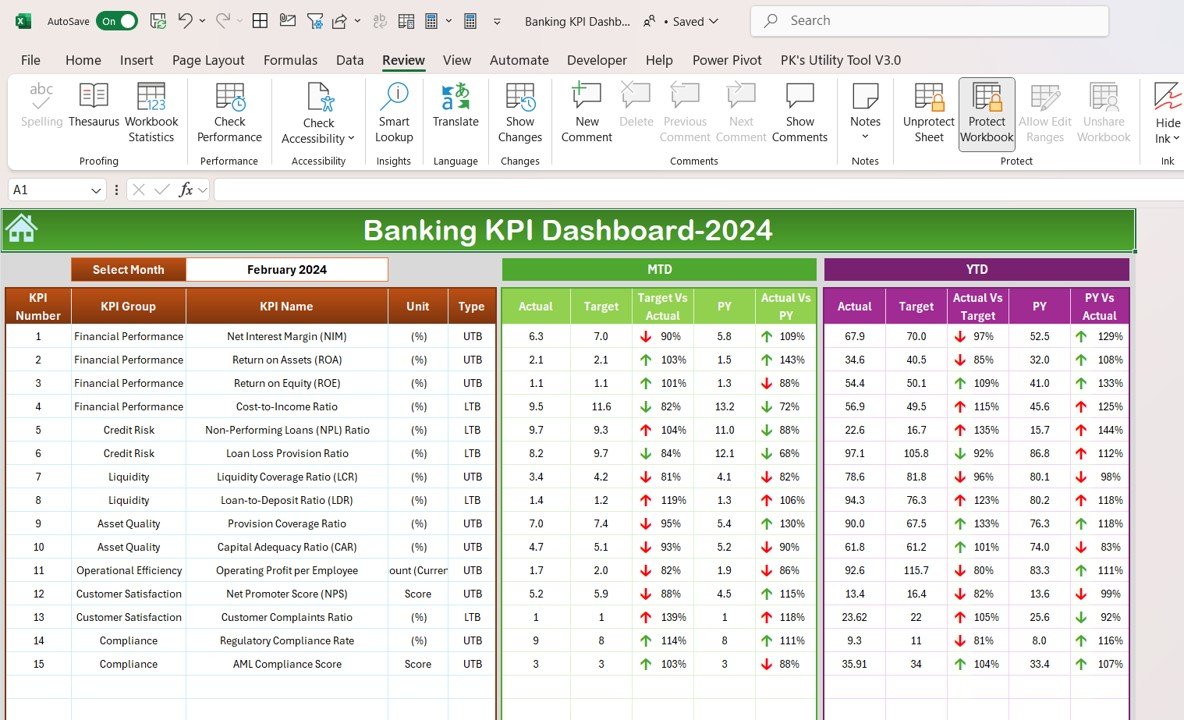
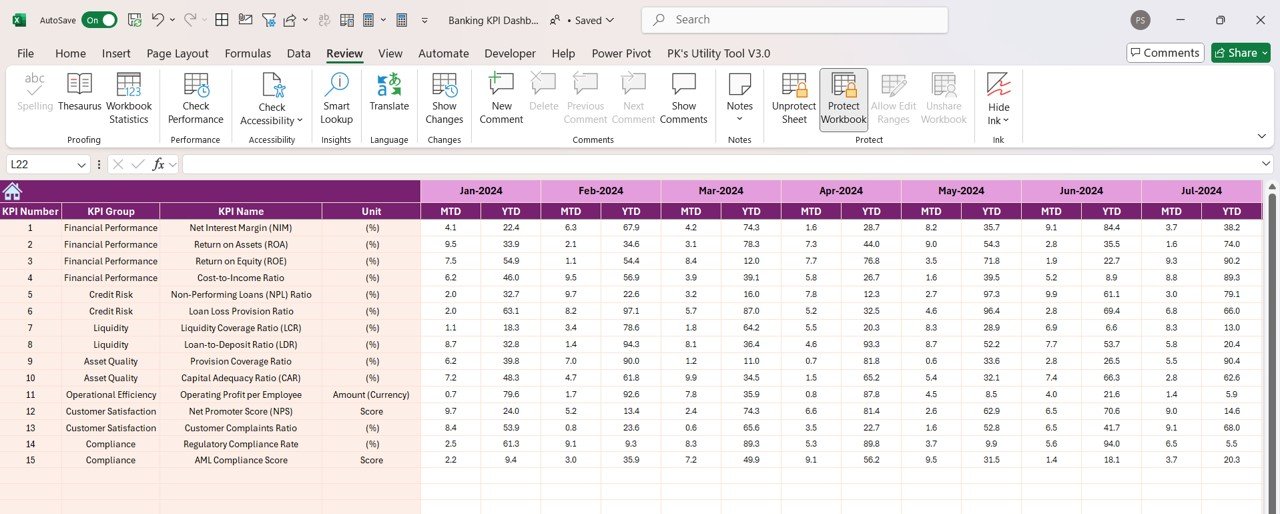
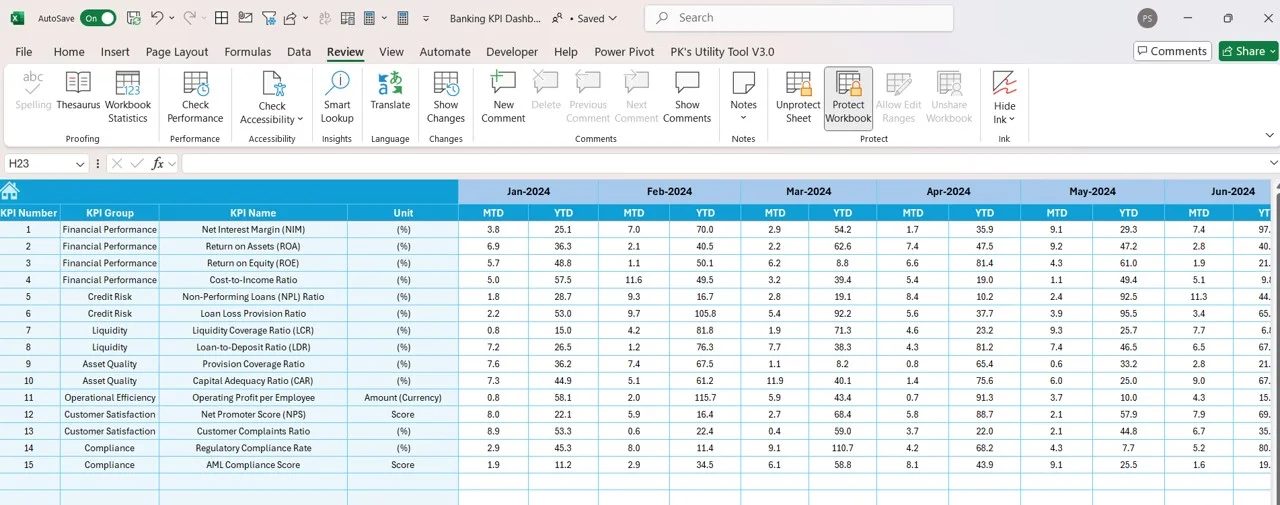
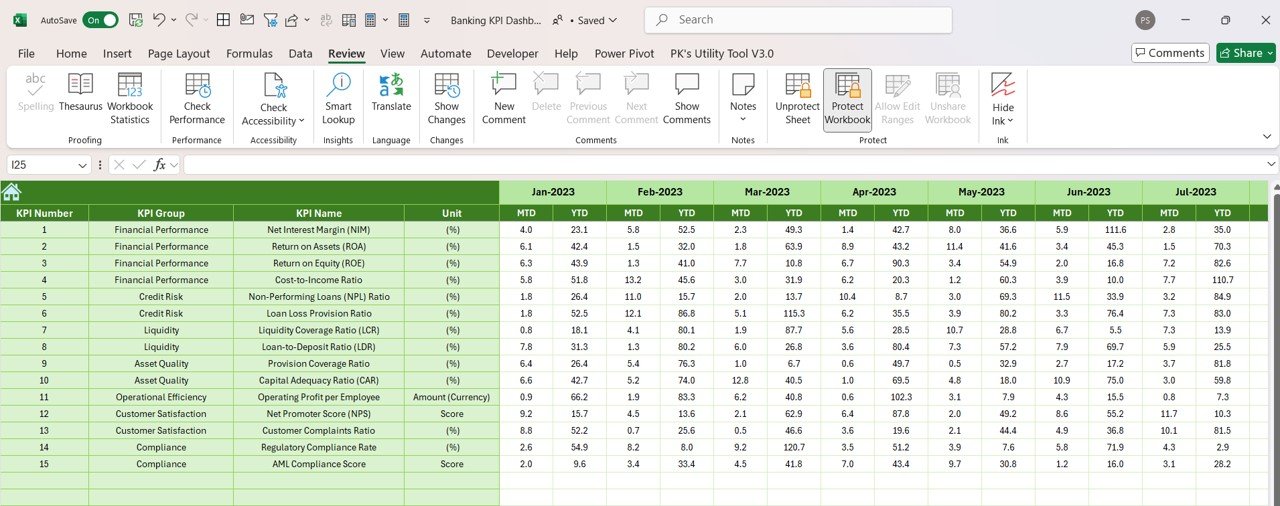
📅 Month-to-Date (MTD) and Year-to-Date (YTD) Analysis
Analyze bank performance across different periods, comparing current data with previous months and years to identify trends and areas for improvement.
🎯 Goal Setting and Performance Comparison
Set specific targets for each KPI and compare them with actual performance to ensure that your banking institution meets its financial and customer service goals.
🛠 Customizable Inputs
Easily input your own banking data, including loan applications, deposits, NPA figures, and customer satisfaction ratings. Tailor the dashboard to suit the specific needs of your financial institution.
🔔 Conditional Formatting Alerts
Receive real-time alerts with color-coded indicators to quickly identify underperforming areas such as rising NPAs, declining loan approvals, or customer dissatisfaction.
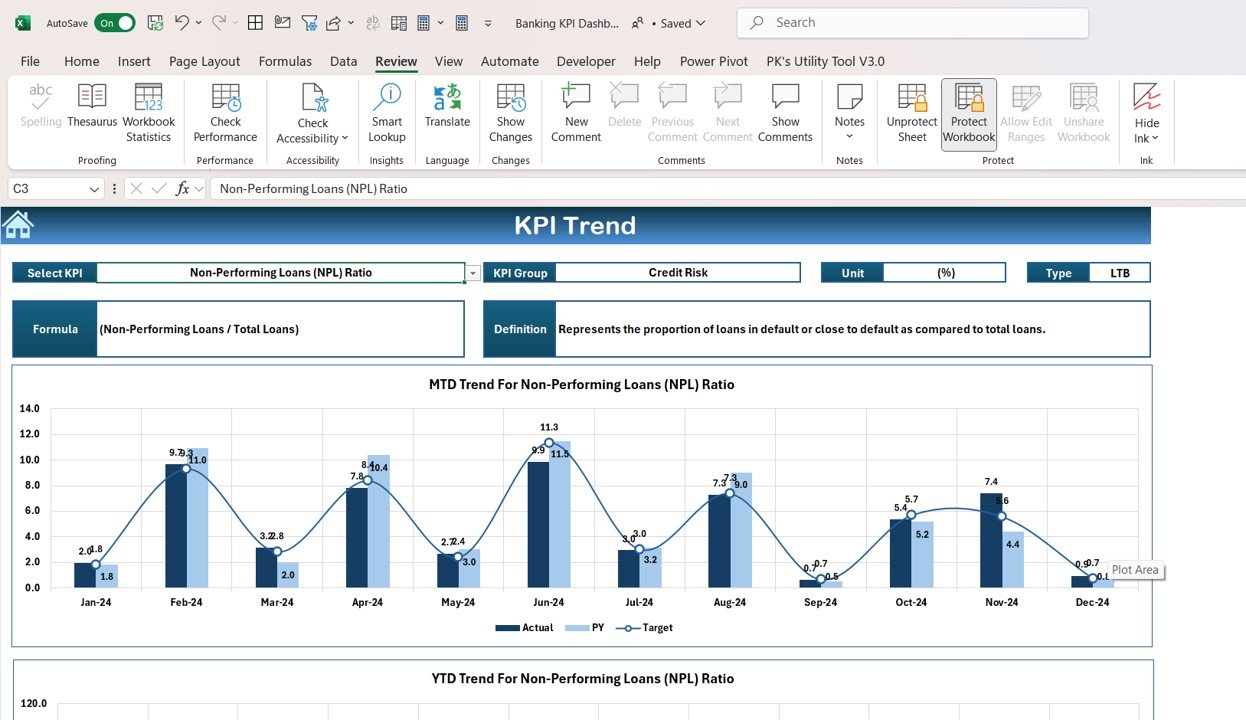
💡 Loan and Deposit Performance Insights
Track loan performance, deposit growth, and account activities with dynamic graphs that help you manage credit risk and optimize asset growth.
🚀 Why You’ll Love the Banking KPI Dashboard in Excel:
✅ Optimize Banking Operations – Track key banking metrics in one place to improve decision-making, reduce risks, and enhance operational efficiency.
✅ Improve Customer Service – Monitor customer satisfaction scores and engagement to ensure your bank is delivering high-quality service.
✅ Enhance Financial Performance – Keep track of financial health indicators like deposits, loans, and NPA to improve profitability.
✅ User-Friendly Interface – Designed for ease of use, this dashboard is perfect for banking managers and professionals, even without advanced technical skills.
✅ Fully Customizable – Tailor the dashboard to your bank’s unique needs, whether you’re focused on retail banking, corporate lending, or investment management.
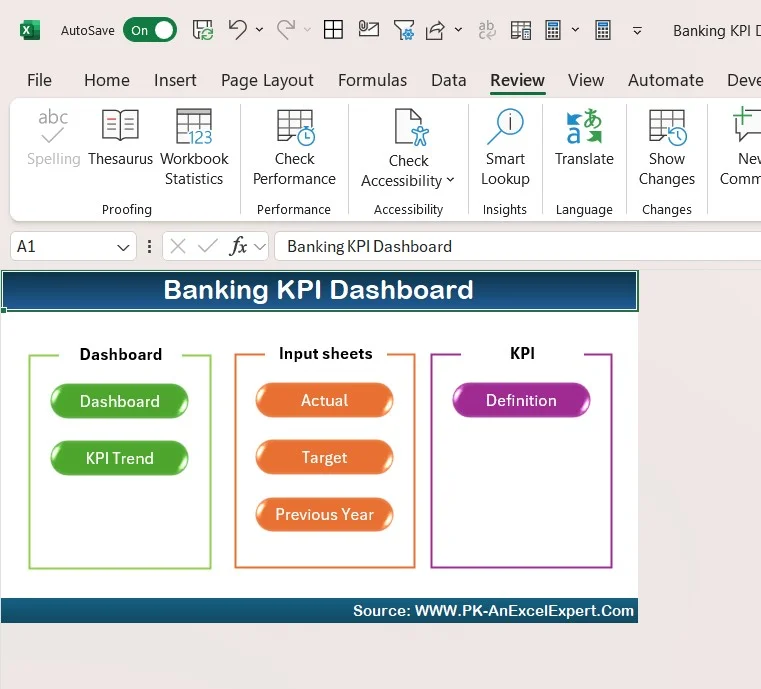
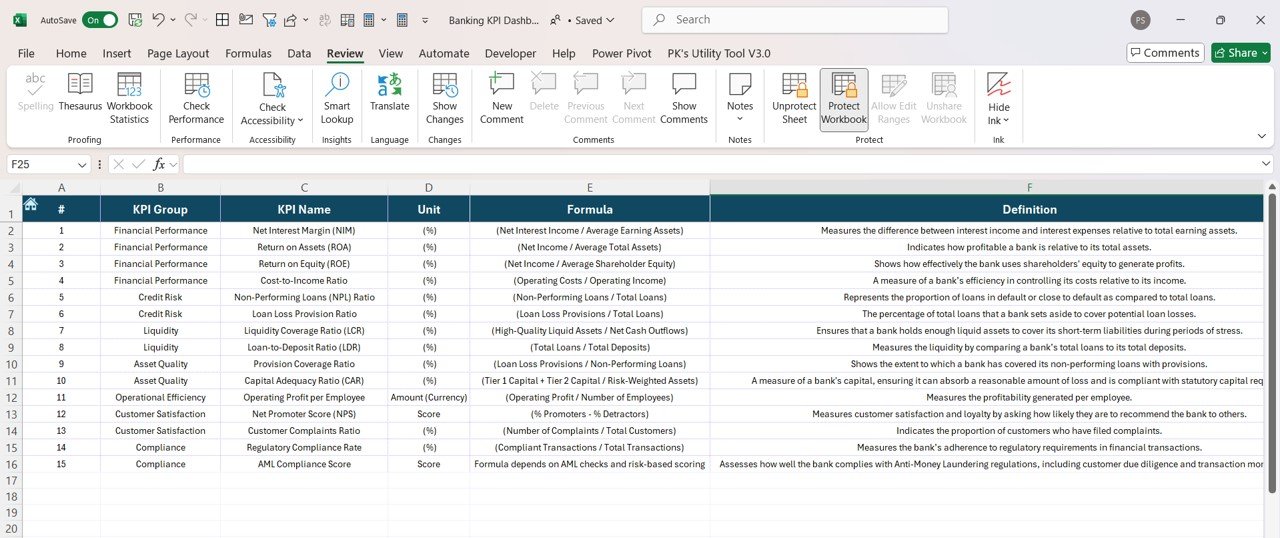
What’s Inside the Banking KPI Dashboard in Excel:
- Loan Approval Rate KPI: Track the percentage of loan applications approved versus total applications received.
- Deposit Growth KPI: Measure the growth of deposits over time, tracking customer savings and investment behavior.
- Account Activity KPI: Monitor active account usage, including transaction frequency, average balances, and account maintenance.
- Non-Performing Assets (NPA) KPI: Track NPAs and assess the health of your bank’s credit portfolio.
- Customer Satisfaction KPI: Evaluate customer feedback and satisfaction levels to improve services.
- Revenue and Profitability KPI: Track revenue, operating income, and profit margins to ensure financial stability and growth.
How to Use the Banking KPI Dashboard in Excel:
1️⃣ Download the Template – Access your Excel file instantly upon purchase.
2️⃣ Input Your Data – Enter your bank’s data such as loan figures, deposits, and customer satisfaction scores into the pre-designed fields.
3️⃣ Set Targets – Define your KPI targets for metrics such as loan approval rates, NPA levels, and deposit growth.
4️⃣ Track Progress – Monitor your performance in real-time and compare actual results to set targets.
5️⃣ Generate Reports – Use the dashboard to generate performance reports for financial analysis, strategic planning, and stakeholder meetings.
Who Can Benefit from the Banking KPI Dashboard in Excel:
- Banking Managers
- Retail Banking Professionals
- Corporate Banking Managers
- Credit Risk Managers
- Customer Relationship Managers
- Investment Bankers
- Financial Analysts
- Business Owners in Financial Services
The Banking KPI Dashboard in Excel is a must-have tool for anyone in the banking industry looking to optimize operations, track financial health, and improve customer service.
Click here to read the Detailed blog post
https://www.pk-anexcelexpert.com/banking-kpi-dashboard-in-excel/
Visit our YouTube channel to learn step-by-step video tutorials
Youtube.com/@PKAnExcelExpert


Reviews
There are no reviews yet.