Transform your manufacturing operations with the Ball Bearing Production Dashboard in Power BI 🚀. In today’s competitive industrial environment, tracking production performance, controlling costs, and ensuring efficiency in real time is critical.
However, relying on disconnected spreadsheets and manual reports slows down decision-making. That’s where this advanced Power BI dashboard becomes a game-changing solution.
This ready-to-use dashboard converts complex production data into interactive visuals, real-time insights, and actionable reports—all in one place. As a result, you can monitor production, analyze costs, track revenue, and improve efficiency effortlessly.
🚀 Key Feature of Ball Bearing Production Dashboard in Power BI
✅ 📊 Interactive Power BI Dashboard
Analyze production data using dynamic charts and slicers.
✅ 📈 Complete Production KPI Tracking
Track batches, costs, revenue, and efficiency in one place.
✅ 📅 Multi-Page Analytical Dashboard
Explore insights across 5 structured pages for deep analysis.
✅ 🔍 Smart Filtering with Slicers
Filter data instantly for customized insights.
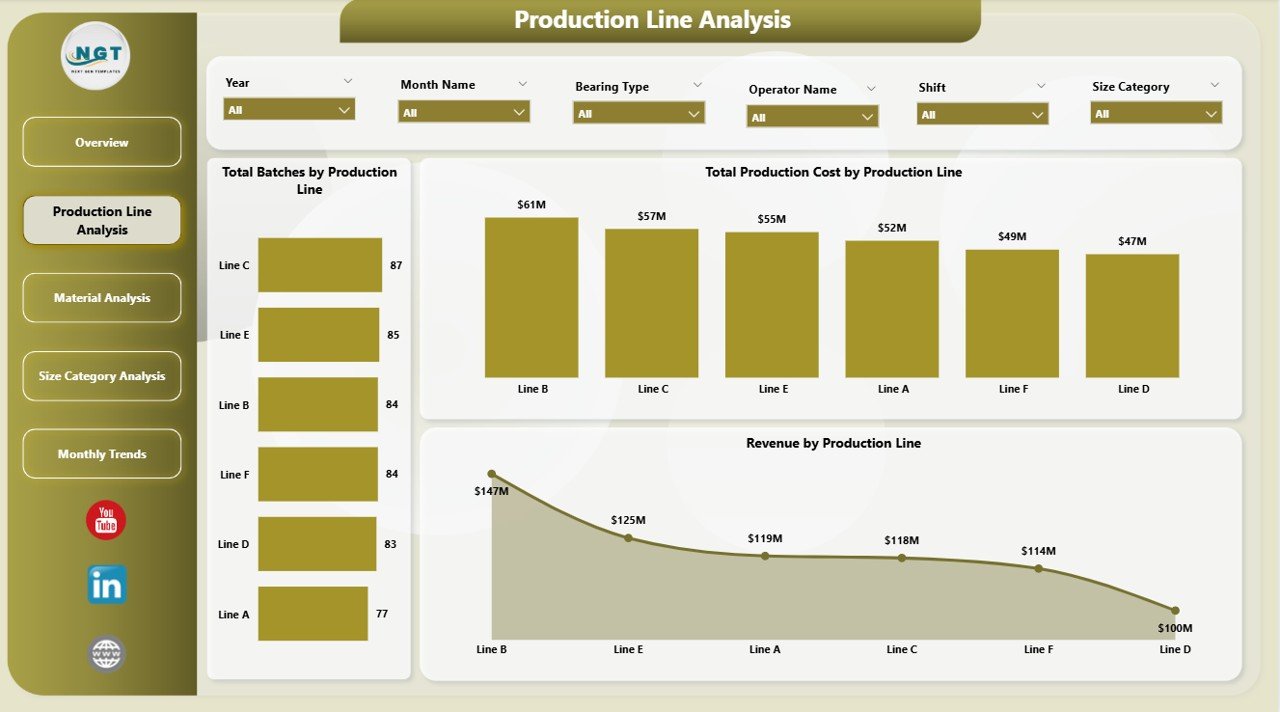
✅ ⚙️ Production Line Insights
Evaluate performance across different production lines.
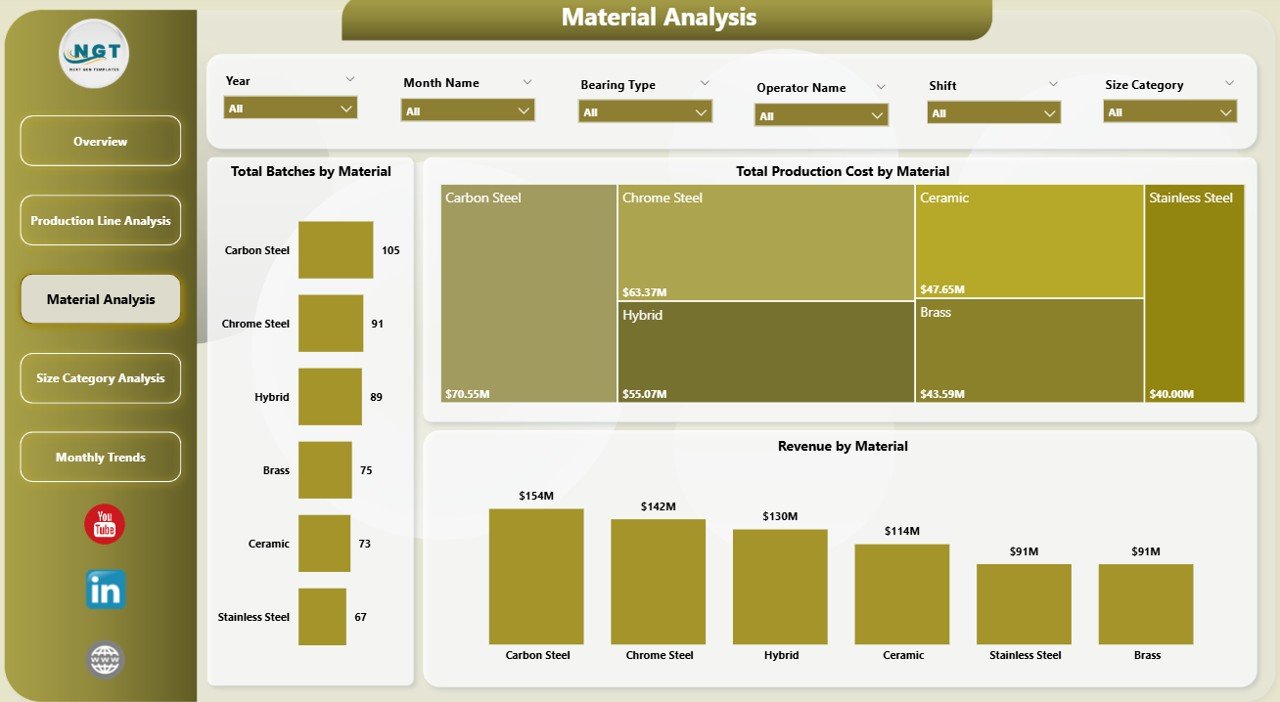
✅ 🧱 Material & Size Analysis
Optimize material usage and product category performance.
✅ ⚡ Real-Time Data Visualization
Get instant updates and faster decision-making.
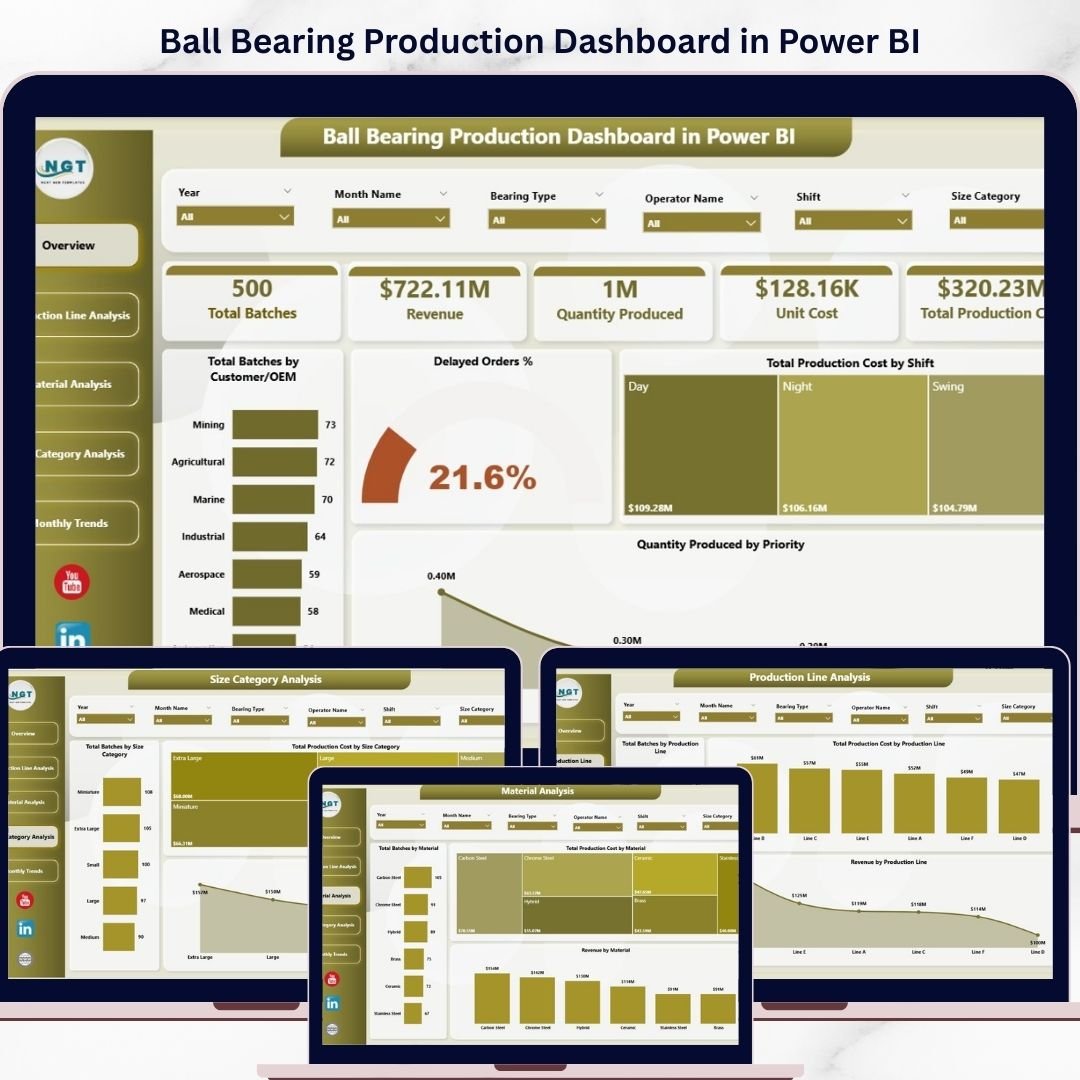
📦 What’s Inside the Ball Bearing Production Dashboard in Power BI
This dashboard includes 5 powerful analytical pages:
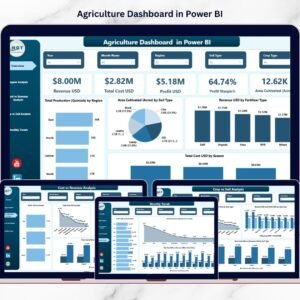
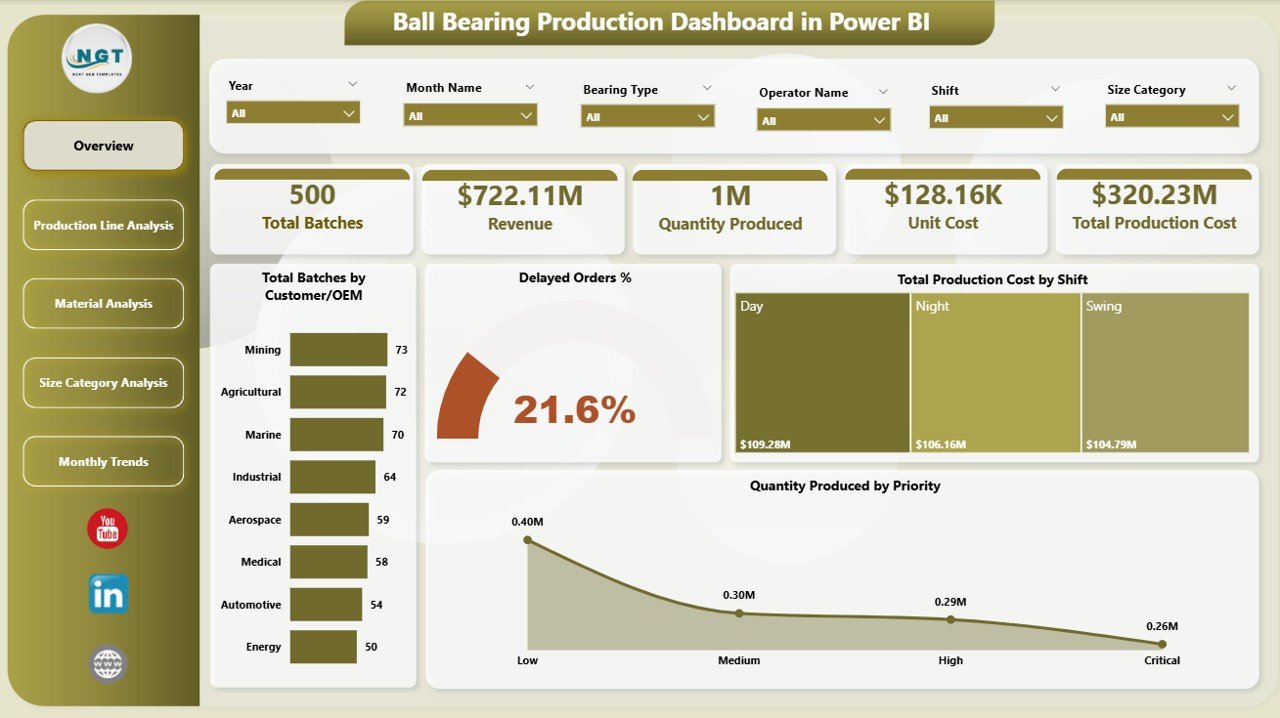
📊 Overview Page – Snapshot of production KPIs with slicers and KPI cards
⚙️ Production Line Analysis – Analyze performance across production lines
🧱 Material Analysis – Evaluate cost and revenue by material
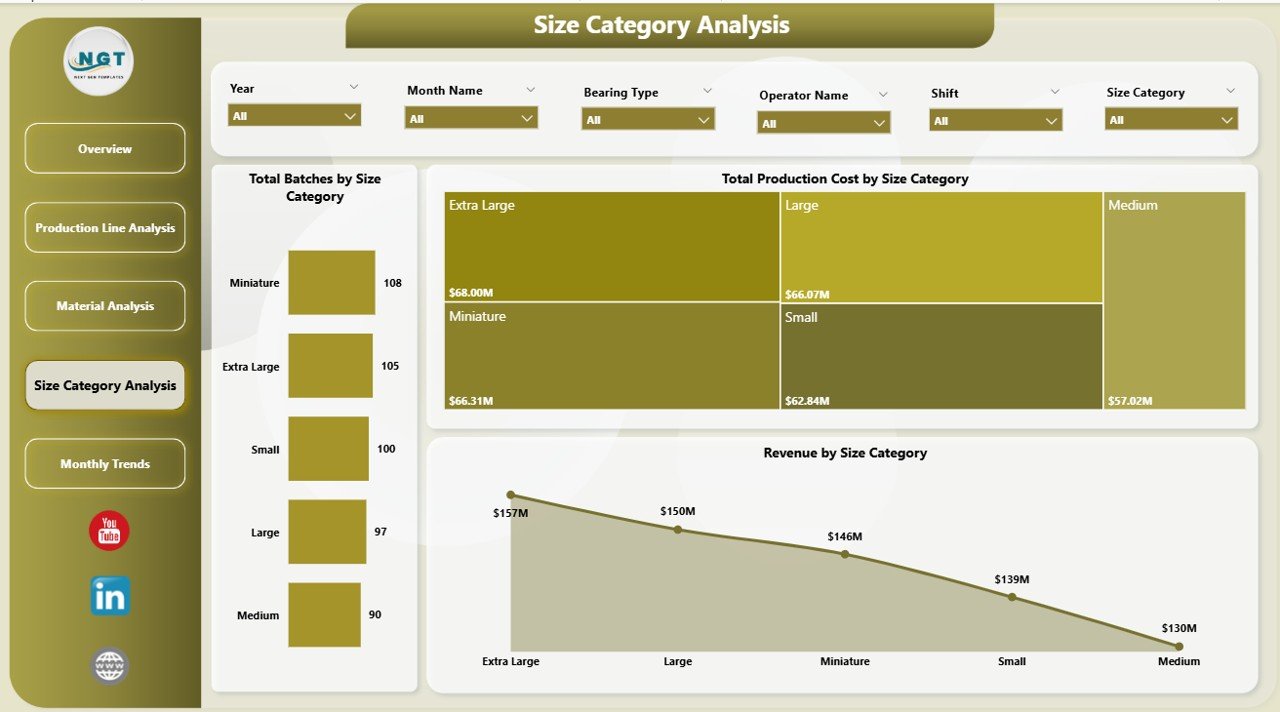
📏 Size Category Analysis – Compare production performance by size
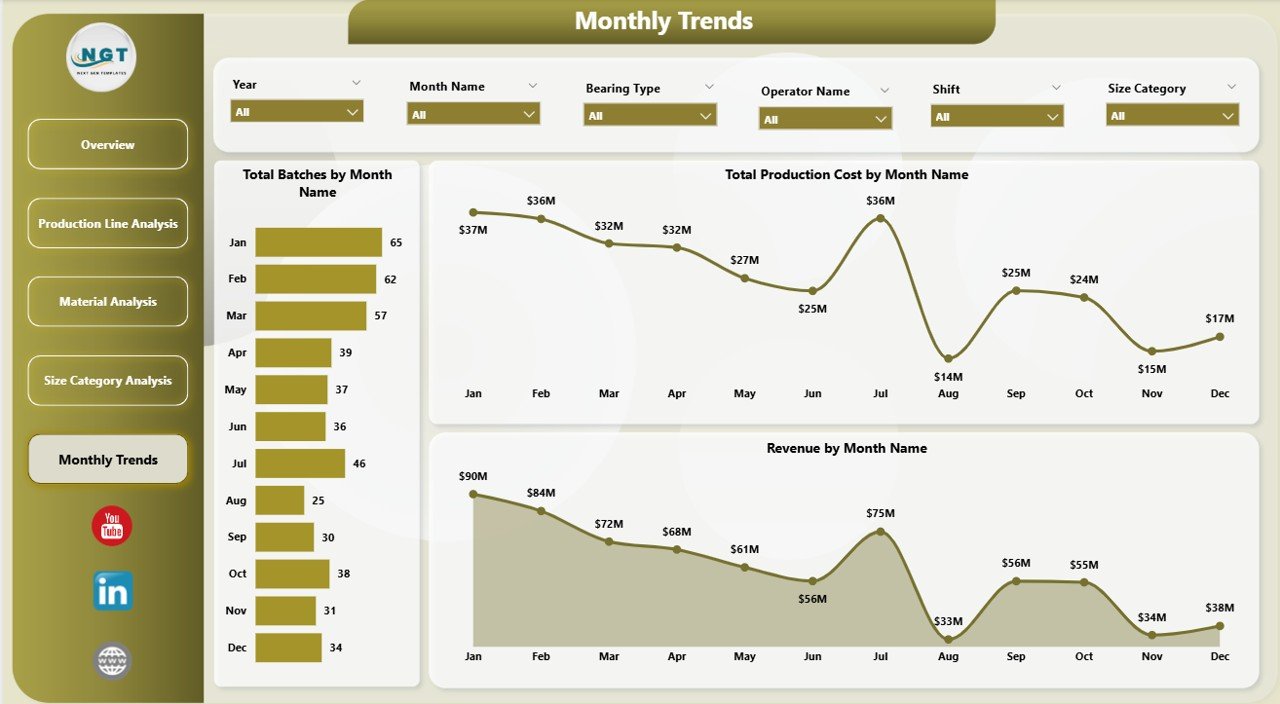
📅 Month Analysis – Track trends and performance over time
Each page is designed to give you a complete 360° production performance view.
⚙️ How to Use the Ball Bearing Production Dashboard in Power BI
Getting started is quick and simple:
👉 Import your production, cost, and revenue data into Power BI
👉 Use slicers to filter by month, material, or production line
👉 Analyze KPI cards for instant insights
👉 Explore each page for detailed analysis
👉 Identify trends and take data-driven actions
Within minutes, you can transform raw manufacturing data into powerful operational intelligence 📊.
👨🏭 Who Can Benefit from This Ball Bearing Production Dashboard in Power BI
This dashboard is perfect for:
🏭 Production Managers – Monitor efficiency and output
💰 Finance Teams – Track costs and profitability
⚙️ Plant Managers – Optimize operations
📊 Business Analysts – Generate insights and reports
🚚 Supply Chain Managers – Improve planning and logistics
Anyone involved in manufacturing, operations, and analytics will benefit from this solution.
🔗 Click hare to read the Detailed blog post
Explore the full guide with detailed features, benefits, and best practices.
👉 Visit our YouTube channel to learn step-by-step video tutorials:
https://youtube.com/@PKAnExcelExpert