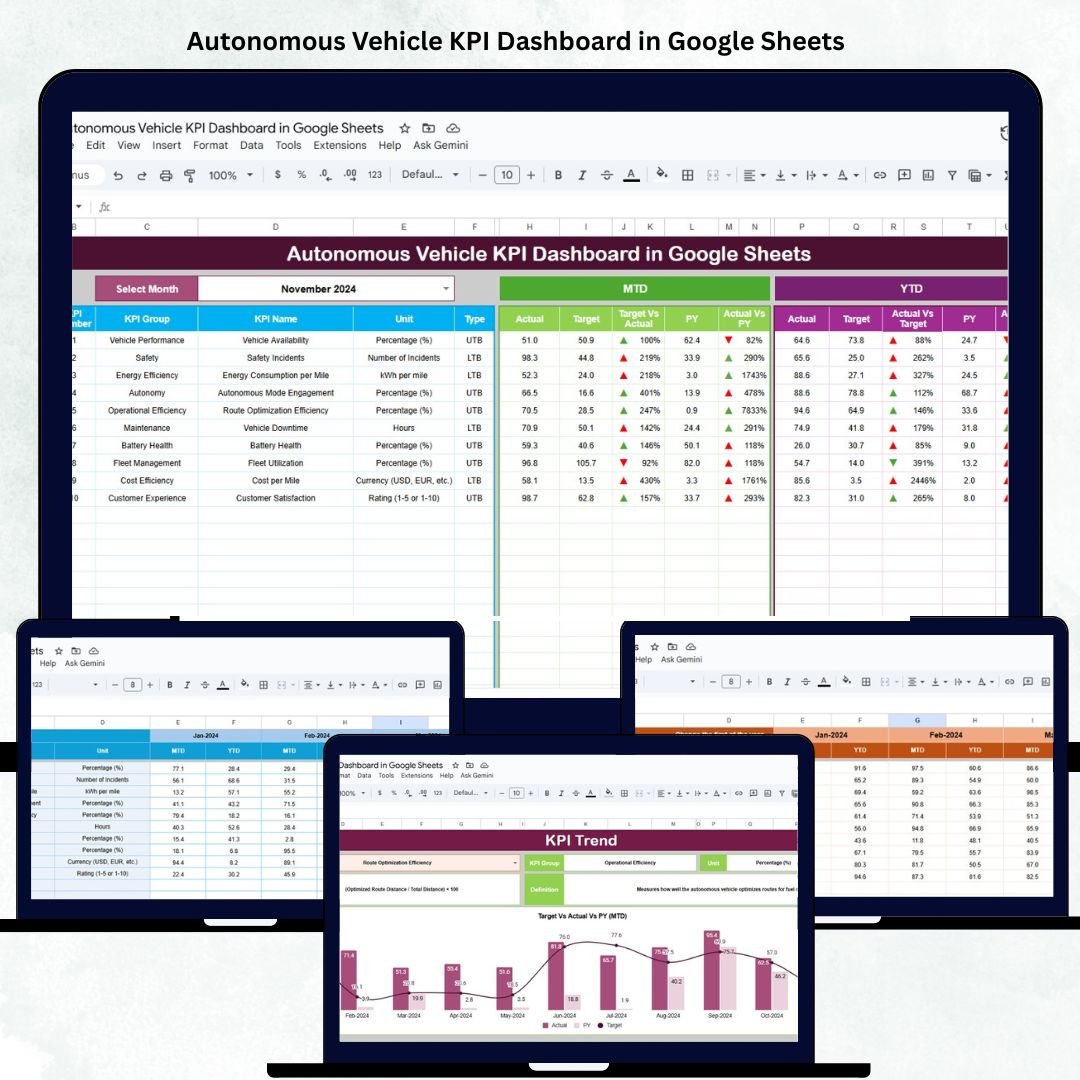
As the automotive industry evolves toward autonomous technology and smart mobility, data accuracy and performance tracking have become more critical than ever. The Autonomous Vehicle KPI Dashboard in Google Sheets is a ready-to-use performance management solution that helps R&D teams, engineers, and fleet managers monitor self-driving vehicle metrics with clarity, precision, and automation. 🚗📊
Built entirely in Google Sheets, this dashboard enables teams to visualize, analyze, and compare critical KPIs — including safety, reliability, decision accuracy, and fuel performance — without the need for expensive analytics software.
With MTD (Month-to-Date) and YTD (Year-to-Date) tracking, trend analysis, and automated data visualization, it ensures data-driven decision-making for autonomous systems and enhances operational visibility across the organization.
🔑 Key Features of the Autonomous Vehicle KPI Dashboard in Google Sheets
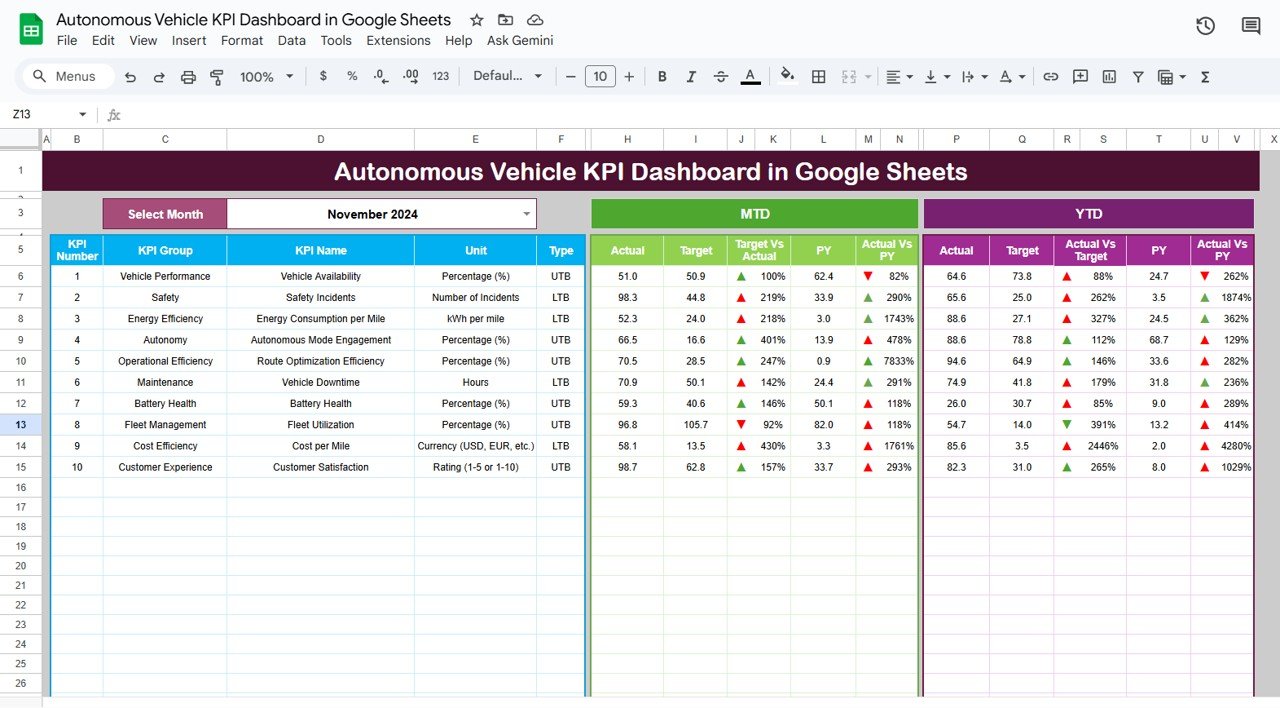
📋 Dashboard Sheet Tab (Main Visualization Hub)
This is the control center of the entire dashboard, offering a visual summary of all performance metrics.
Features:
-
📅 Month Dropdown (Cell D3): Select any month to automatically refresh KPIs and visuals.
-
🔁 MTD and YTD Views: Instantly switch between short-term and cumulative performance data.
-
📈 Target vs Actual Indicators: Quickly see where the metrics stand through color-coded visuals.
-
🔺🔻 Conditional Formatting Arrows: Indicate performance improvement or decline.
Metrics Covered:
-
🚗 Vehicle Reliability
-
⚙️ Operational Efficiency
-
🧠 AI Decision Accuracy
-
🧍 Passenger Comfort Index
-
🔋 Fuel and Energy Efficiency
-
🦺 Safety and Risk Compliance
This centralized sheet gives engineers and decision-makers a clear, real-time overview of vehicle performance at any time.
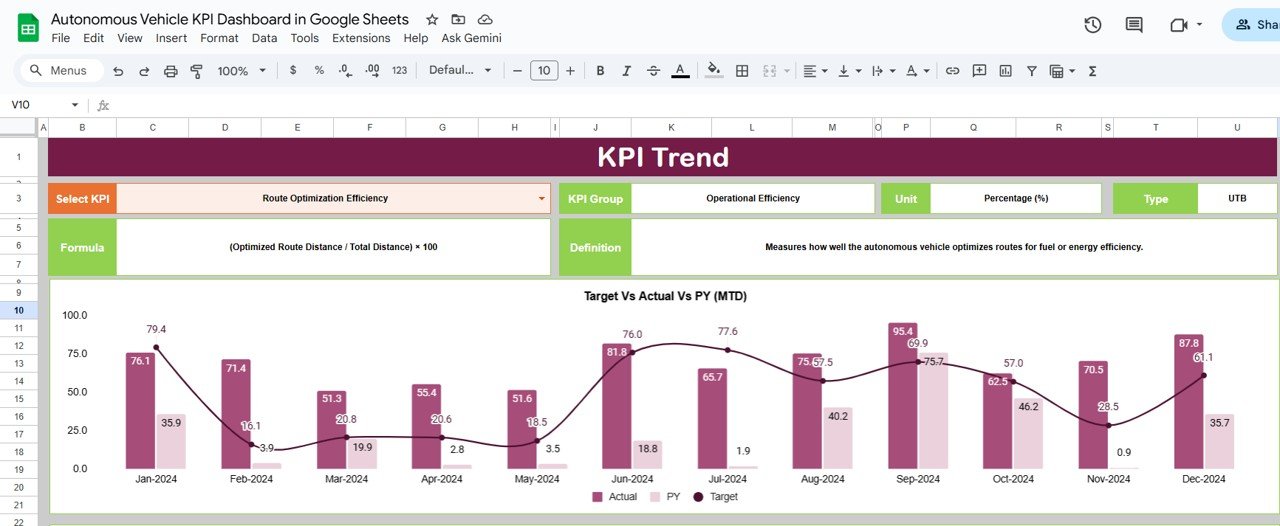
📊 KPI Trend Sheet Tab (Performance Analysis)
This tab provides detailed historical trends and visual insights for each KPI.
Features:
-
Select any KPI from a dropdown (Cell C3).
-
View month-over-month performance graphs.
-
Compare MTD, YTD, Target, and Previous Year (PY) data.
Displayed Details:
-
KPI Group
-
Unit of Measurement
-
Type (UTB – Upper the Better / LTB – Lower the Better)
-
Formula
-
Definition
This helps R&D teams identify performance patterns, detect anomalies, and analyze algorithm efficiency over time.
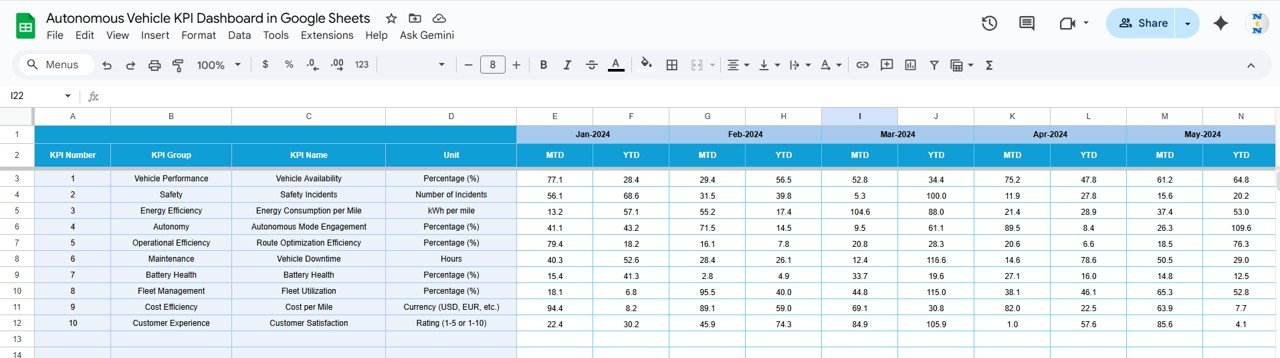
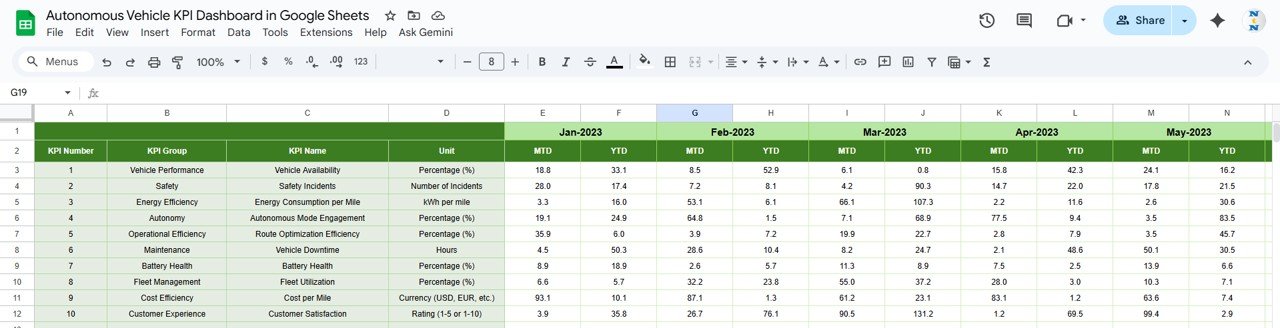
🧾 Actual Number Sheet Tab (Data Entry Section)
Record all actual KPI values for each month and year.
Columns Include:
-
Month
-
Year
-
KPI Name
-
MTD Actual
-
YTD Actual
A dynamic fiscal-year control (Cell E1) adjusts all calculations based on the selected start month — ensuring accurate data rollups and comparisons.
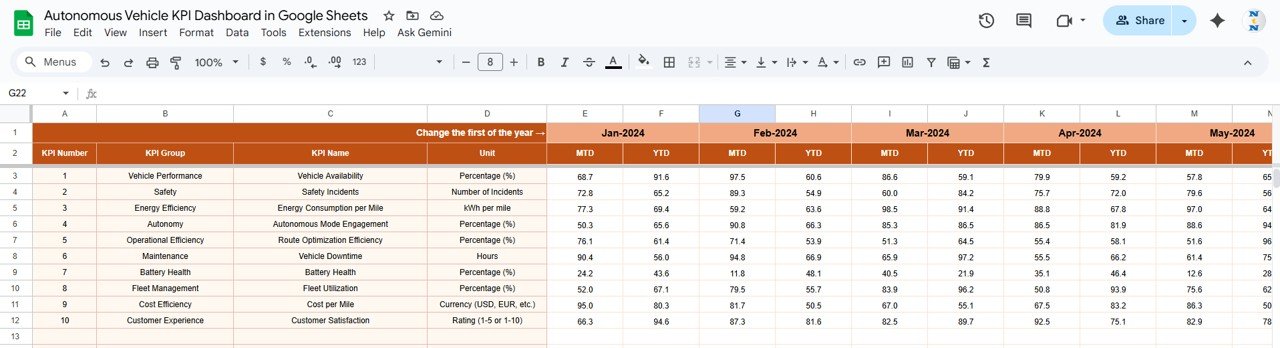
🎯 Target Sheet Tab
Set your monthly and yearly targets here. The dashboard automatically compares actual performance against targets and displays the gap using color-coded formatting.
This feature enables goal alignment and variance tracking across all KPIs.
📆 Previous Year Number Sheet Tab
Benchmark your results with last year’s data. Compare MTD and YTD performance side by side to analyze yearly progress or regression.
Perfect for understanding the impact of R&D upgrades, model iterations, and software improvements.
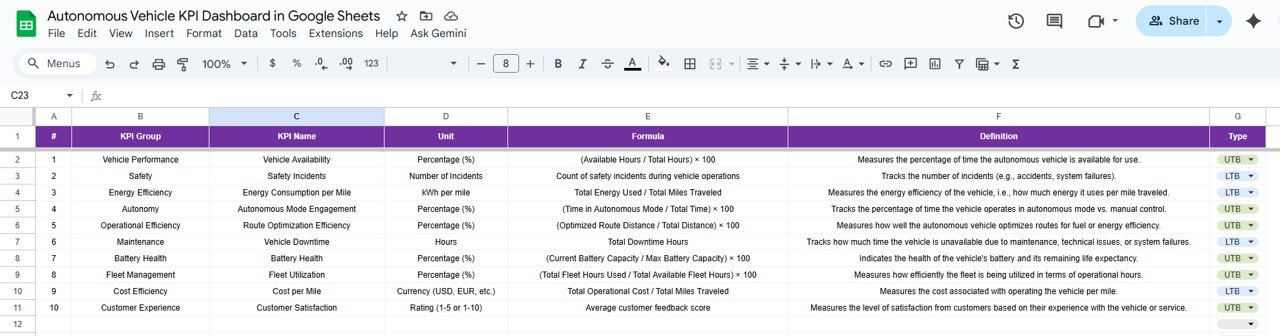
📘 KPI Definition Sheet Tab
This sheet serves as your reference index for all KPIs, defining:
-
KPI Group
-
Unit
-
Formula
-
Type (UTB/LTB)
-
Definition
It ensures consistency across data entry, analysis, and reporting.
⚙️ Advantages of the Dashboard
✅ Real-Time Data Visibility: Track all critical KPIs instantly.
✅ Comprehensive Analysis: Compare MTD, YTD, Target, and Previous Year data.
✅ Automation Ready: Uses dynamic Google Sheets formulas for live updates.
✅ Team Collaboration: Multiple engineers and analysts can work simultaneously.
✅ Accurate Benchmarking: Built-in year-over-year trend comparisons.
🔧 Opportunities for Enhancement
-
🔗 Integrate with Google Data Studio: Extend visuals for leadership dashboards.
-
⚙️ Automate Data Import: Fetch telemetry or sensor data via Google Apps Script.
-
📩 Set Alerts: Email notifications for KPIs below target or critical safety flags.
-
🧠 Add Predictive Analytics: Include ML-based projections for failure or performance patterns.
🧠 Best Practices
✅ Input data monthly and verify accuracy before refreshing visuals.
✅ Maintain consistent KPI naming across sheets.
✅ Review “Lower the Better” KPIs weekly for optimization opportunities.
✅ Lock formula and formatting cells to prevent accidental edits.
✅ Conduct quarterly trend analysis for continuous improvement.
🌟 Why Choose the Autonomous Vehicle KPI Dashboard
-
🚀 Tracks critical AI and vehicle KPIs in real-time
-
🧾 Simplifies performance benchmarking and variance analysis
-
🔧 Fully editable and expandable for additional metrics
-
☁️ Cloud-based and collaborative
-
💡 Ideal for R&D, engineering, and fleet management teams
The Autonomous Vehicle KPI Dashboard in Google Sheets empowers you to turn data into insight and innovation. Monitor performance, detect trends, and drive smarter engineering decisions — all within an intuitive, automated dashboard. ⚡
🔗 Click here to read the Detailed blog post
Watch the step-by-step video Demo:


Reviews
There are no reviews yet.