Modern automotive parts manufacturing demands speed, precision, and data-driven decision-making. Production environments generate massive operational data daily — but without proper analytics, identifying performance gaps becomes difficult.
What if you could monitor production KPIs, analyze trends instantly, and evaluate manufacturing performance using interactive visuals?
Introducing the Automotive Parts Manufacturing KPI Dashboard in Power BI — a powerful, ready-to-use business intelligence solution designed specifically for automotive manufacturers who want real-time operational visibility without complex development.
This dashboard transforms Excel-based manufacturing data into dynamic Power BI visuals, enabling managers to track performance, compare targets, and identify operational issues instantly.
Instead of relying on static spreadsheets and manual reporting, organizations gain a centralized analytics platform that updates automatically and delivers clear performance insights.
Whether you manage production efficiency, quality control, delivery timelines, or operational costs, this dashboard helps you make faster and smarter decisions using modern analytics.
🚀 Key Feature of Automotive Parts Manufacturing KPI Dashboard in Power BI
✅ Interactive KPI dashboard with dynamic slicers
✅ Real-time KPI monitoring using Power BI visuals
✅ MTD and YTD performance tracking
✅ Target vs Actual comparison indicators
✅ Current Year vs Previous Year analysis
✅ Automated data refresh from Excel source
✅ KPI status icons for instant performance evaluation
✅ Trend analysis with combo charts
✅ Drill-through KPI definition page
✅ Centralized performance monitoring system
These features provide manufacturing leaders with instant operational clarity and performance transparency.
📦 What’s Inside the Automotive Parts Manufacturing KPI Dashboard in Power BI
This ready-to-use Power BI solution includes three professionally structured dashboard pages:
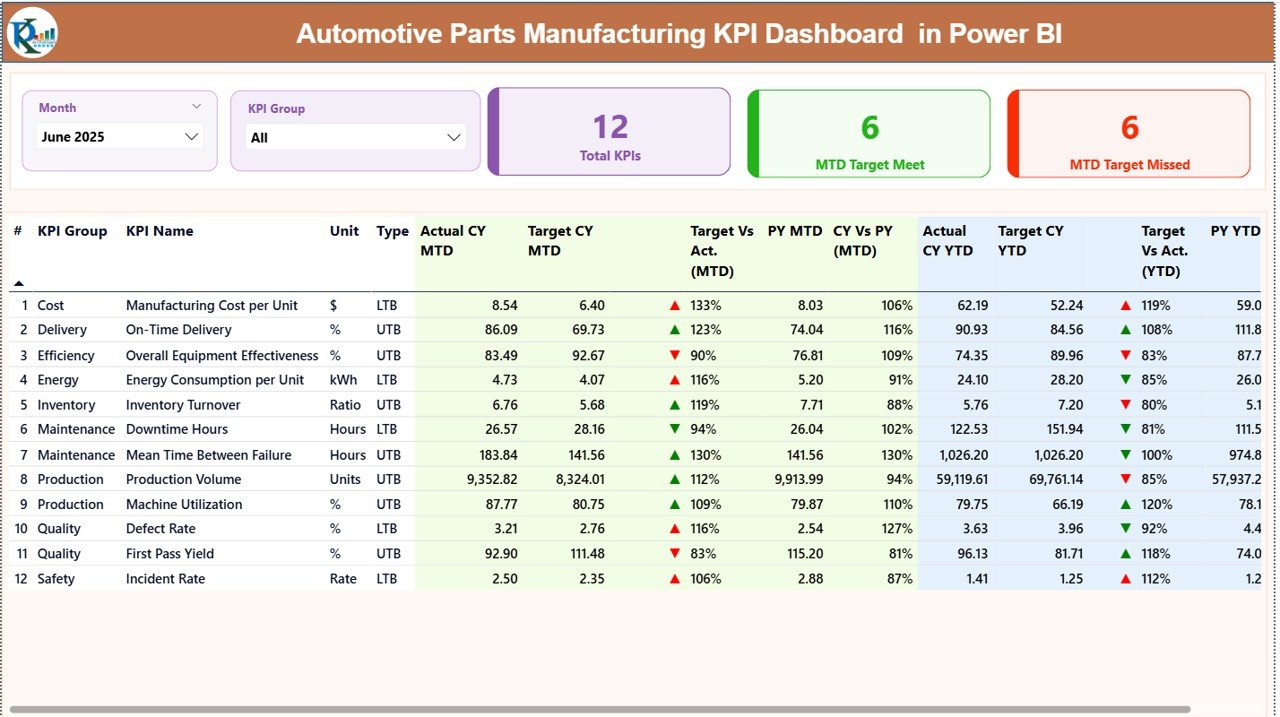
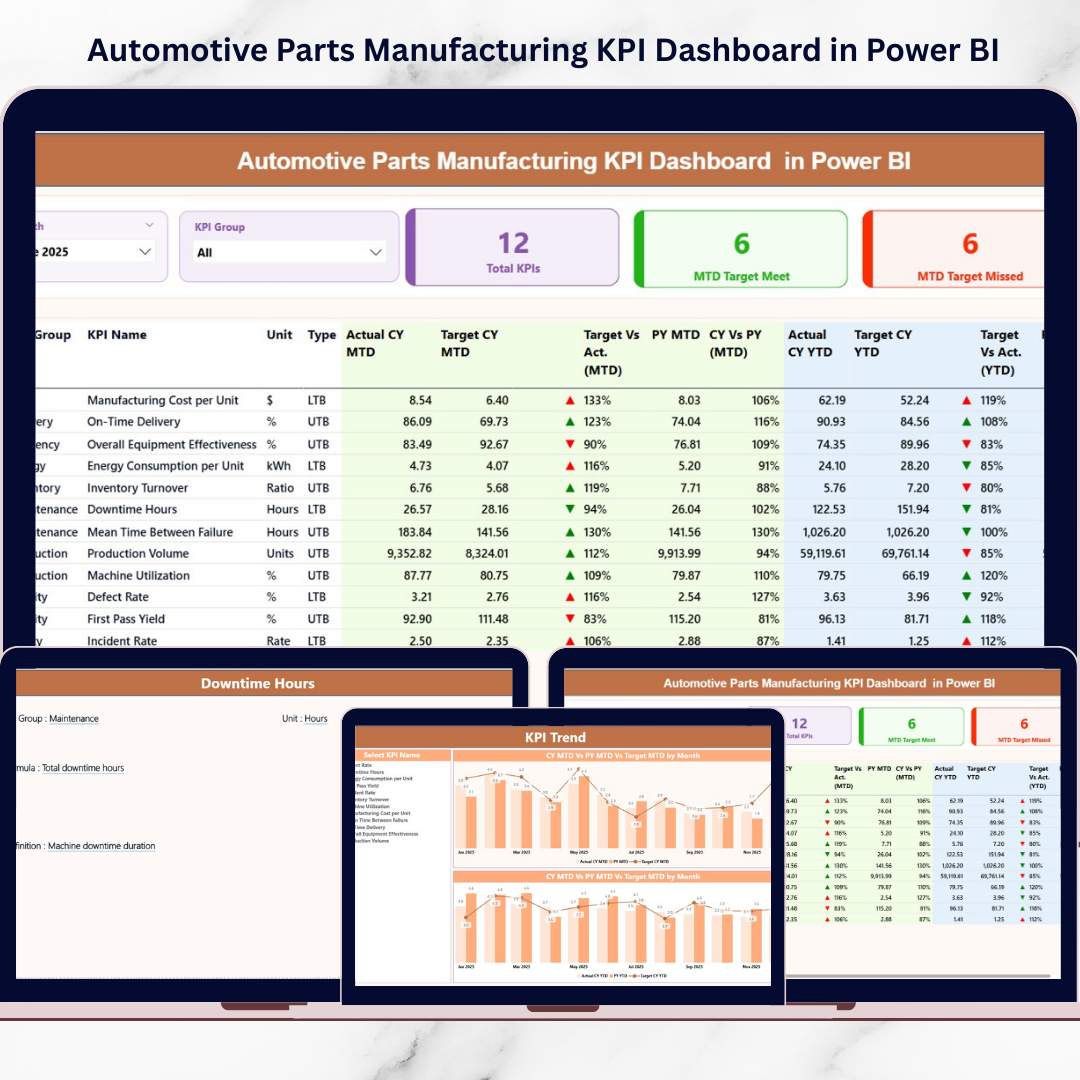
1️⃣ Summary Page — Performance Command Center
View KPI performance at a glance using interactive slicers for Month and KPI Group. KPI cards highlight total KPIs, targets achieved, and missed targets, while a detailed performance table displays MTD and YTD comparisons.
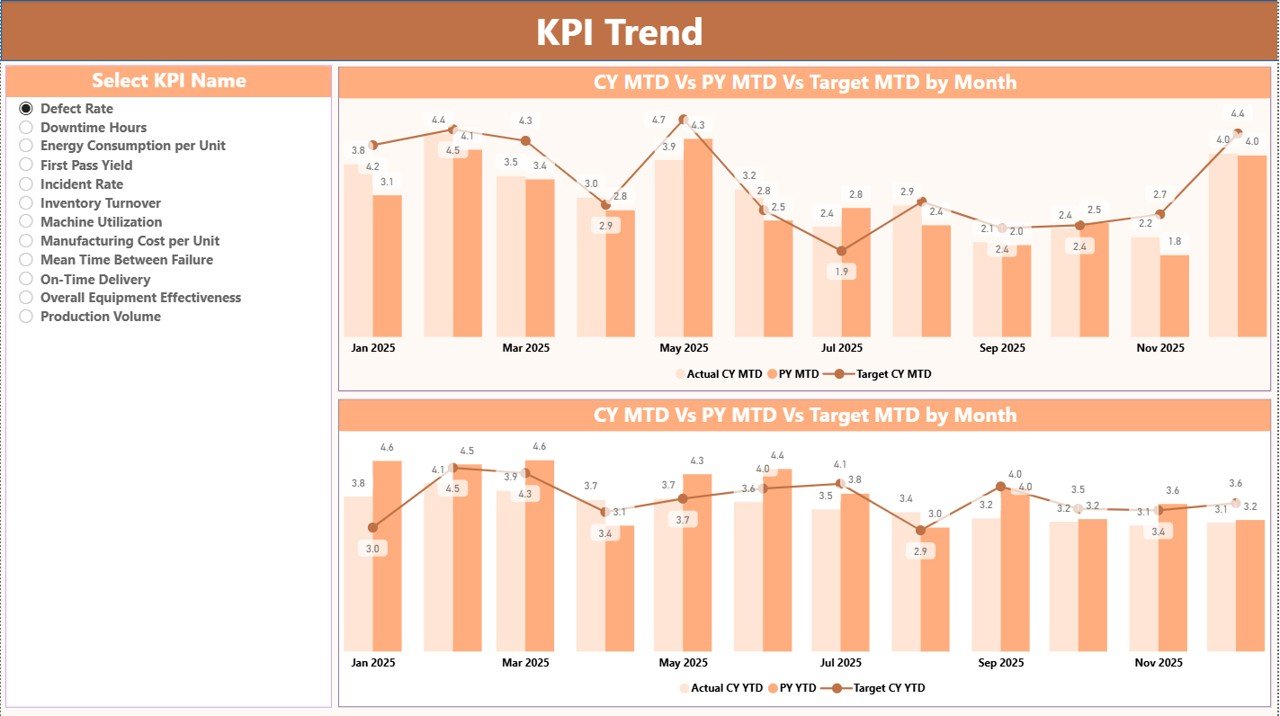
2️⃣ KPI Trend Page — Visual Performance Analysis
Analyze KPI trends dynamically using combo charts comparing Actual, Target, and Previous Year values. Managers can select any KPI and instantly view performance patterns.
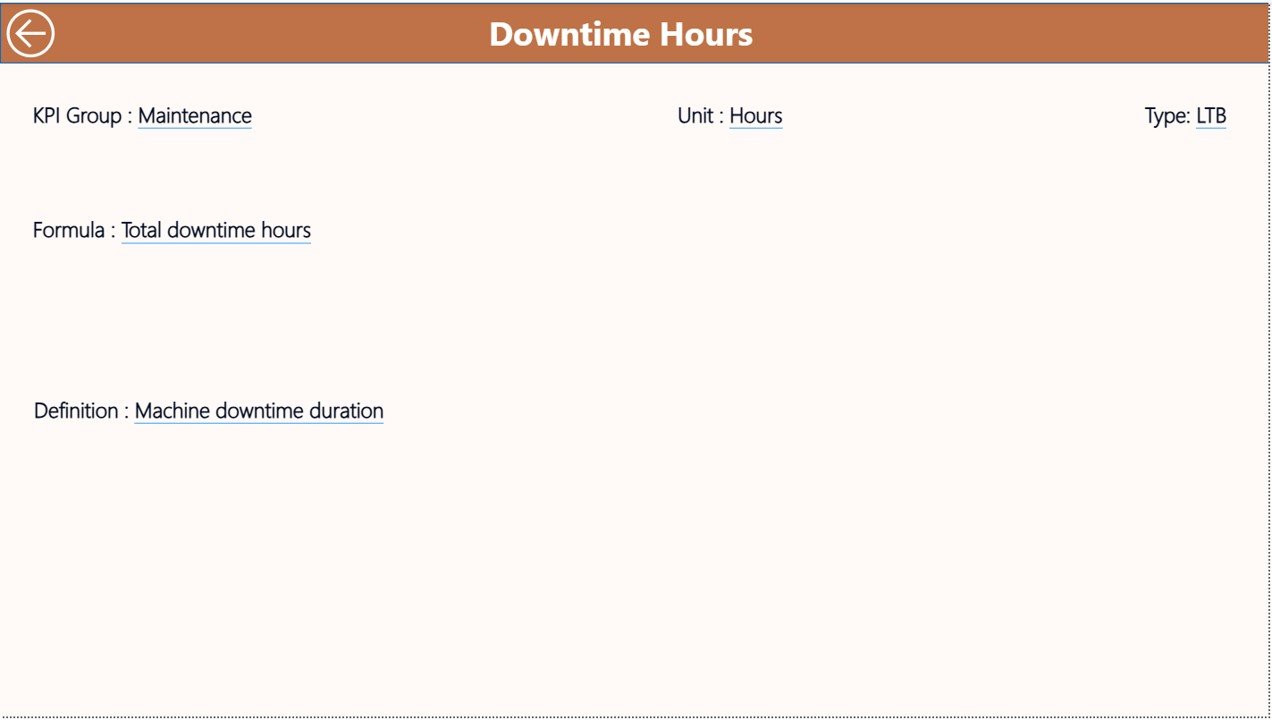
3️⃣ KPI Definition Page — KPI Drill-Through Insights
Understand KPI formulas, classifications, and definitions through a dedicated drill-through page with easy navigation.
Additionally, the dashboard connects with a structured Excel data source containing Actual Inputs, Target Values, and KPI Definitions — ensuring flexible and scalable implementation.
⚙️ How to Use the Automotive Parts Manufacturing KPI Dashboard in Power BI
Using the dashboard is simple and requires no advanced Power BI expertise.
1️⃣ Enter KPI definitions in the Excel master file.
2️⃣ Add monthly actual performance values.
3️⃣ Input KPI targets for comparison.
4️⃣ Connect or refresh Power BI data.
5️⃣ Use slicers to filter performance views.
6️⃣ Analyze KPI insights instantly through visuals.
Once data refreshes, all charts and metrics update automatically — eliminating manual reporting effort.
👨🏭 Who Can Benefit from This Automotive Parts Manufacturing KPI Dashboard in Power BI
This dashboard supports multiple roles across manufacturing organizations:
✅ Production Managers tracking operational efficiency
✅ Plant Heads monitoring overall performance
✅ Quality Managers analyzing defect trends
✅ Operations Analysts evaluating KPI performance
✅ Supply Chain Managers reviewing delivery metrics
✅ Senior Leadership making strategic decisions
From small manufacturing units to enterprise production facilities, this dashboard enables structured and transparent performance monitoring.
By combining Excel’s flexibility with Power BI’s visualization power, this solution delivers advanced analytics without expensive ERP implementations.
Organizations gain:
✔ Real-time performance visibility
✔ Faster decision-making
✔ Improved operational accountability
✔ Better forecasting accuracy
✔ Reduced reporting workload
Ultimately, manufacturers shift from reactive reporting to proactive performance management — improving productivity, quality outcomes, and operational efficiency.
📖 Click here to read the Detailed blog post
▶ Visit our YouTube channel to learn step-by-step video tutorials
👉 https://youtube.com/@PKAnExcelExpert


