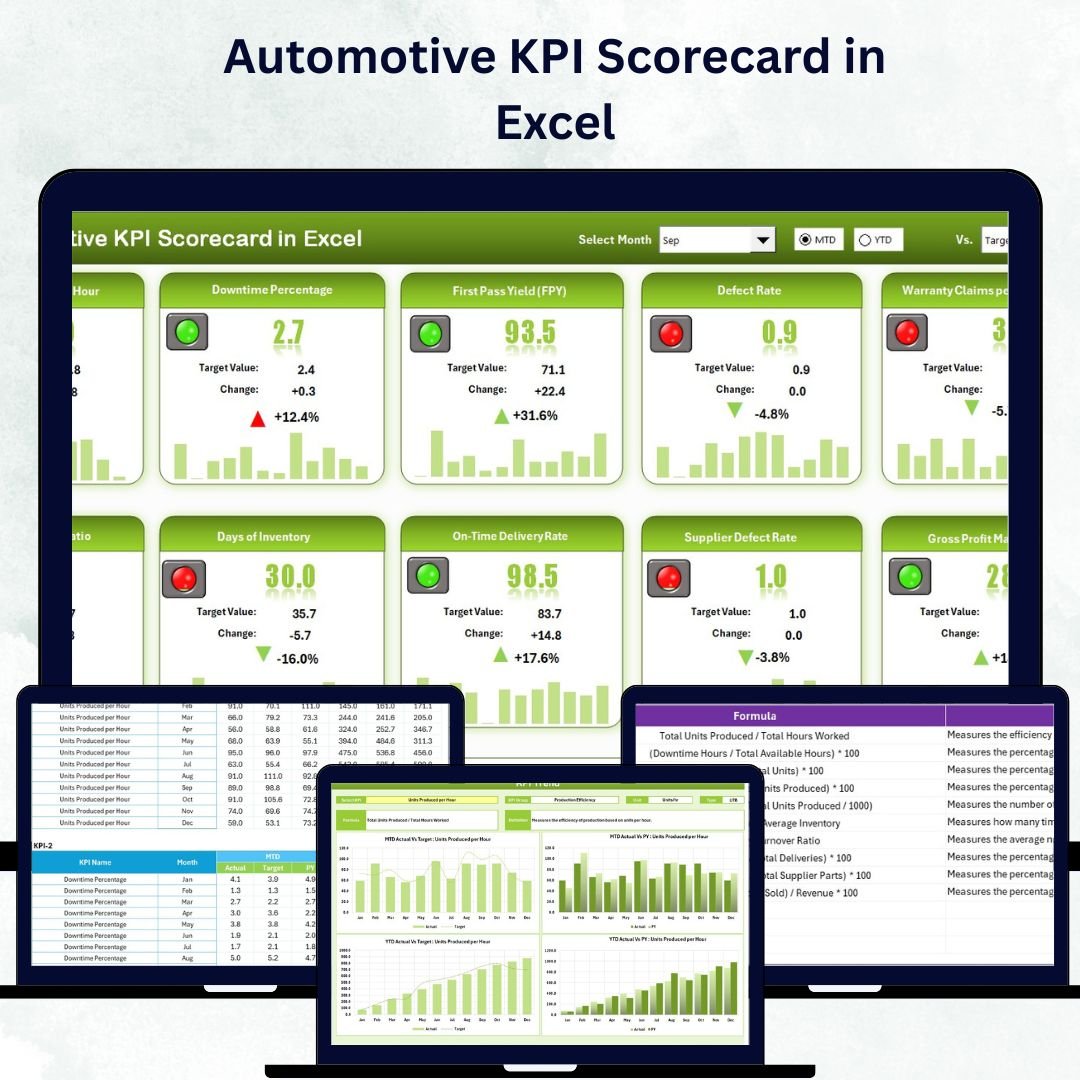
In today’s competitive automotive industry, success relies on real-time insights and data-driven actions. Whether you manage a manufacturing plant, dealership, or service center, the Automotive KPI Scorecard in Excel empowers you to track, measure, and visualize key business metrics — all in one sleek, interactive template.
With pre-built dashboards, dropdown filters, and automated charts, this Excel tool eliminates the hassle of manual reporting and gives you a 360° view of your company’s performance.Automotive KPI Scorecard in Excel
Key Features of the Automotive KPI Scorecard in Excel
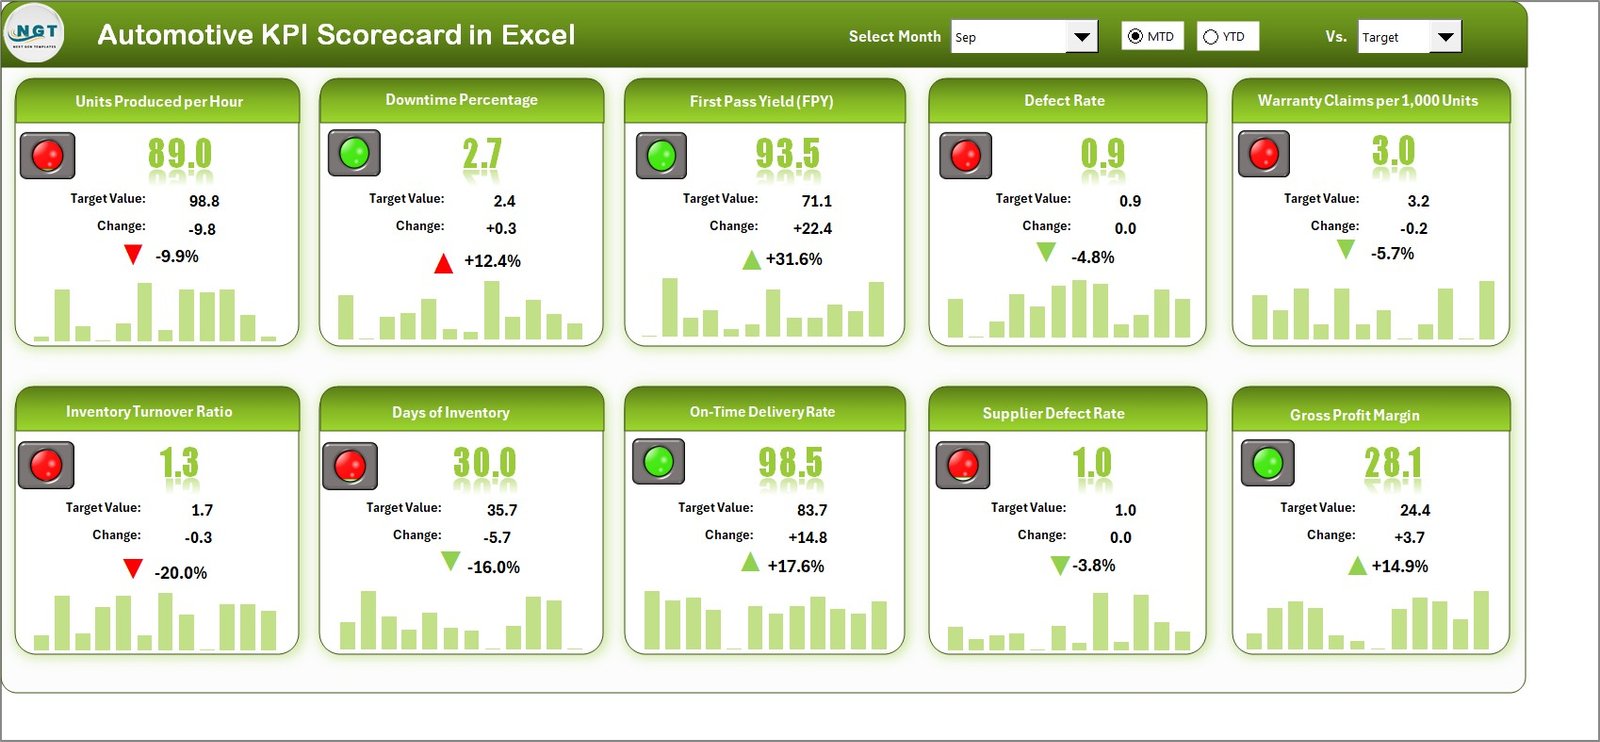
✅ Interactive Dashboard View: Analyze Month-to-Date (MTD) and Year-to-Date (YTD) results instantly with smart dropdown filters.
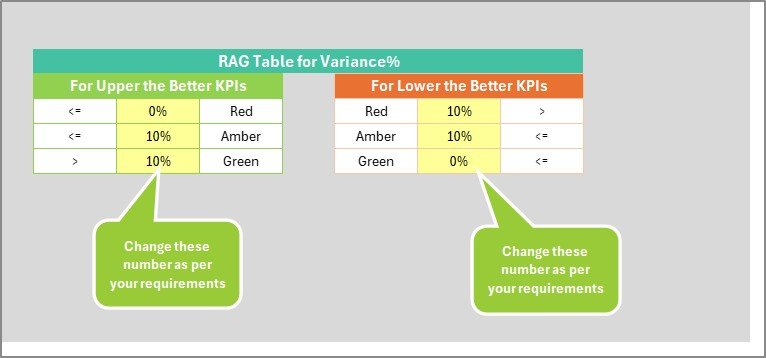
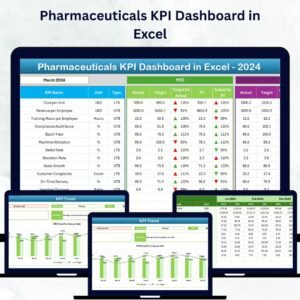
📊 Actual vs Target Comparison: See where you stand against your goals with dynamic visuals and conditional color indicators.
🟢 Color-Coded Performance: Instantly identify strong and weak areas through green, yellow, and red indicators.
📈 Trend Analysis: Review historical data to uncover long-term performance patterns.
🧭 Easy Navigation: Move between sheets effortlessly using clickable buttons or hyperlinks.
💾 Auto-Updating Calculations: Keep your reports accurate with pre-set formulas that update totals and averages.
🧠 No Coding Required: 100% Excel-based and fully editable for all skill levels.
📂 What’s Inside the Automotive KPI Scorecard in Excel
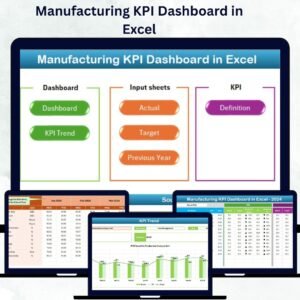
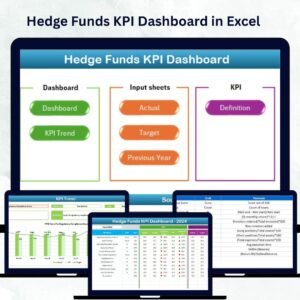
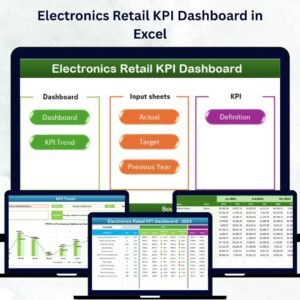
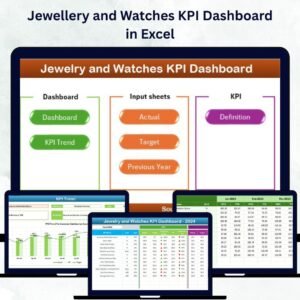
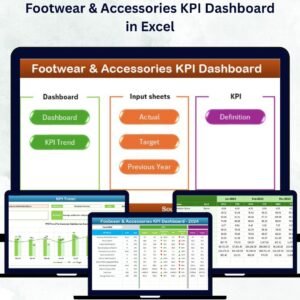
The template includes four powerful worksheets, each designed to simplify your workflow:
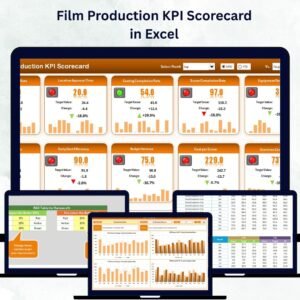
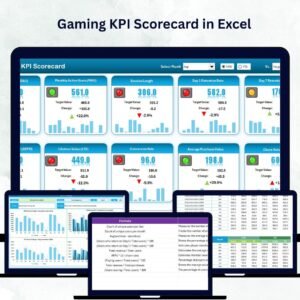
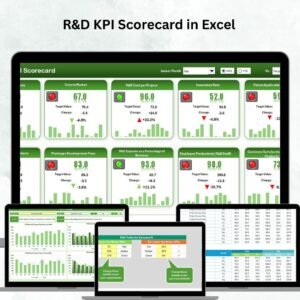
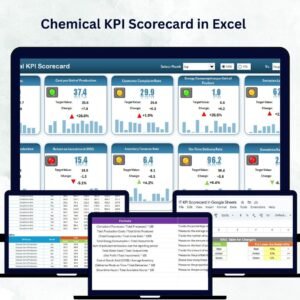
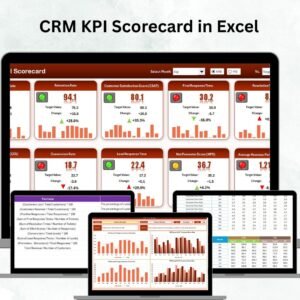
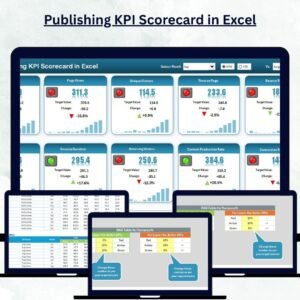
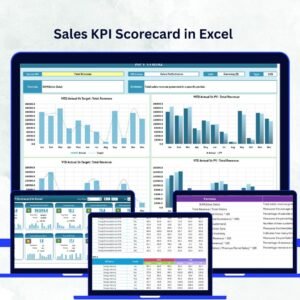
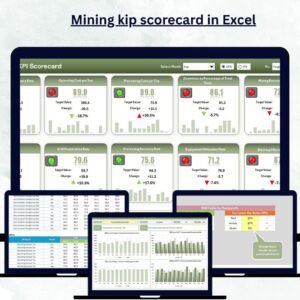
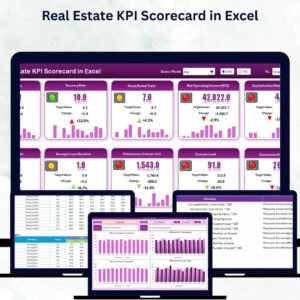
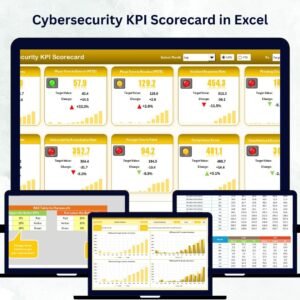
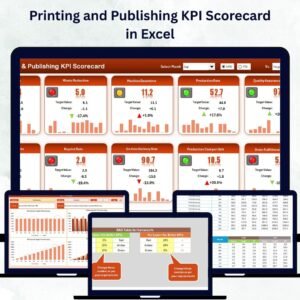
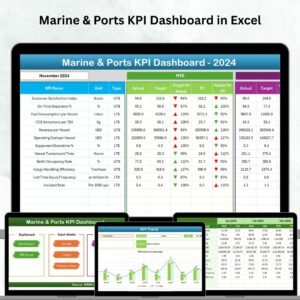
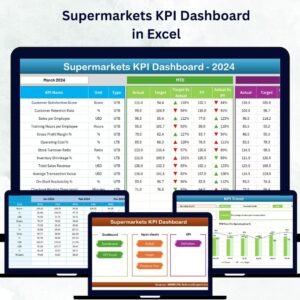
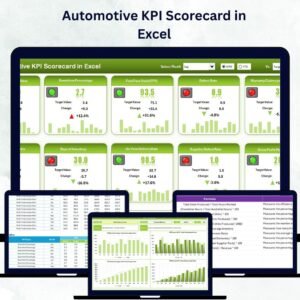
1️⃣ Scorecard Sheet – Your central dashboard displaying up to 10 KPIs with visual comparisons of Actual, Target, and Previous Year (PY) data.
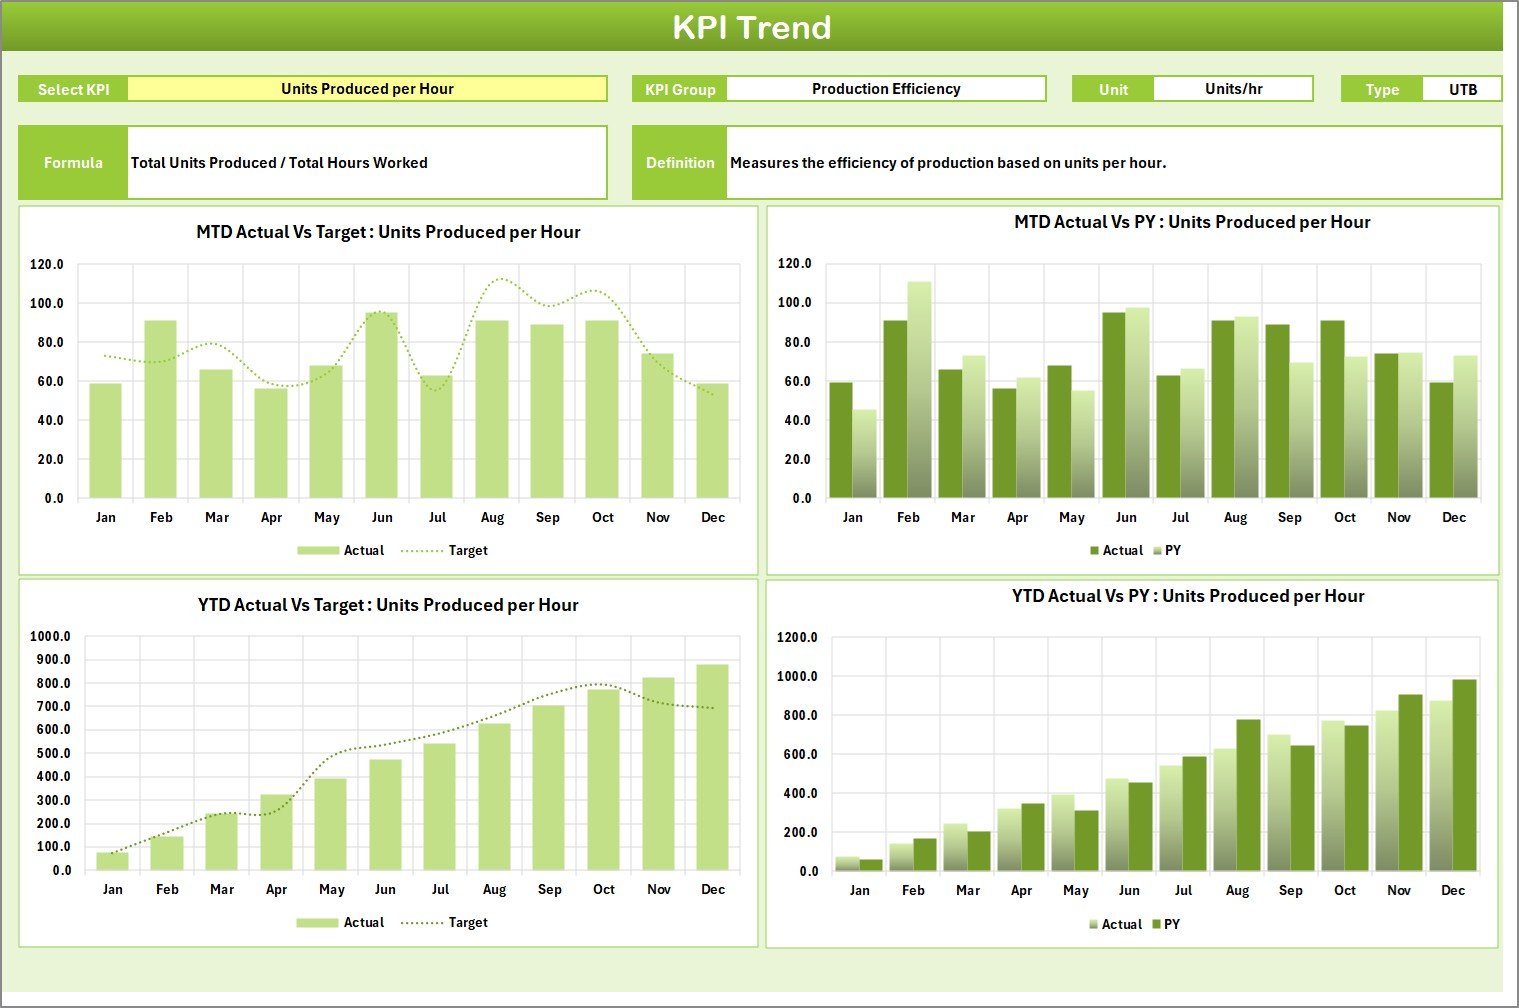
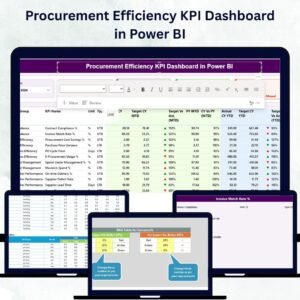
2️⃣ KPI Trend Sheet – Analyze performance month-over-month. Simply pick any KPI from the dropdown (cell C3) to view interactive charts for MTD and YTD data.
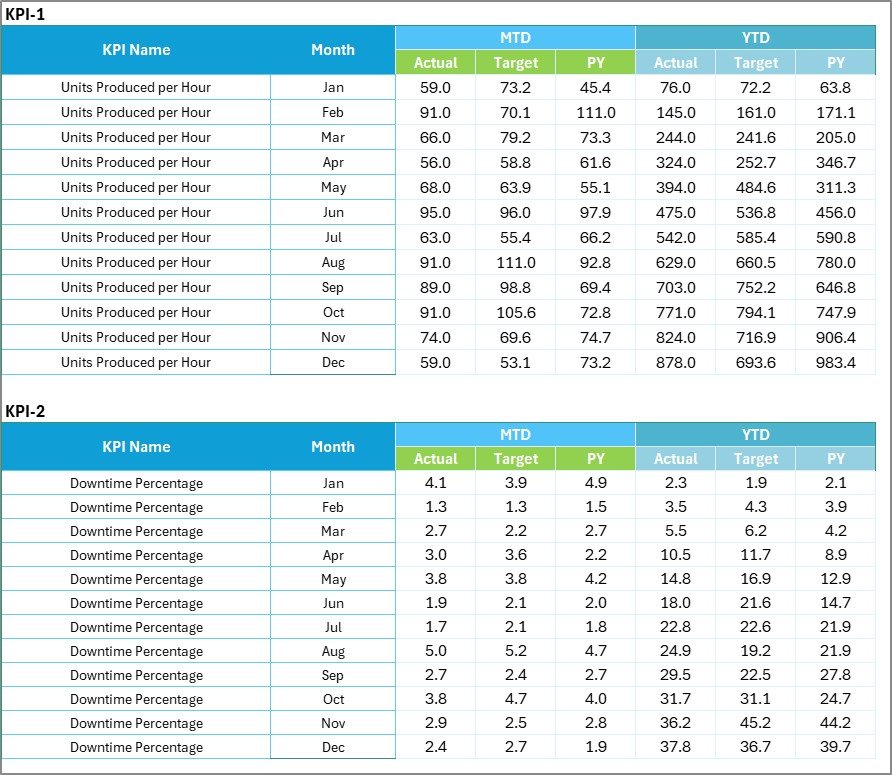
3️⃣ Input Data Sheet – Store and manage all raw data for Actuals, Targets, and PY values. Update it regularly to keep your dashboard current and accurate.
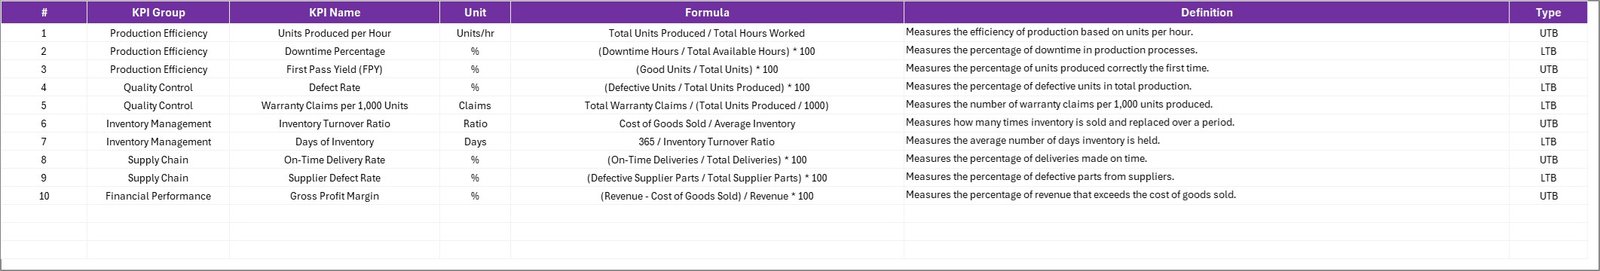
4️⃣ KPI Definition Sheet – Document every KPI with details like formula, unit, group, and performance type (UTB or LTB).
Each sheet is professionally formatted and interlinked to create a seamless performance management experience.
🧩 How to Use the Automotive KPI Scorecard in Excel
🚀 Step 1: Identify key business KPIs such as production efficiency, sales growth, or service turnaround time.
✍️ Step 2: Enter or update monthly Actual, Target, and Previous Year data in the Input Sheet.
📊 Step 3: Open the Scorecard Sheet and select your preferred month or performance mode (MTD or YTD).
🔍 Step 4: Analyze charts and variance indicators to assess performance gaps.
📅 Step 5: Use the Trend Sheet to track improvement or decline across multiple months.
💬 Step 6: Present the dashboard during review meetings or management discussions.Automotive KPI Scorecard in Excel
This process ensures you gain clear, visual insights without any coding or complex setup.
👥 Who Can Benefit from This Automotive KPI Scorecard in Excel
🏭 Manufacturing Plants: Track production efficiency, quality defects, and equipment utilization.
🚘 Dealership Networks: Monitor monthly sales growth, conversion rates, and profitability by model.
🧰 Service Centers: Measure service turnaround time, customer satisfaction, and repeat visit percentages.
🚚 Supply Chain Teams: Manage logistics efficiency, delivery times, and vendor reliability.
💼 Finance & Administration: Compare cost per vehicle, gross margins, and ROI trends.
📈 Business Analysts & Managers: Visualize performance, share insights, and make informed decisions.
This all-in-one template is a cost-effective, time-saving, and scalable solution for small to medium automotive businesses seeking professional-grade analytics in Excel.
🏁 Why Choose This Template?
✔ Ready-to-Use & Editable – No complex setup needed.
✔ Visually Appealing Dashboards – Designed for clarity and impact.
✔ Data-Driven Insights – Drive smarter decisions instantly.
✔ Affordable & Efficient – Avoid costly BI tools without compromising on analysis.
The Automotive KPI Scorecard in Excel turns your raw numbers into meaningful insights — helping you identify gaps, track growth, and accelerate performance like never before!


Reviews
There are no reviews yet.