In today’s dynamic business environment, organizations must ensure accountability, transparency, and financial integrity at every level. Traditional spreadsheets and manual tracking systems often fail to keep up with the speed and complexity of modern audit operations. That’s where the Audit & Internal Controls Dashboard in Power BI makes all the difference.
This ready-to-use, fully interactive dashboard transforms complex audit data into clear, actionable insights — empowering auditors, compliance teams, and financial leaders to monitor performance, mitigate risks, and ensure compliance in real time. ⚙️📊
Whether you’re overseeing financial audits, operational assessments, or compliance checks, this Power BI dashboard simplifies every stage of the process with visual storytelling, automation, and complete transparency.
🌟 Key Features of the Audit & Internal Controls Dashboard in Power BI
🏠 1️⃣ Overview Page – The Audit Control Center
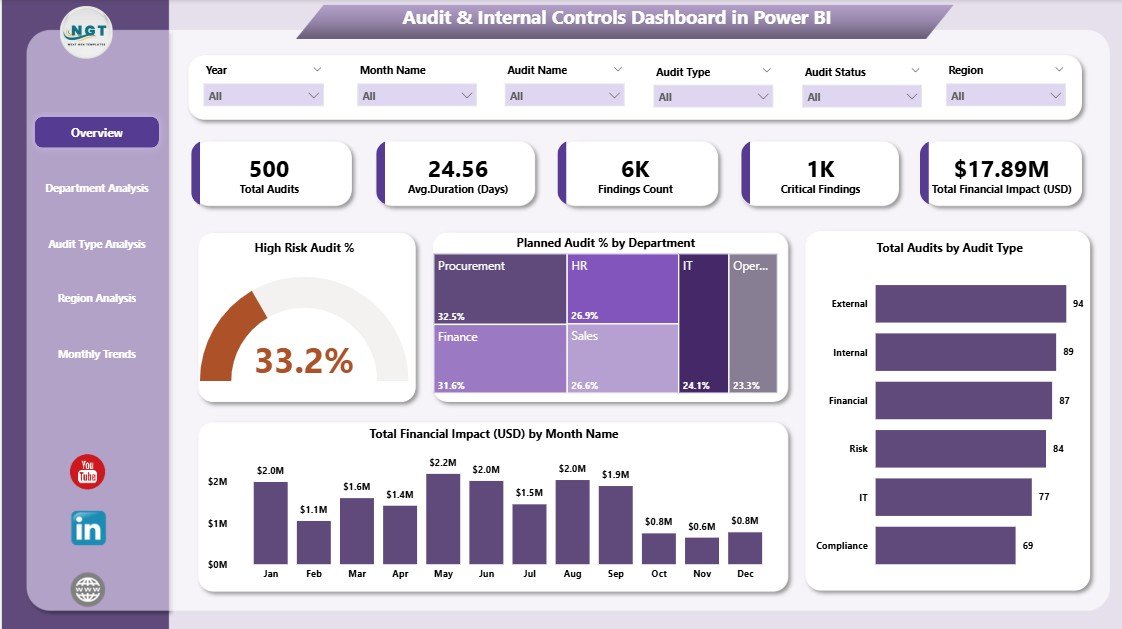
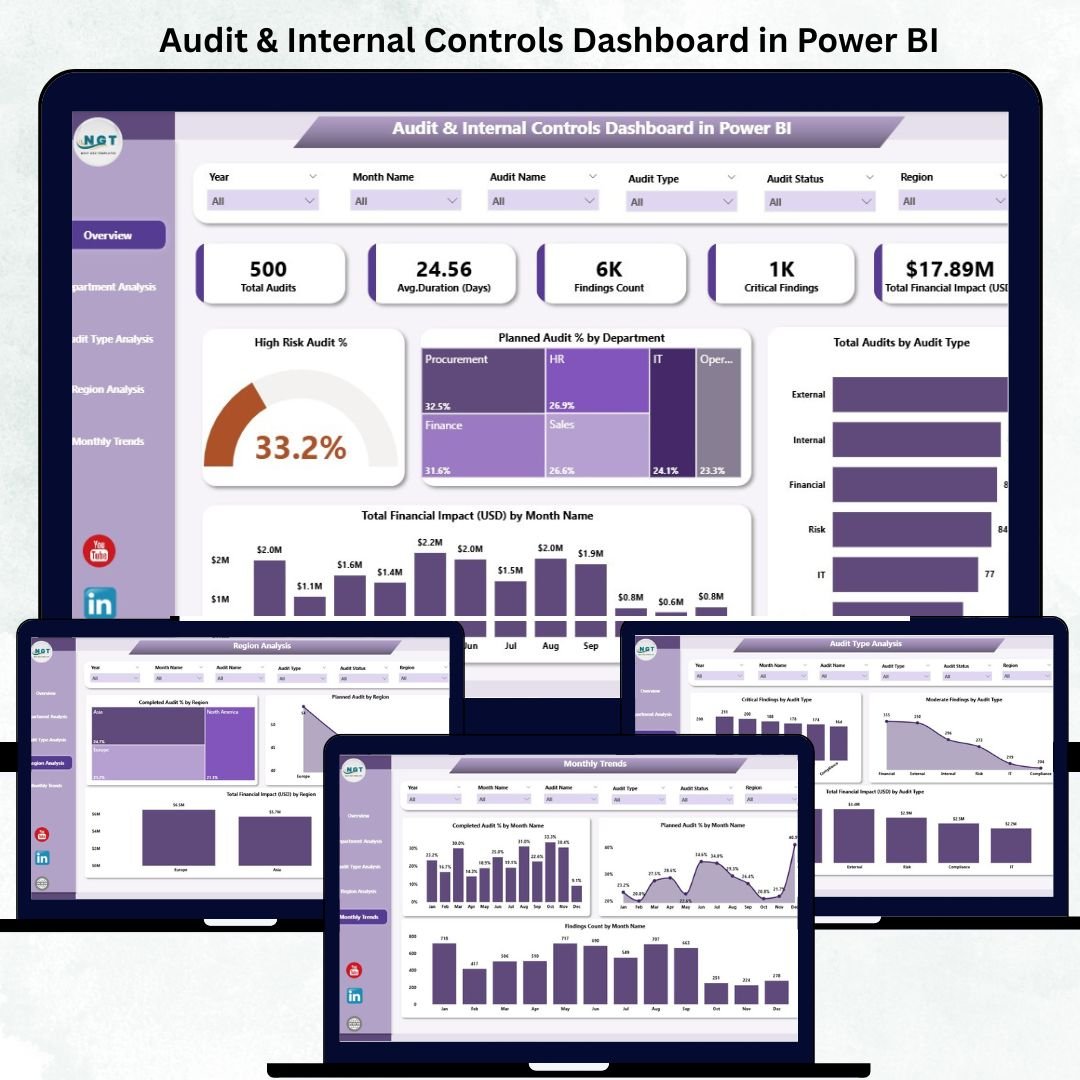
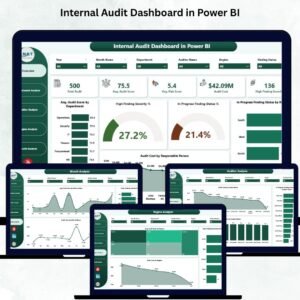
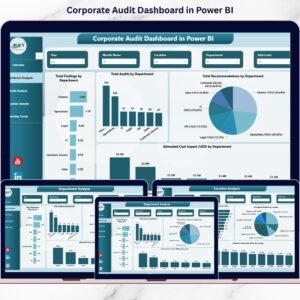
The Overview Page gives a bird’s-eye view of audit operations with real-time visuals and KPI cards.
Includes:
-
5 KPI Cards displaying Total Audits, Completed Audits, Pending Audits, High-Risk Audit %, and Total Financial Impact (USD).
-
4 Interactive Charts:
-
High-Risk Audit %
-
Planned Audit % by Department
-
Total Audits by Audit Type
-
Total Financial Impact (USD) by Month
-
-
Slicers for filtering by department, region, audit type, or month.
💡 Purpose: Instantly view audit health and identify areas needing immediate action.
🏢 2️⃣ Department Analysis Page – Audit by Department
This page dives deeper into departmental performance.
Visuals Include:
-
High-Risk Audit % by Department
-
Finding Count by Department
-
Total Financial Impact (USD) by Department
📈 Use Case: Identify departments with recurring issues or high financial exposure to allocate audit resources effectively.
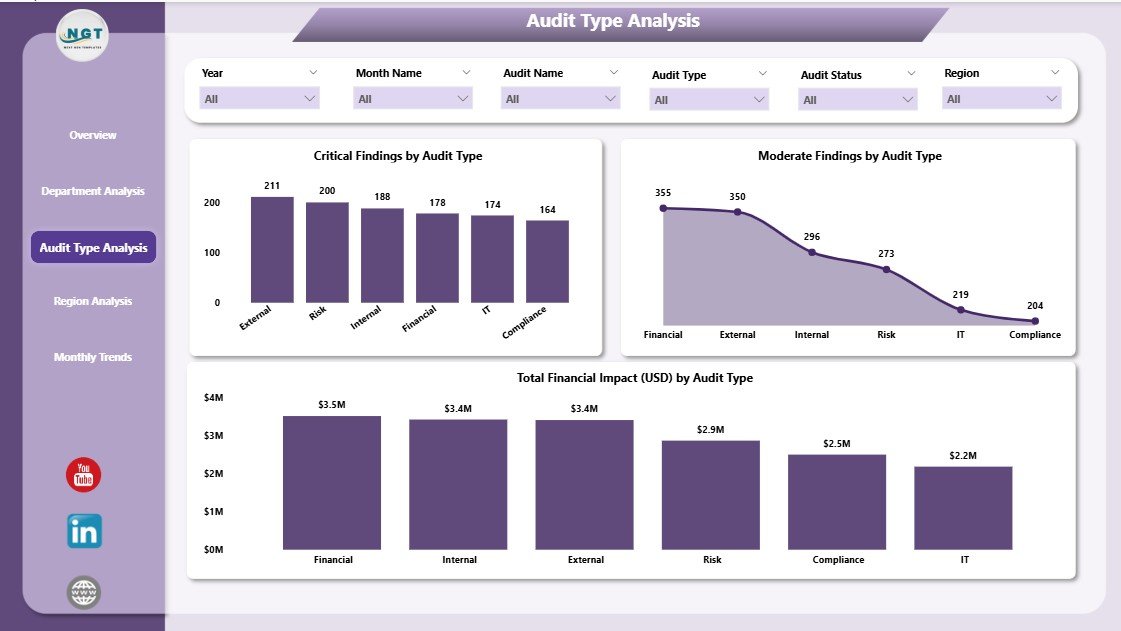
📂 3️⃣ Audit Type Analysis Page – Categorize and Compare Audits
Compare outcomes across operational, financial, IT, and compliance audits.
Visuals Displayed:
-
Critical Findings by Audit Type
-
Moderate Findings by Audit Type
-
Total Finding Impact (USD) by Audit Type
📊 Purpose: Pinpoint audit types that produce critical findings and optimize audit frequency and scope.
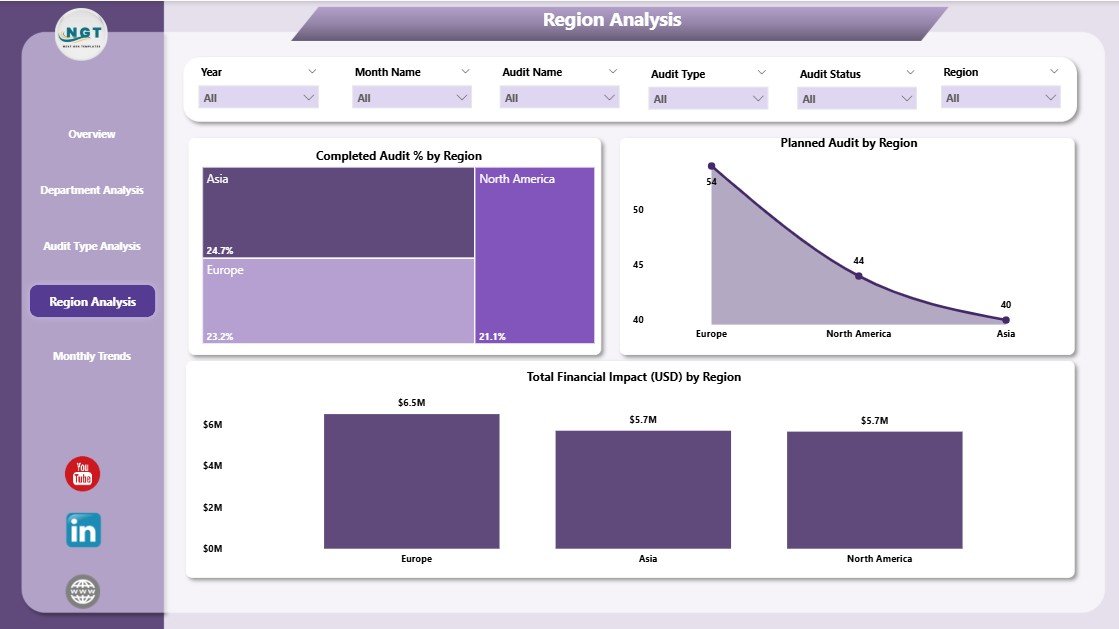
🌍 4️⃣ Region Analysis Page – Geographic Audit Insights
Gain a regional perspective on compliance and risk.
Charts Included:
-
Completed Audit % by Region
-
Planned Audit % by Region
-
Total Financial Impact (USD) by Region
📍 Benefit: Compare regional performance, track completion rates, and identify high-risk locations to strengthen internal control systems.
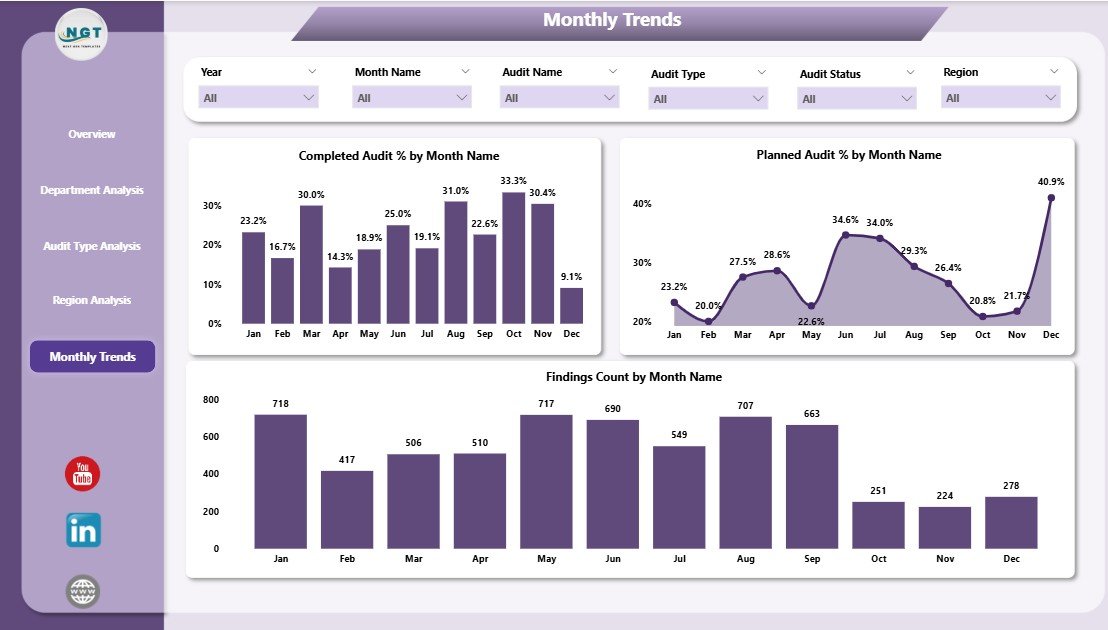
📅 5️⃣ Monthly Trends Page – Analyze Year-Round Audit Patterns
Understand how audit performance evolves over time.
Charts Displayed:
-
Completed Audit % by Month
-
Planned Audit % by Month
-
Finding Count by Month
📆 Purpose: Track monthly progress, identify peak periods, and plan manpower allocation efficiently.
⚙️ Why Choose Power BI for Audit & Internal Controls
Power BI offers unmatched automation, real-time reporting, and drill-down capabilities — making it the ideal platform for internal control management.
✅ Real-Time Monitoring – Automatically refreshes data for up-to-date insights.
✅ Interactive Visuals – Drill down by department, region, or audit type.
✅ Data Centralization – Combines all audit data in one secure workspace.
✅ Error Reduction – Automation minimizes manual data mistakes.
✅ User-Friendly Design – Built for both auditors and executives.
This dashboard helps you move from static reporting to proactive governance and risk management.
📈 Advantages of the Audit & Internal Controls Dashboard
1️⃣ Enhanced Transparency: Centralized audit data ensures clarity across departments.
2️⃣ Improved Risk Management: Identify and mitigate high-risk areas early.
3️⃣ Faster Decision-Making: Real-time insights replace static monthly reports.
4️⃣ Optimized Resource Allocation: Understand where to focus audit efforts.
5️⃣ Consistent Compliance: Track planned vs. completed audits with precision.
6️⃣ Financial Awareness: Quantify the monetary impact of audit findings.
7️⃣ Customizable Design: Adapt KPIs, visuals, and layout to fit your audit process.
🧠 How This Dashboard Strengthens Internal Controls
-
Tracks audit plans vs. execution for better governance.
-
Identifies gaps in control design and implementation.
-
Measures financial and operational risk exposure.
-
Monitors historical trends to support continuous improvement.
-
Empowers leadership with data-backed decision-making.
With these capabilities, the Audit & Internal Controls Dashboard becomes an essential tool for building a culture of integrity and compliance.
🛠️ Best Practices for Using the Dashboard
✅ Maintain accurate and clean data sources.
✅ Define KPIs clearly to ensure consistent understanding.
✅ Schedule automatic data refreshes.
✅ Use role-based access controls to secure sensitive audit data.
✅ Review monthly and regional trends to catch early warning signs.
✅ Train audit teams to read and interpret visuals effectively.
Following these practices guarantees accurate insights and maximum return on investment from your Power BI implementation.
👥 Who Can Benefit from This Dashboard
-
Internal Auditors – Track findings and risk severity.
-
Compliance Officers – Monitor adherence to internal policies.
-
Finance Teams – Assess financial impact of audits.
-
Executives & Board Members – Gain instant visibility into control health.
-
Consultants – Deliver professional audit performance reports for clients.
🌍 Real-World Applications
🏦 Banks – Manage regulatory and financial audits across branches.
🏭 Manufacturers – Ensure safety, environmental, and process compliance.
🏢 Corporates – Track control gaps and mitigate fraud risks.
🏛️ Government Agencies – Monitor regional and departmental audit status.
🤝 NGOs – Strengthen donor reporting and audit transparency.
### Click here to read the Detailed blog post
Visit our YouTube channel to learn step-by-step video tutorials


Reviews
There are no reviews yet.