Managing AR and VR gaming studios involves tracking many performance metrics such as revenue, user engagement, platform performance, development costs, and profitability. As gaming technologies continue to evolve rapidly, studio managers need powerful analytics tools to monitor performance and make strategic decisions.
The AR/VR Gaming Studios Dashboard in Power BI is a professionally designed analytics solution that helps gaming companies track critical KPIs and analyze studio performance in one centralized dashboard. With interactive visuals and dynamic insights, decision-makers can instantly evaluate revenue trends, player engagement, platform performance, and regional growth.
This ready-to-use Power BI dashboard template transforms complex gaming data into clear visual insights, enabling studios to improve profitability, optimize development strategies, and expand into high-growth markets.
🚀 Key Features of AR/VR Gaming Studios Dashboard in Power BI
📊 Interactive Overview Dashboard
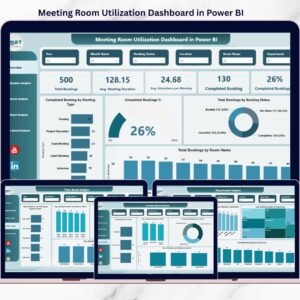
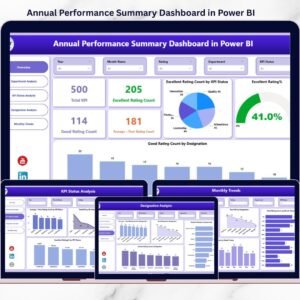
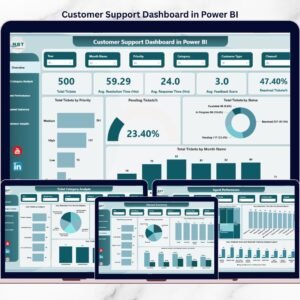
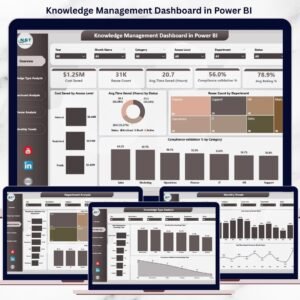
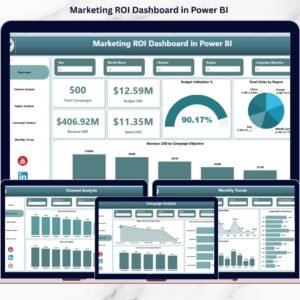
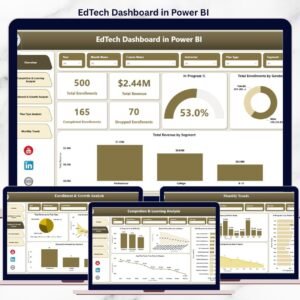
Monitor the overall performance of AR/VR gaming operations through a centralized summary page displaying important KPIs like revenue, cost, profit, and ratings.
💰 Revenue & Profitability Analysis
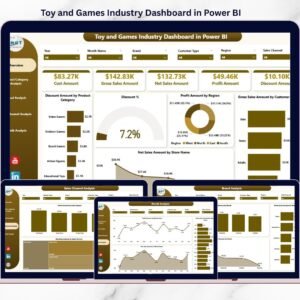
Track revenue trends, profit margins, and cost distribution to understand which games, genres, or platforms generate the highest profitability.
🎮 User Engagement Monitoring
Analyze Daily Active Users (DAU) and Monthly Active Users (MAU) across studios and regions to evaluate player engagement and game popularity.
🧩 Genre Performance Insights
Visualize Profit Margin by Genre to identify which game categories generate the highest returns.
💻 Platform Performance Analysis
Compare performance across platforms like Oculus, PlayStation VR, Steam VR, and mobile VR to determine where your games perform best.
🌎 Regional Market Analysis
Evaluate revenue, profit, and user engagement across geographic regions to identify high-growth gaming markets.
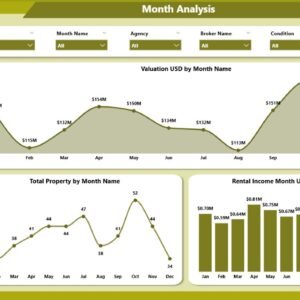
📈 Monthly Trend Monitoring
Track performance trends such as revenue, profit, ratings, and development costs over time to understand seasonal gaming patterns.
🏢 Studio Performance Comparison
Compare different development studios or teams based on revenue, cost, and user activity metrics.
⚡ Interactive Filters and Slicers
Easily explore data using slicers and filters that allow users to drill down into gaming performance insights.
📊 Professional Data Visualizations
Clean and powerful charts make gaming analytics easy to understand for managers, developers, and stakeholders.
📦 What’s Inside the AR/VR Gaming Studios Dashboard
This Power BI template includes five powerful analytical pages designed to monitor different aspects of gaming performance.
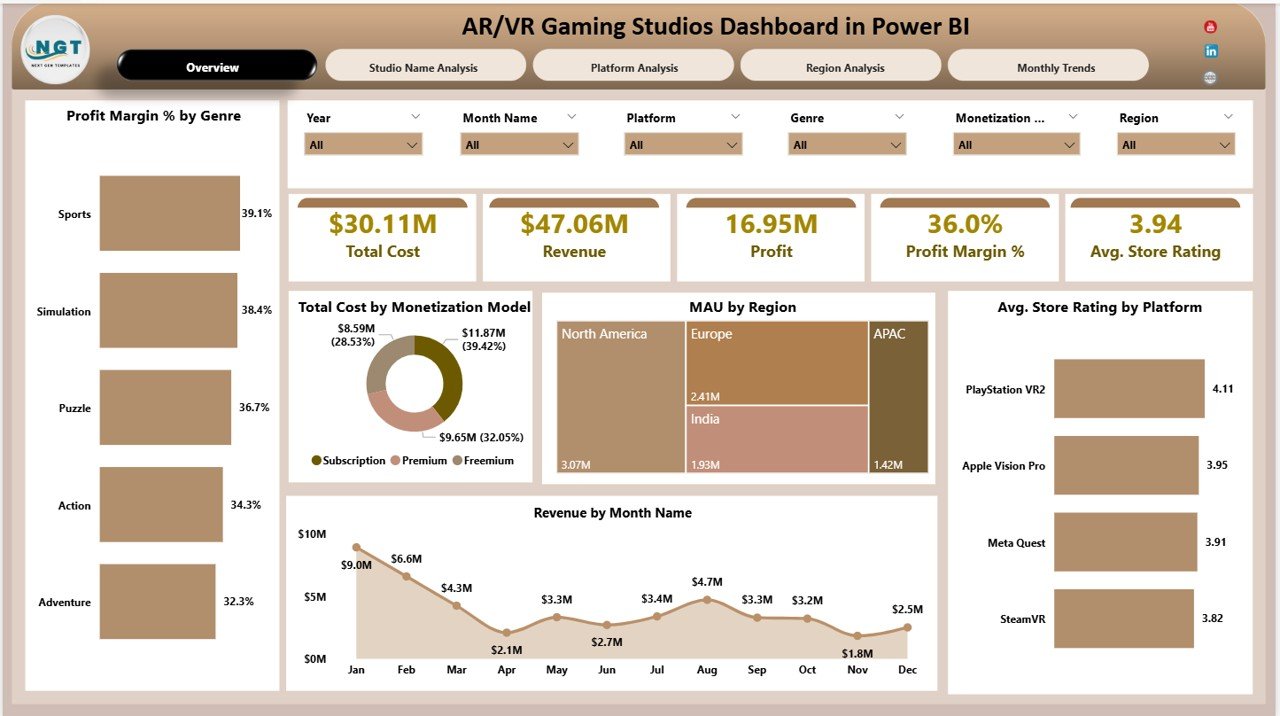
1️⃣ Overview Page
The main dashboard that displays key KPIs including:
-
Total Cost
-
Revenue
-
Profit
-
Profit Margin %
-
Average Store Rating
Visual charts included:
-
Profit Margin % by Genre
-
Total Cost by Monetization Model
-
MAU by Region
-
Average Store Rating by Platform
-
Revenue by Month Name
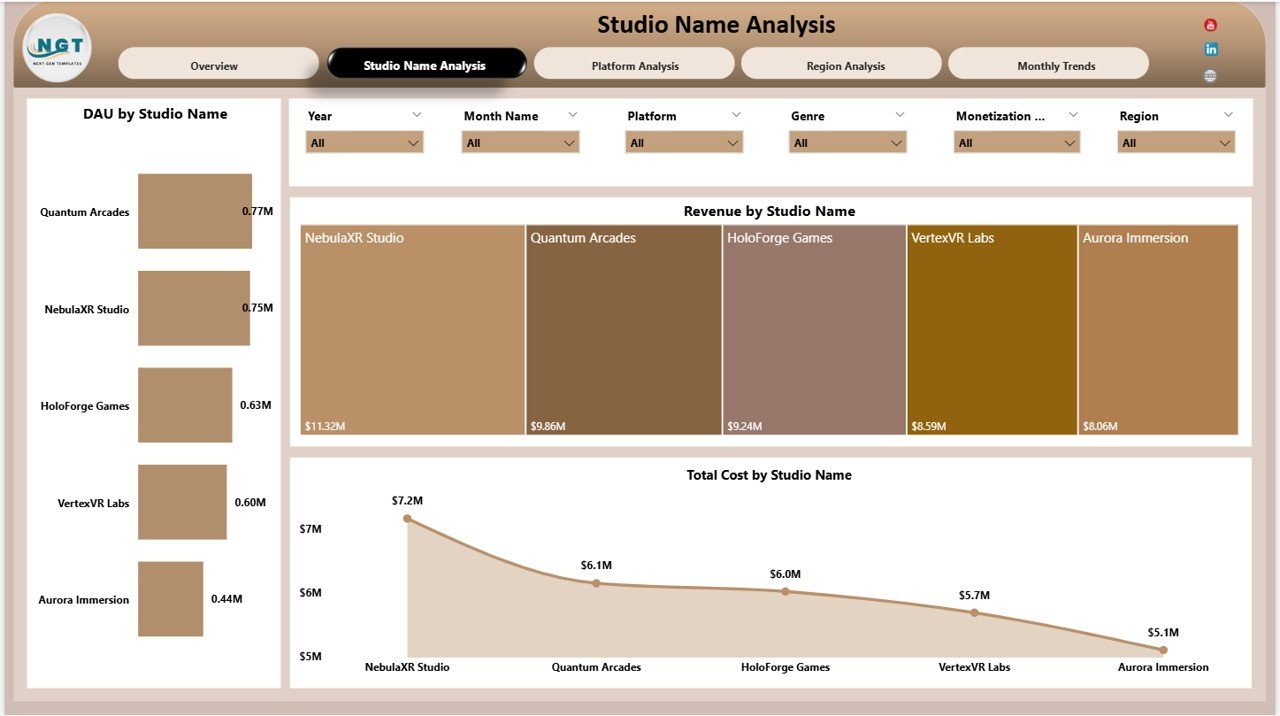
2️⃣ Studio Name Analysis Page
Analyze performance across different gaming studios using:
-
DAU by Studio Name
-
Revenue by Studio Name
-
Total Cost by Studio Name
This helps management identify top-performing development teams.
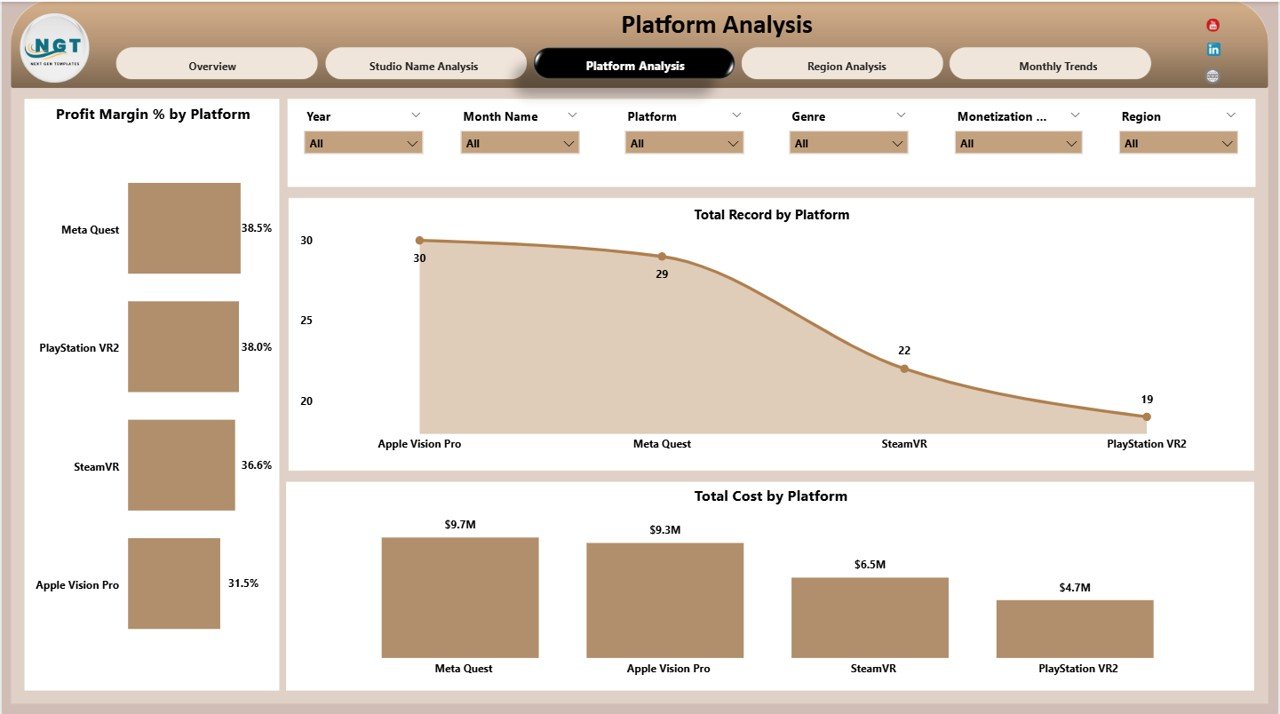
3️⃣ Platform Analysis Page
Understand how games perform across multiple platforms using:
-
Profit Margin % by Platform
-
Total Record by Platform
-
Total Cost by Platform
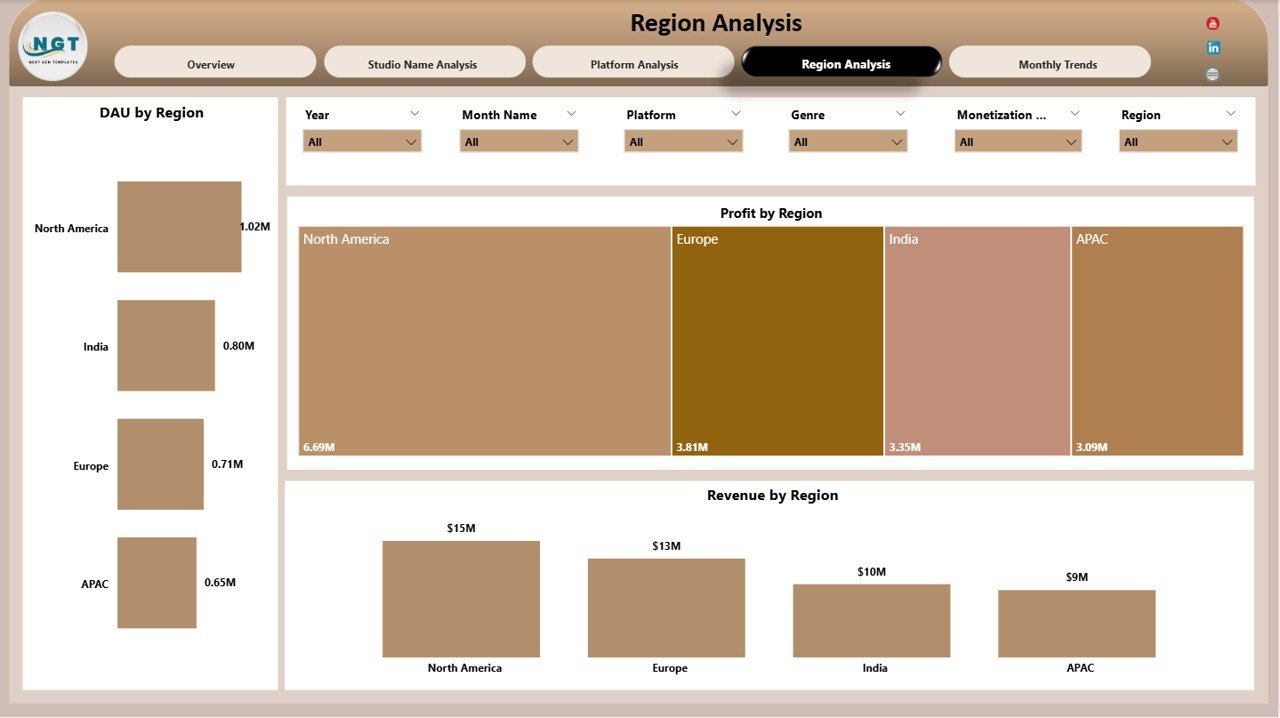
4️⃣ Region Analysis Page
Evaluate gaming performance in different markets with charts such as:
-
DAU by Region
-
Profit by Region
-
Revenue by Region
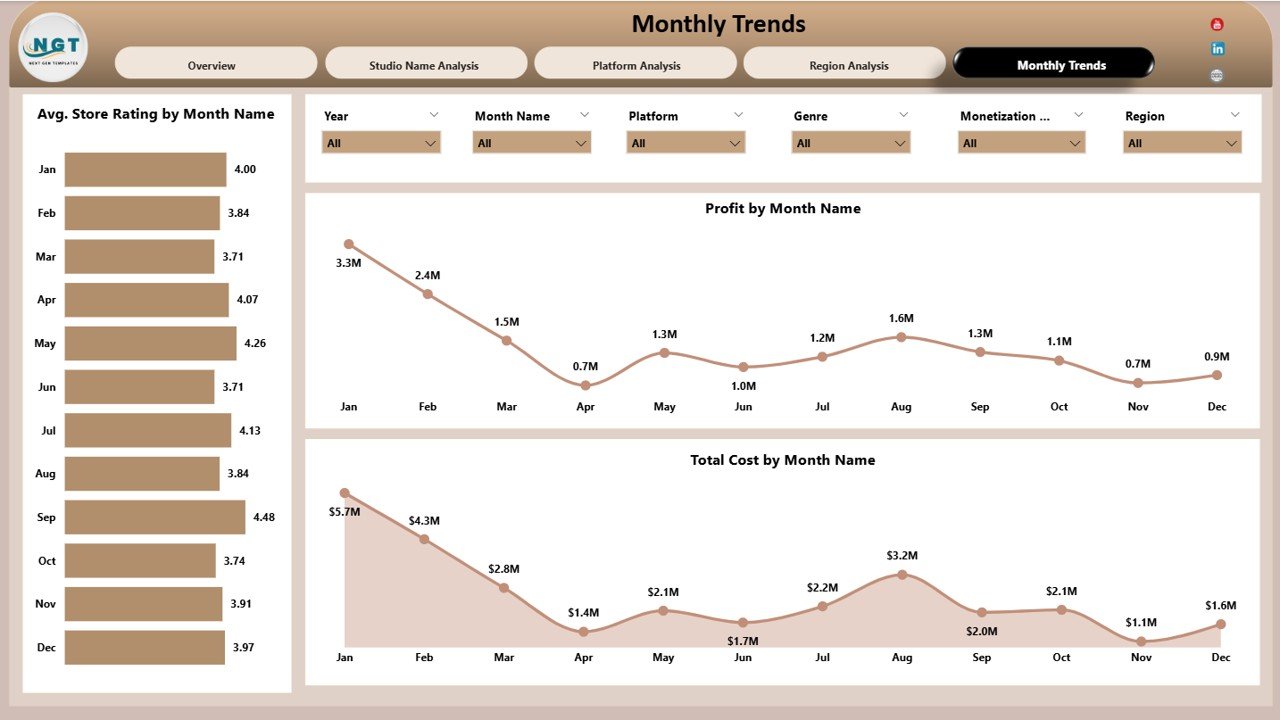
5️⃣ Monthly Trends Page
Track performance trends over time with visuals including:
-
Average Store Rating by Month
-
Profit by Month
-
Total Cost by Month
🛠 How to Use the AR/VR Gaming Studios Dashboard
Using this dashboard is simple and requires minimal setup.
1️⃣ Import your gaming studio data into Power BI.
2️⃣ Connect datasets such as revenue, user activity, platform metrics, and development costs.
3️⃣ Refresh the dashboard to update visuals automatically.
4️⃣ Use interactive filters to analyze performance by platform, region, genre, or studio.
5️⃣ Monitor KPIs regularly to optimize game development and monetization strategies.
This template helps gaming studios transform raw data into meaningful insights quickly.
👨💻 Who Can Benefit from This AR/VR Gaming Studios Dashboard?
This dashboard is valuable for many professionals in the gaming industry.
🎮 Gaming Studio Managers – Monitor financial performance and player engagement.
📊 Data Analysts – Analyze gaming data and generate strategic insights.
💼 Game Developers & Producers – Track game performance and optimize development costs.
📈 Business Strategists – Identify profitable markets and expansion opportunities.
🌍 Gaming Publishers – Evaluate platform performance and regional demand.
🏢 Gaming Startups – Gain clear visibility into studio performance and growth metrics.
Click here to read the Detailed blog post
Visit our YouTube channel to learn step-by-step video tutorials
👉 YouTube Channel: https://youtube.com/@PKAnExcelExpert