Agriculture today is not just about land and labor — it is about data. Yield per acre, fertilizer efficiency, soil quality, seasonal productivity, and regional profitability all determine success.
Yet many farms and agribusinesses still rely on scattered spreadsheets. As a result, reporting becomes slow, decisions become reactive, and growth opportunities are missed.
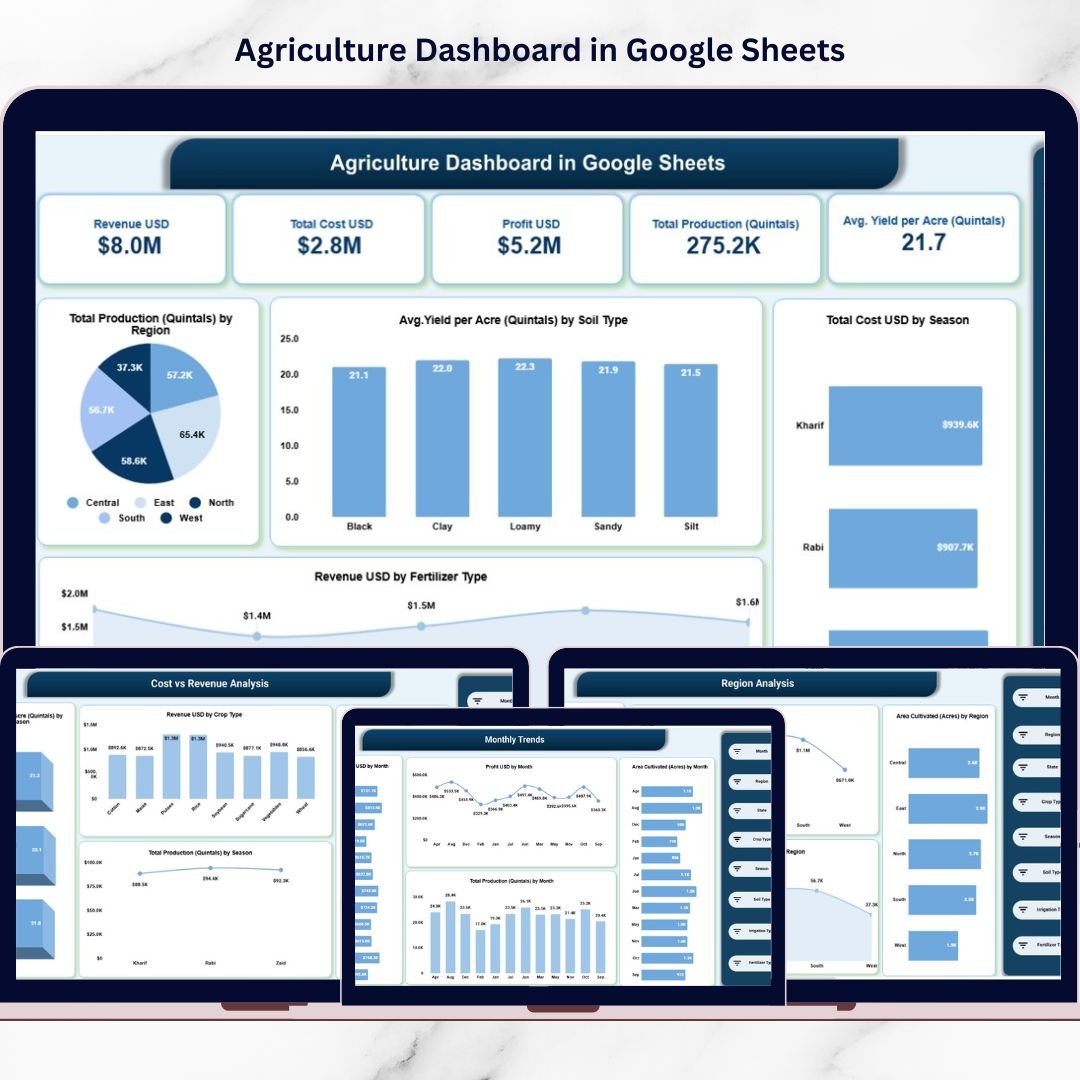
Introducing the Agriculture Dashboard in Google Sheets — a ready-to-use, fully interactive performance monitoring solution designed to track farm productivity, cost efficiency, and profitability in one structured system.
This dashboard transforms raw agricultural data into powerful visual insights — without coding or complex tools.
🚀 Key Feature of Agriculture Dashboard in Google Sheets
📊 5 Fully Interactive Pages – Overview, Region Analysis, Cost vs Revenue, Crop vs Soil, and Monthly Trends.
💰 Revenue & Profit Monitoring – Instantly track total revenue, cost, and profit.
🌱 Yield & Production Tracking – Monitor total production and average yield per acre.
🌍 Region-Based Performance Insights – Compare revenue and production by location.
🧪 Soil & Fertilizer Analysis – Identify high-performing combinations.
📆 Seasonal Productivity Tracking – Analyze Kharif, Rabi, and Zaid trends.
🔄 Dynamic Slicers & Filters – Filter by Month, Region, State, Crop Type, Soil Type, Irrigation Type, and Fertilizer Type.
📦 What’s Inside the Agriculture Dashboard in Google Sheets
This ready-to-use Google Sheets file includes the following structured pages:
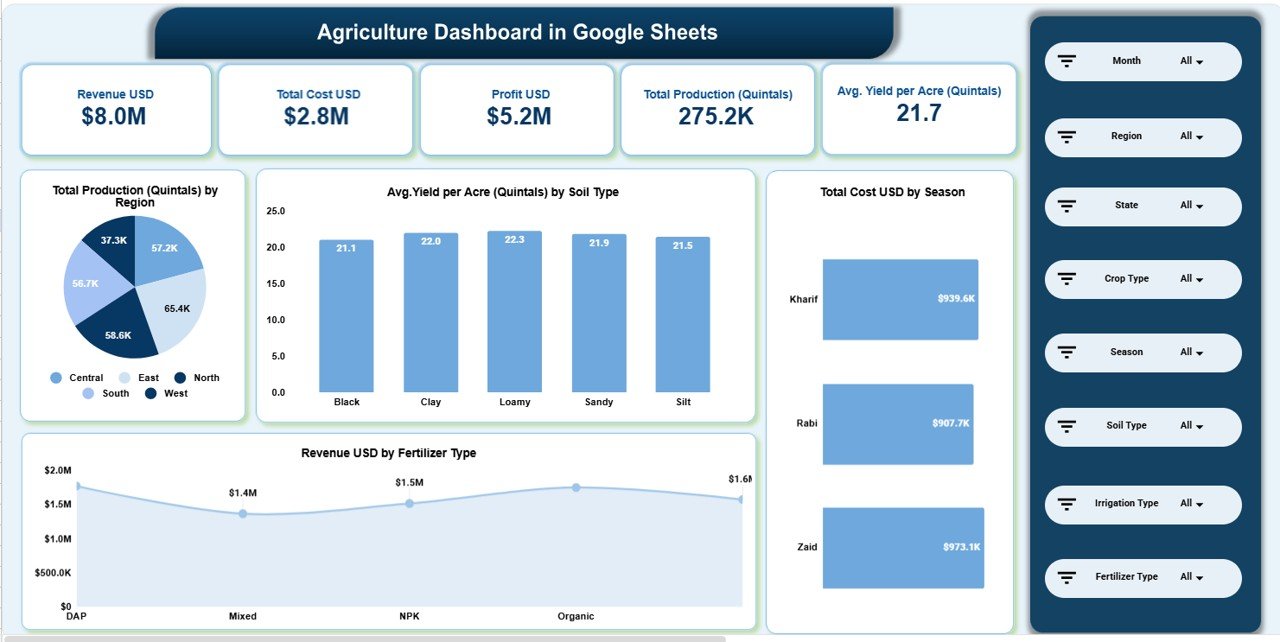
1️⃣ Overview Page – Complete Farm Health Snapshot
Key KPI Cards Display:
-
Revenue (USD)
-
Total Cost (USD)
-
Profit (USD)
-
Total Production (Quintals)
-
Average Yield per Acre
Visual Reports Include:
-
Total Production by Region
-
Average Yield by Soil Type
-
Total Cost by Season
-
Revenue by Fertilizer Type
This page gives decision-makers instant clarity about overall farm performance.
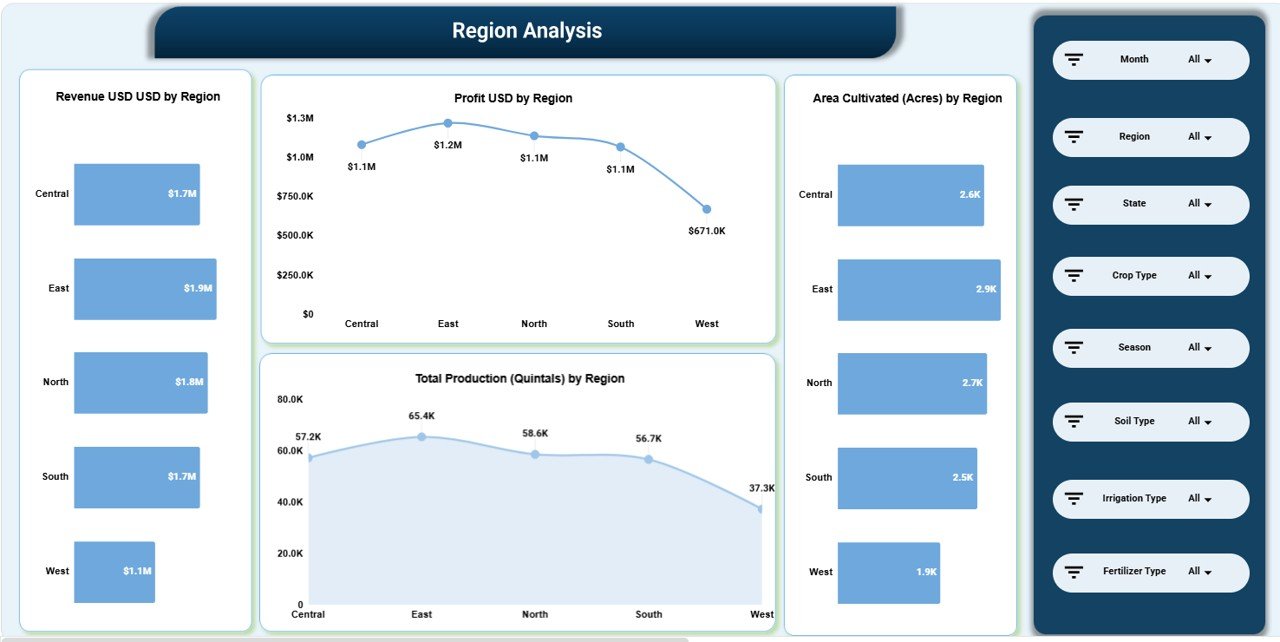
2️⃣ Region Analysis Page
Focuses on geographic performance.
Displays:
-
Revenue by Region
-
Profit by Region
-
Area Cultivated (Acres)
-
Total Production by Region
Identify top-performing regions and underperforming areas instantly.
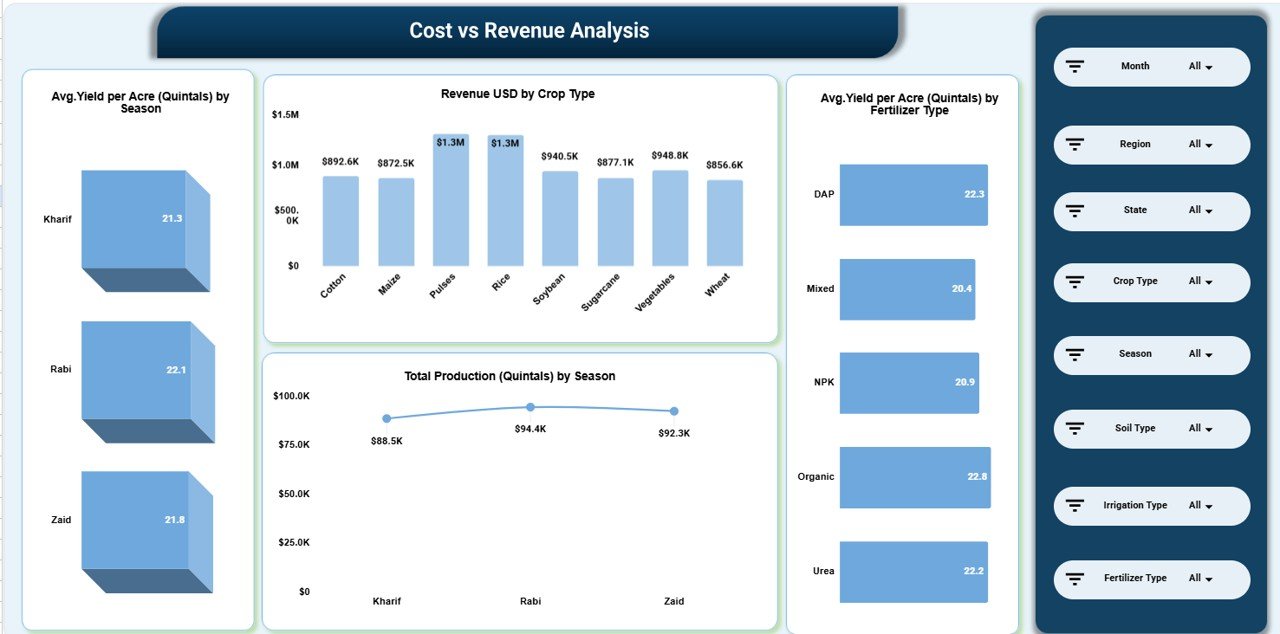
3️⃣ Cost vs Revenue Analysis Page
Tracks profitability and crop efficiency.
Includes:
-
Revenue by Crop Type
-
Average Yield by Fertilizer Type
-
Total Production by Season
Compare cotton, maize, rice, soybean, sugarcane, vegetables, wheat, and more.
Optimize crop allocation and resource distribution effectively.
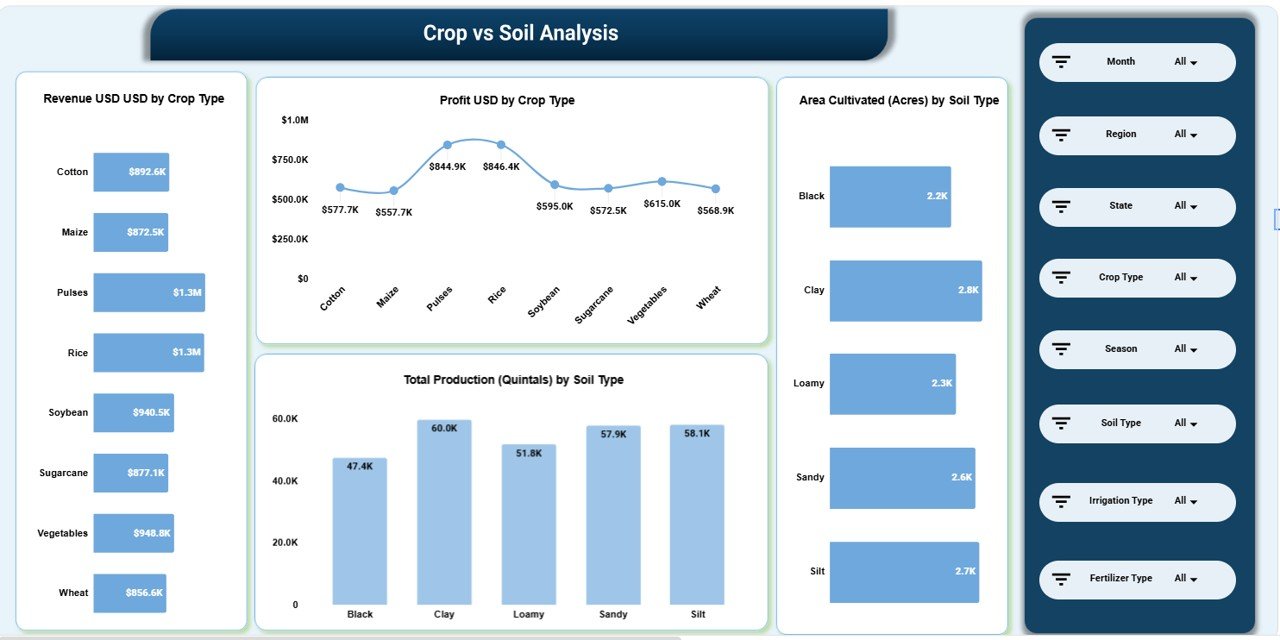
4️⃣ Crop vs Soil Analysis Page
Analyzes how soil impacts productivity.
Includes:
-
Revenue by Crop Type
-
Profit by Crop Type
-
Area Cultivated by Soil Type
-
Total Production by Soil Type
Make data-driven decisions about crop-soil combinations.
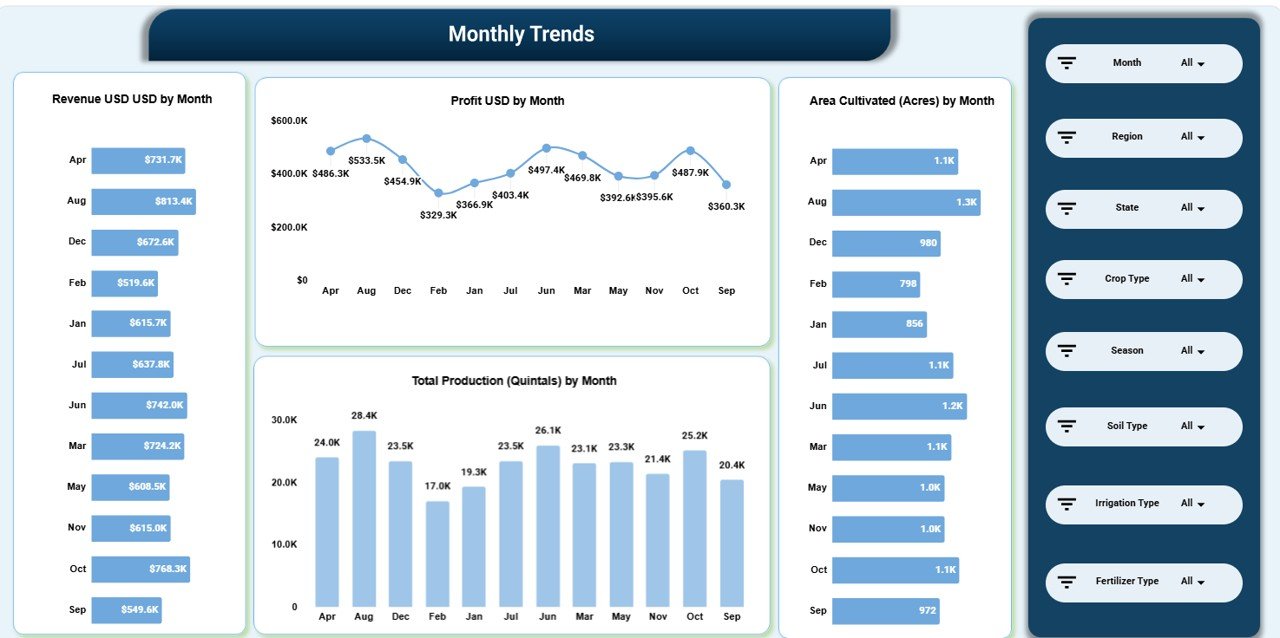
5️⃣ Monthly Trends Page
Tracks seasonal and monthly growth patterns.
Includes:
-
Revenue by Month
-
Profit by Month
-
Area Cultivated by Month
-
Total Production by Month
Plan budgets, labor allocation, and fertilizer usage based on real trends.
🛠 How to Use the Agriculture Dashboard in Google Sheets
1️⃣ Enter production, cost, and revenue data in the structured data sheet.
2️⃣ Maintain consistent units (USD, Acres, Quintals).
3️⃣ Use dropdown filters to analyze specific months or crop types.
4️⃣ Review KPI cards for quick performance status.
5️⃣ Analyze regional and seasonal patterns for planning.
Because the dashboard updates automatically, you only focus on data entry and analysis.
🌿 Who Can Benefit from This Agriculture Dashboard in Google Sheets
✔ Commercial Farming Businesses
✔ Agribusiness Companies
✔ Agricultural Consultants
✔ Government Agriculture Departments
✔ Farm Cooperatives
✔ Export-Focused Crop Producers
✔ Agricultural Startups
Whether you manage one farm or multiple regions, this dashboard provides structured control.
Why This Dashboard Can Transform Your Agricultural Operations
Instead of manually calculating yield and profit, you see numbers instantly.
Instead of guessing fertilizer impact, you analyze yield comparisons clearly.
Instead of reacting to seasonal losses, you detect patterns early.
From soil type optimization to regional profitability — every key metric becomes measurable and actionable.
If you want better productivity, stronger margins, and smarter farm planning, this dashboard becomes your competitive advantage.
Click here to read the Detailed blog post
Watch the step-by-step video tutorial:
Visit our YouTube channel to learn step-by-step video tutorials
👉 YouTube Channel – NeotechNavigators


