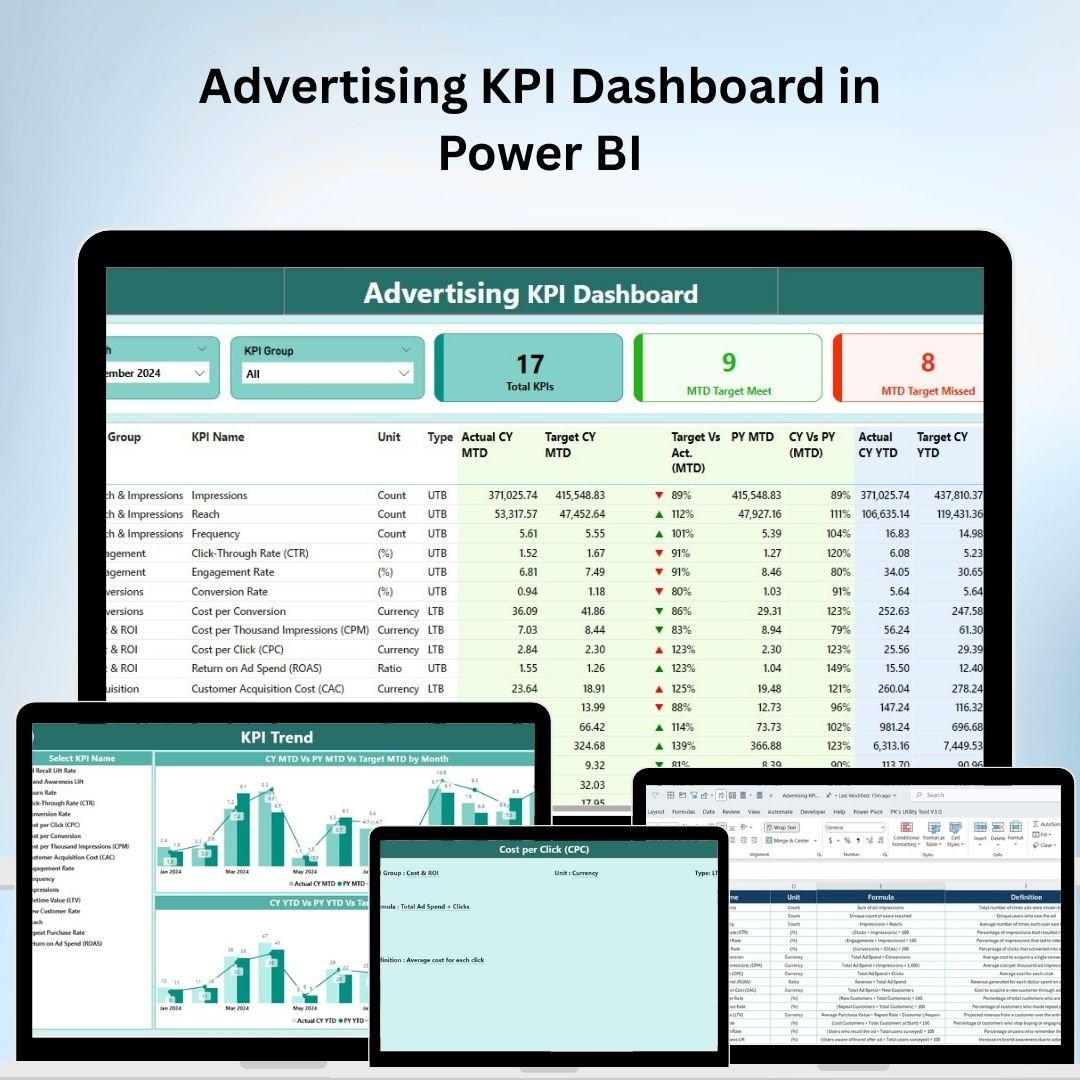
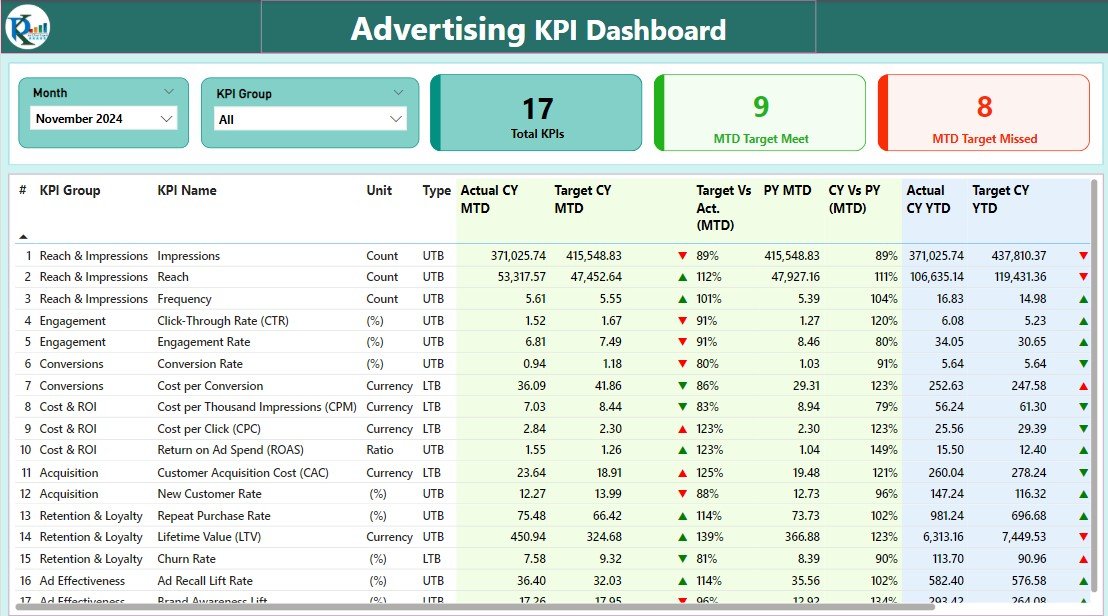
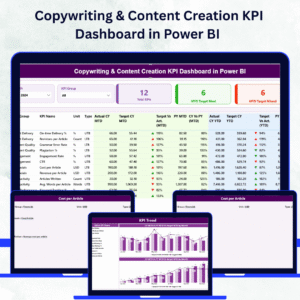
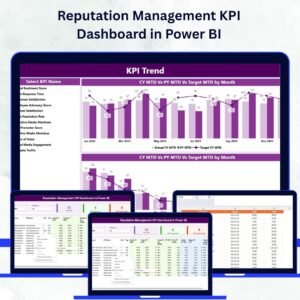
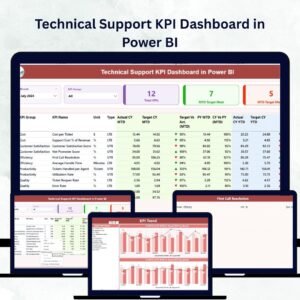
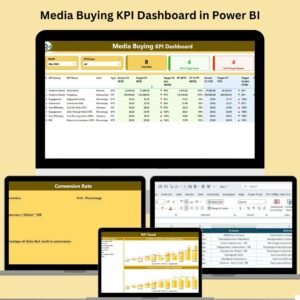
The Advertising KPI Dashboard in Power BI is an essential tool for businesses and marketing professionals who want to track and optimize the performance of their advertising campaigns. This Power BI-based dashboard offers real-time data and insights into key performance indicators (KPIs) such as impressions, click-through rates (CTR), conversion rates, and return on ad spend (ROAS). With its user-friendly interface and visually rich reports, this dashboard allows you to monitor and analyze the effectiveness of your advertising strategies across multiple channels.
The dashboard aggregates data from various sources, such as Google Ads, Facebook Ads, and other digital marketing platforms, providing a centralized view of your advertising performance. By using this dashboard, you can make data-driven decisions to improve campaign performance, reduce costs, and increase ROI.
Key Features of the Advertising KPI Dashboard in Power BI
📊 Comprehensive Ad Performance Tracking
Track key advertising metrics such as impressions, clicks, conversions, and engagement rates. Get a complete view of your advertising campaigns’ performance across different platforms.
💰 Return on Ad Spend (ROAS) Monitoring
Measure your ROAS to assess the effectiveness of your ad spend. This metric helps you understand how much revenue is generated for every dollar spent on ads, ensuring efficient budget allocation.
📈 Click-Through Rate (CTR) Analysis
Monitor your CTR to evaluate how well your ads are resonating with your target audience. A higher CTR typically indicates that your ads are relevant and engaging.
🔍 Conversion Rate Tracking
Track the percentage of clicks that convert into desired actions, such as purchases, sign-ups, or leads. This KPI helps you assess the effectiveness of your ads in driving meaningful actions.
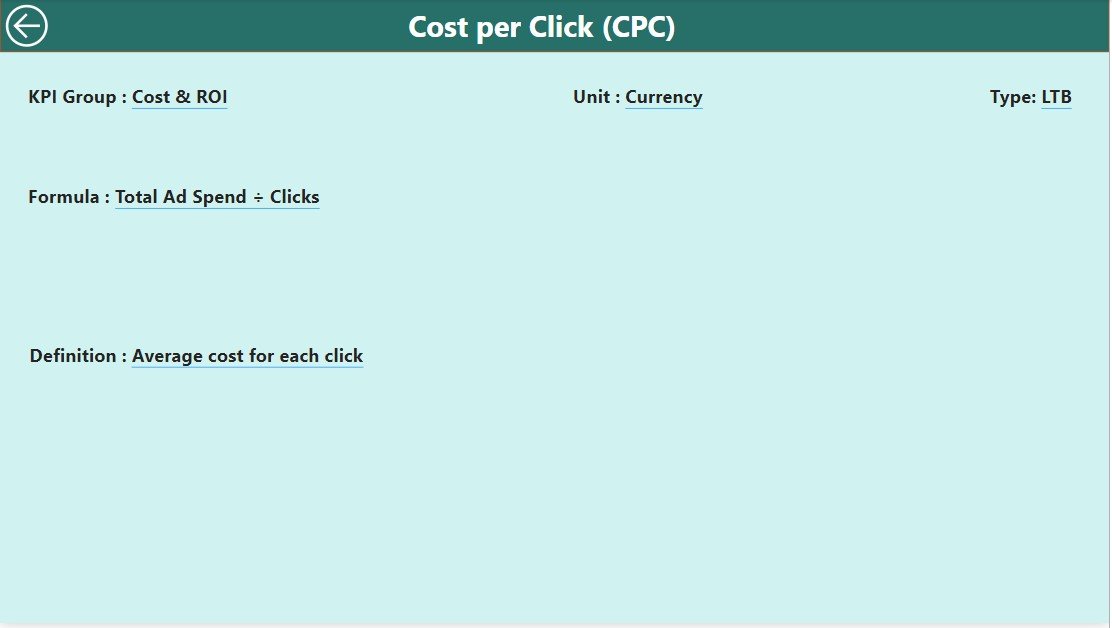
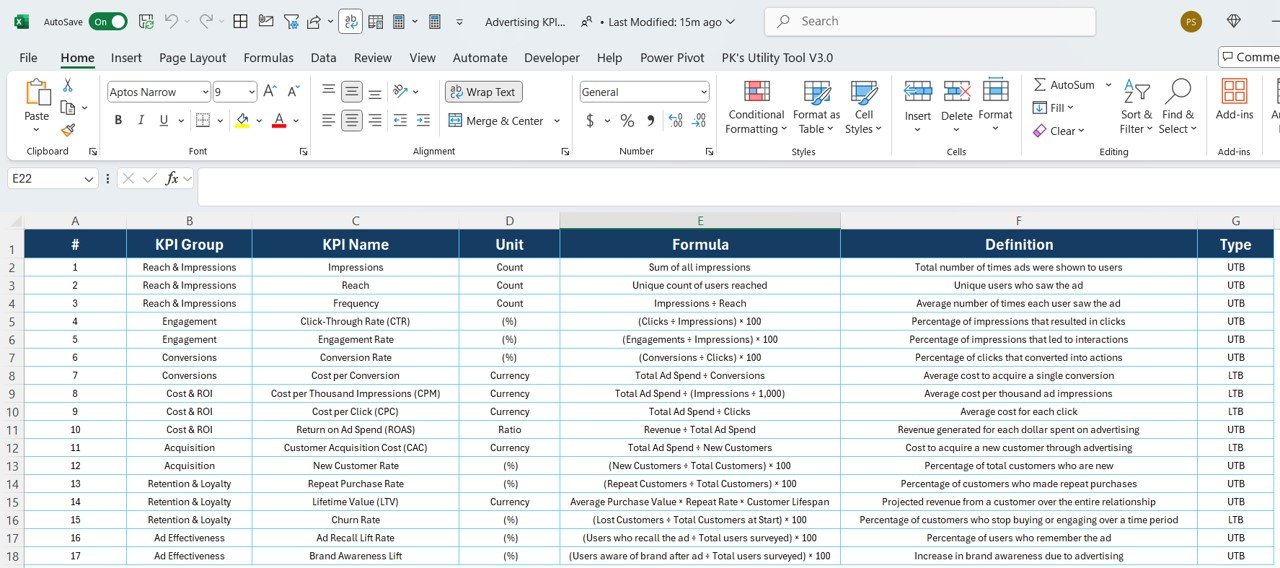
⚙️ Customizable KPIs & Metrics
Customize the dashboard to include the KPIs that are most relevant to your advertising goals. Track additional metrics such as cost per acquisition (CPA), customer lifetime value (CLV), or ad spend distribution.
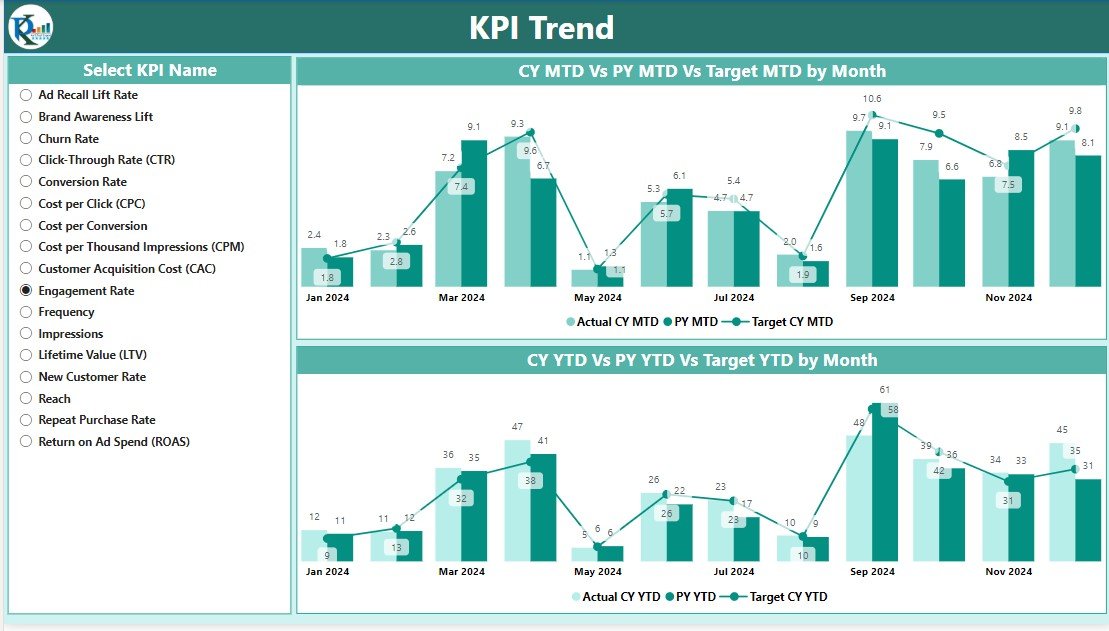
📅 Time-Based Analysis
Analyze ad performance over different periods—daily, weekly, or monthly. Use this feature to identify trends, measure campaign effectiveness, and adjust your strategies accordingly.
Why You’ll Love the Advertising KPI Dashboard in Power BI
✅ Track Advertising ROI Efficiently
Monitor key performance metrics like impressions, CTR, conversions, and ROAS to ensure your ad campaigns are driving valuable results and maximizing ROI.
✅ Improve Ad Campaign Performance
By tracking the right KPIs, you can identify underperforming ads and optimize them for better engagement, conversions, and overall performance.
✅ Better Budget Allocation
Assess the effectiveness of each advertising channel and adjust your budget allocation to focus on the most profitable campaigns and platforms.
✅ Optimize Targeting & Engagement
Monitor your ads’ engagement rates and CTR to understand how well your ads resonate with your target audience, allowing for more accurate targeting and messaging.
✅ Data-Driven Decision Making
Leverage real-time data and insights to make informed decisions that help you refine your advertising strategies, increase campaign success, and reduce wasted ad spend.
What’s Inside the Advertising KPI Dashboard in Power BI?
-
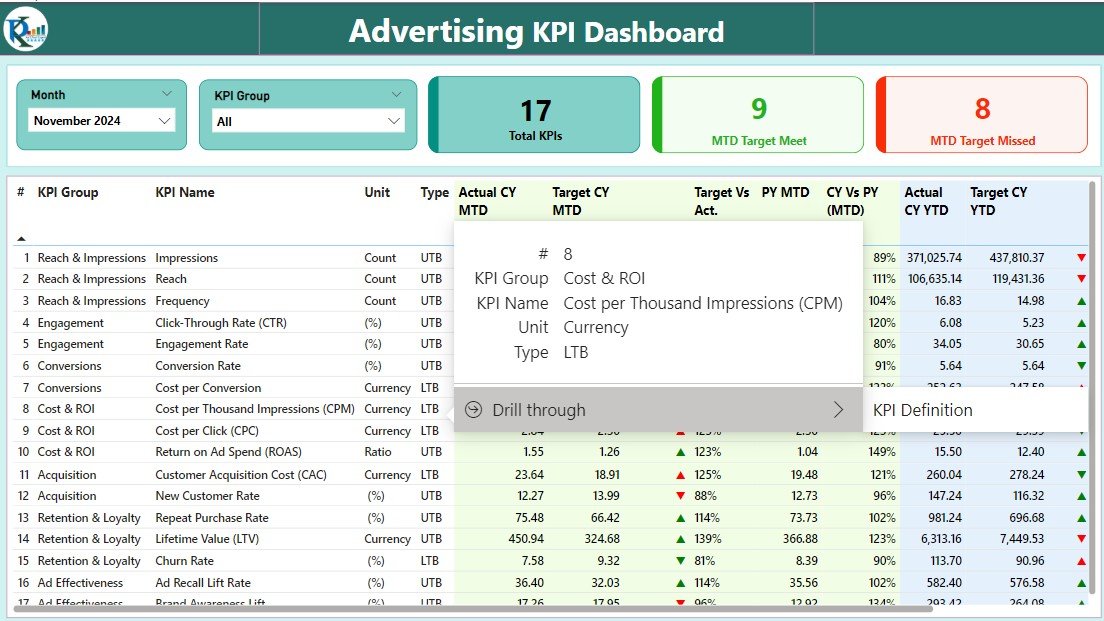
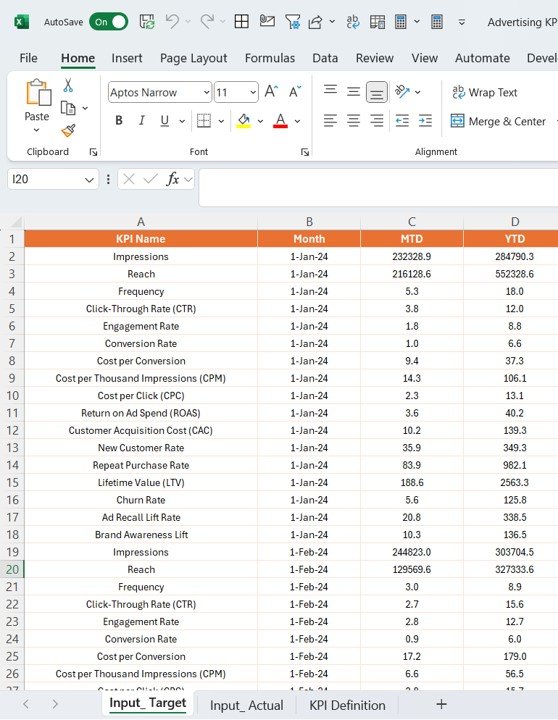
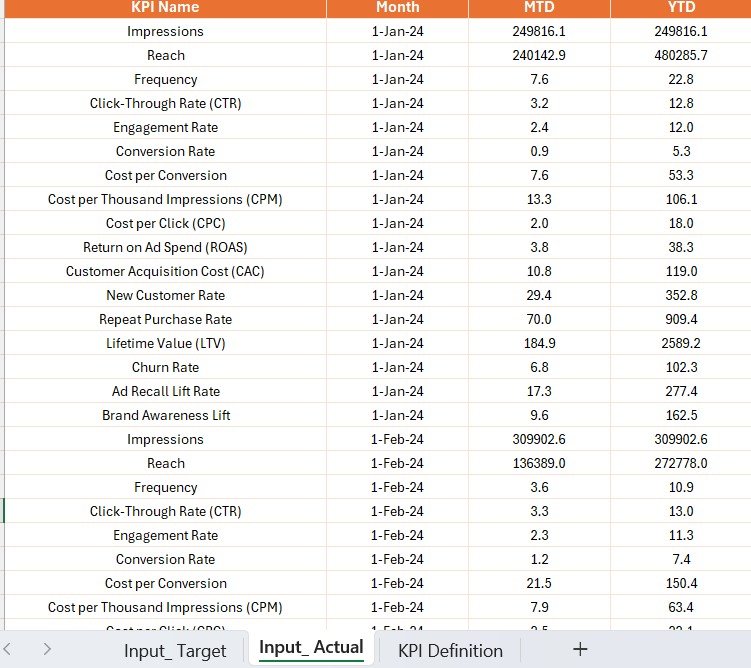
Comprehensive Ad Performance Tracking: Monitor impressions, clicks, conversions, and engagement rates.
-
Return on Ad Spend (ROAS): Measure the revenue generated for each dollar spent on ads.
-
Click-Through Rate (CTR) Monitoring: Evaluate the relevance and engagement of your ads.
-
Conversion Rate Tracking: Assess the effectiveness of your ads in driving meaningful actions.
-
Customizable KPIs: Track additional advertising metrics such as CPA, CLV, and cost distribution.
-
Time-Based Analysis: Monitor ad performance over different periods to identify trends and optimize campaigns.
How to Use the Advertising KPI Dashboard in Power BI
1️⃣ Download the Template: Access the Advertising KPI Dashboard in Power BI instantly.
2️⃣ Connect Your Data Sources: Integrate data from advertising platforms such as Google Ads, Facebook Ads, and others.
3️⃣ Track KPIs & Metrics: Monitor key advertising metrics like impressions, CTR, and ROAS.
4️⃣ Analyze Performance Trends: Use time-based analysis to track performance and adjust campaigns accordingly.
5️⃣ Optimize Your Ad Campaigns: Use the insights to refine ad strategies, target the right audience, and improve ROI.
Who Can Benefit from the Advertising KPI Dashboard in Power BI?
🔹 Marketing Teams & Agencies
🔹 Digital Advertising Professionals
🔹 E-commerce & Online Retailers
🔹 Social Media Managers & Content Creators
🔹 Business Owners & Marketing Executives
🔹 Performance Marketers & Campaign Managers
🔹 Data Analysts & Marketing Analysts
Ensure your advertising campaigns are performing at their best with the Advertising KPI Dashboard in Power BI. Track key metrics, analyze trends, and optimize your ad strategies to maximize ROI and improve your overall marketing performance.
Click here to read the Detailed blog post
Visit our YouTube channel to learn step-by-step video tutorials
Youtube.com/@PKAnExcelExpert


Reviews
There are no reviews yet.