In today’s fast-moving financial world, accounting firms can’t afford to rely on scattered spreadsheets or manual reports. You need real-time performance visibility to improve profitability, productivity, and client satisfaction. That’s exactly what the Accounting Firms KPI Dashboard in Excel delivers — a powerful, all-in-one performance-tracking system built for CPAs, accountants, and finance teams 📊.
This ready-to-use Excel template transforms complex operational and financial data into actionable insights. From revenue growth and client retention to billing efficiency and project utilization, every key metric is automatically calculated and visualized through dynamic charts and conditional formatting.
Whether you manage a small accounting practice or a multi-office firm, this dashboard helps you measure what truly matters — helping you make informed, data-driven decisions with confidence 💼.
⚙️ Key Features of the Accounting Firms KPI Dashboard in Excel
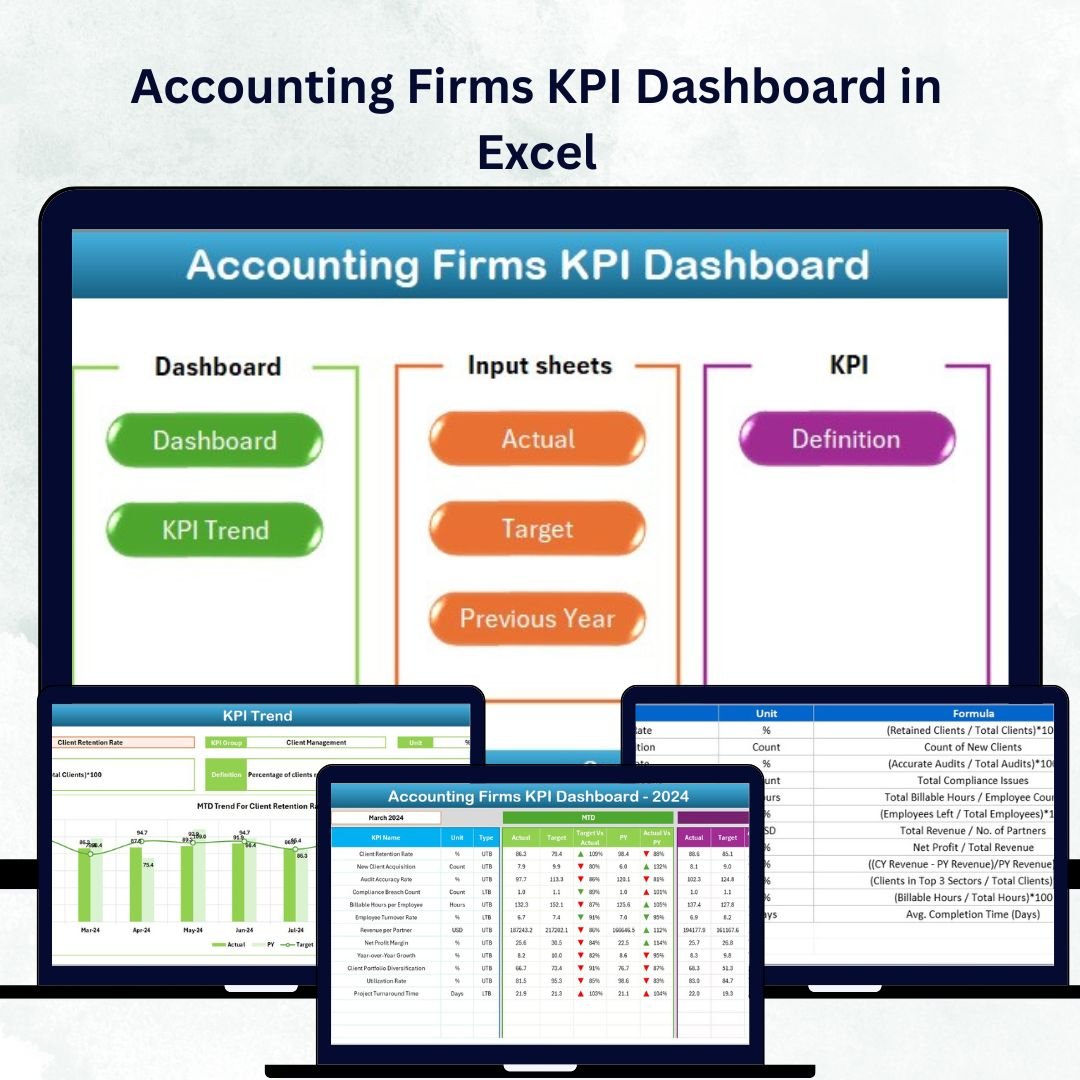
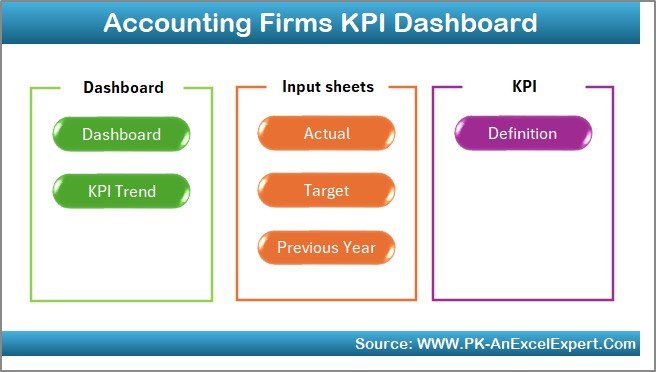
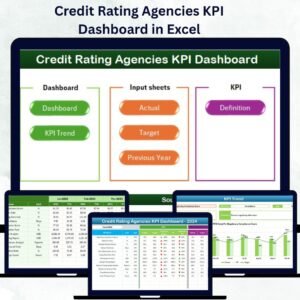
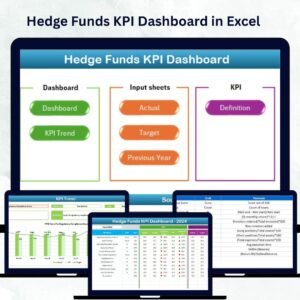
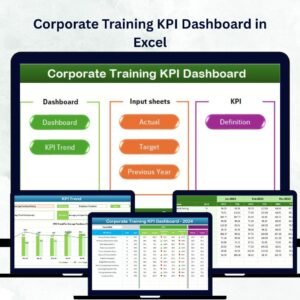
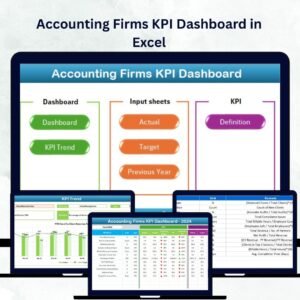
📊 7 Structured Sheets – Home, Dashboard, KPI Trend, Actual Input, Target, Previous Year, and KPI Definition.
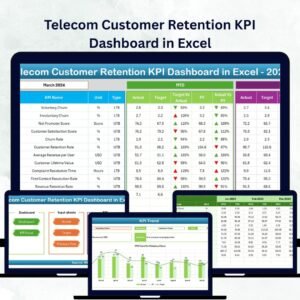
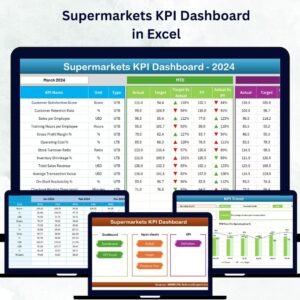
🎯 MTD & YTD Analysis – Instantly view Month-to-Date and Year-to-Date performance.
📈 Actual vs Target vs Previous Year – Compare short- and long-term trends at a glance.
🟢 Conditional Formatting Arrows – Visual cues show growth or decline.
📅 Dynamic Month Selector – Pick any month from a dropdown (cell D3) for instant updates.
💡 Interactive Charts & Tables – Easy-to-read visuals highlight key results.
💾 Automated Formulas – Eliminate manual calculations and reporting errors.
⚙️ Fully Customizable Structure – Add, modify, or rename KPIs anytime.
💰 No Extra Software Needed – 100% Excel-based for affordability and simplicity.
📦 What’s Inside the Dashboard
1️⃣ Home Sheet – Your Navigation Hub
Jump quickly between pages using interactive buttons for Dashboard, KPI Trend, Targets, and more. Even non-technical staff can navigate effortlessly.
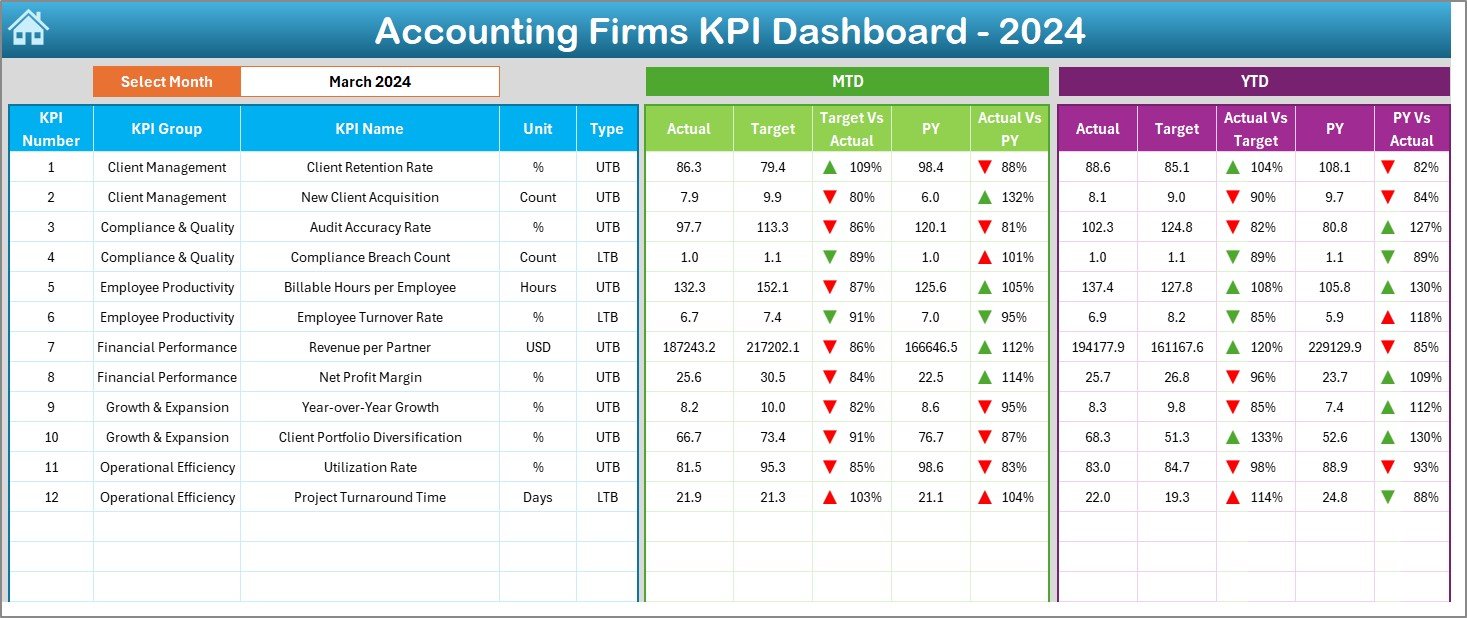
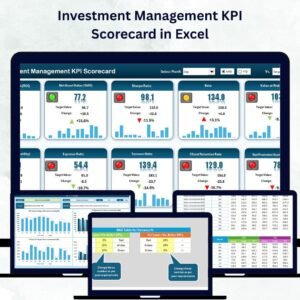
2️⃣ Dashboard Sheet – The Main Control Panel
View every KPI side by side with MTD, YTD, Actual, Target, and Previous Year data.
-
Color-coded arrows show improvement (🟢) or decline (🔴).
-
Select a month to instantly refresh visuals.
Perfect for partner meetings or management reviews.
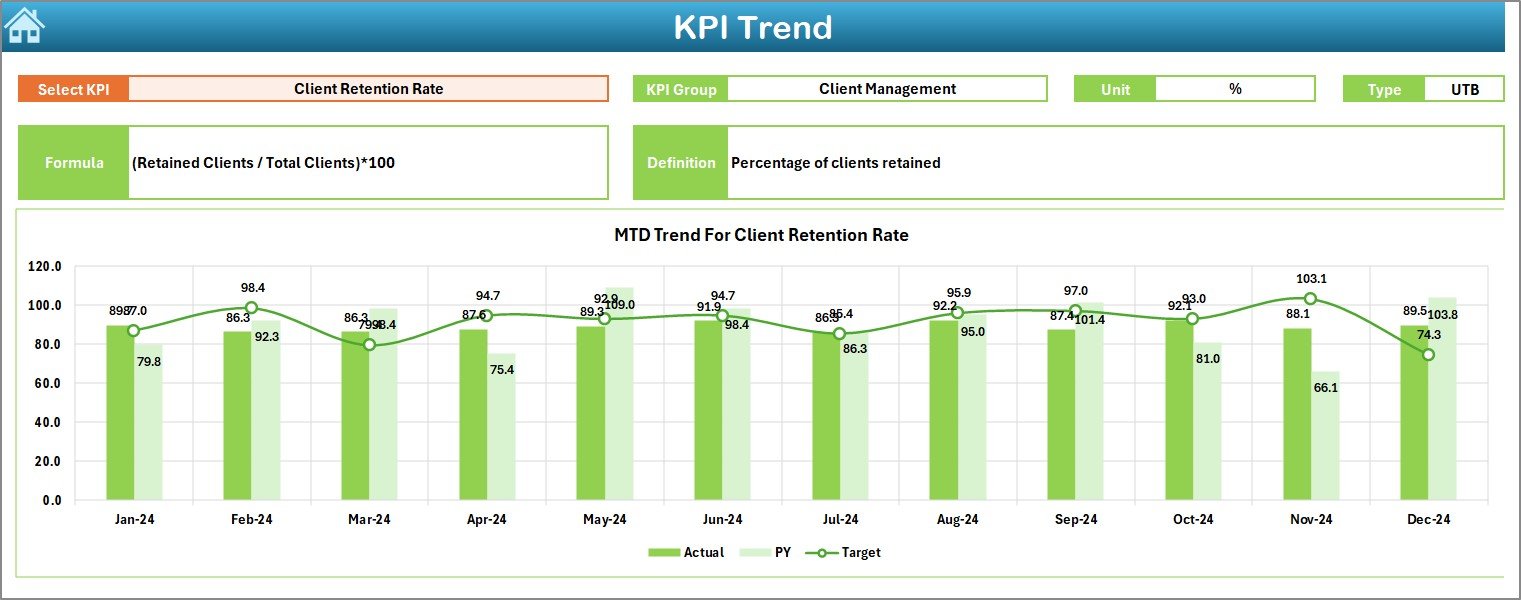
3️⃣ KPI Trend Sheet – Visual Progress Tracker
Choose any KPI (cell C3) to see:
-
Group & Unit, Type (LTB/UTB), Formula & Definition.
-
Auto-generated line & column charts showing Actual vs Target vs PY for MTD and YTD.
Spot recurring trends or seasonal patterns easily.
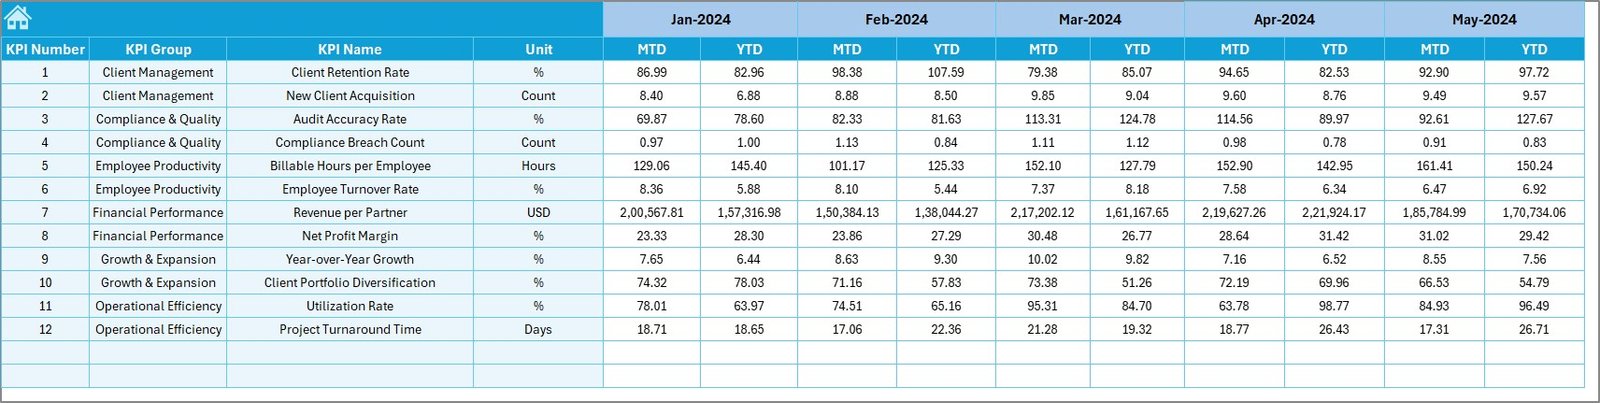
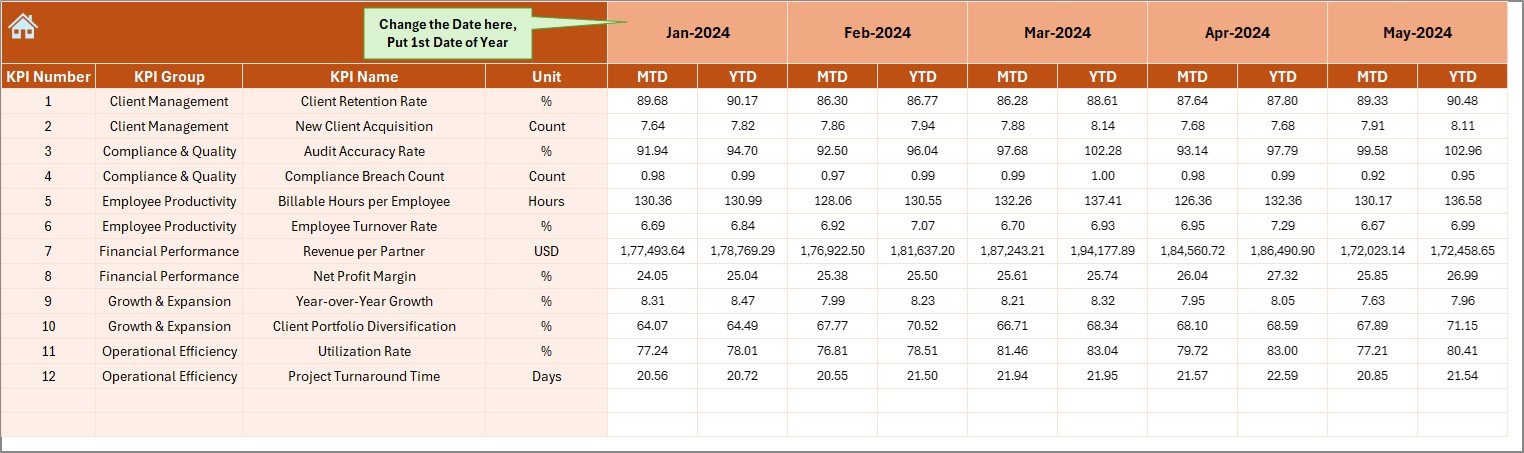
4️⃣ Actual Numbers Input Sheet
Record all operational data here – MTD & YTD values for each KPI.
Set the fiscal-year start month (cell E1) and let Excel handle alignment automatically.
5️⃣ Target Sheet
Enter monthly and YTD targets for every KPI.
Keep performance aligned with goals and strategic plans.
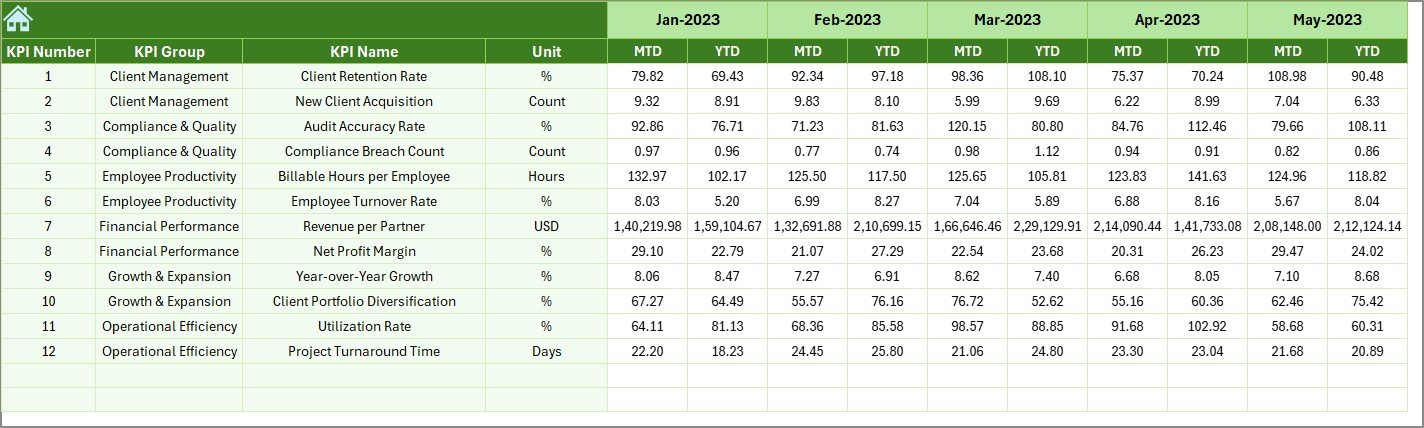
6️⃣ Previous Year Sheet
Store prior-year data for year-over-year comparisons to measure growth and efficiency improvement.
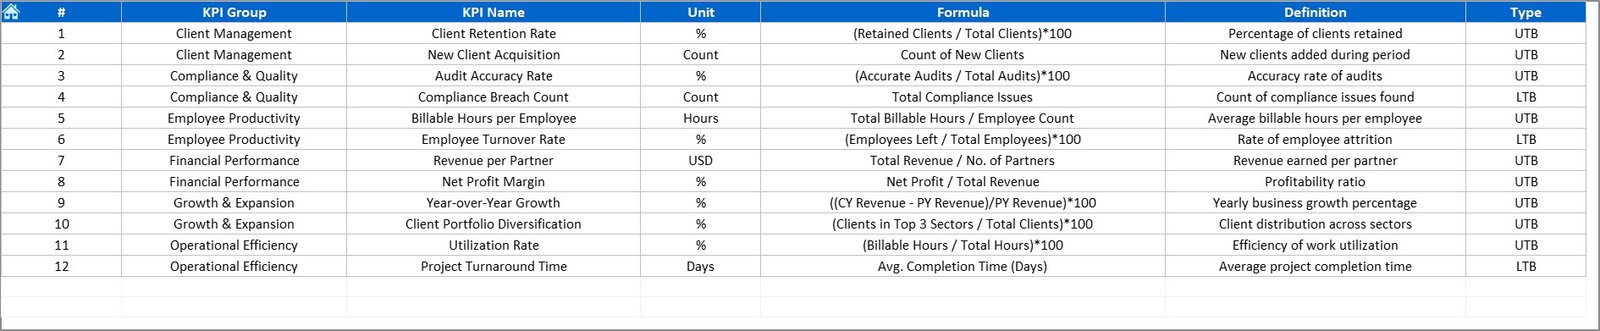
7️⃣ KPI Definition Sheet
Document KPI Name, Group, Unit, Formula, and Definition so everyone measures success consistently.
💹 Example KPIs You Can Track
💰 Financial KPIs – Revenue Growth Rate, Net Profit Margin, Expense Ratio, Accounts Receivable Turnover.
👥 Client KPIs – Client Retention Rate, Client Acquisition Cost (CAC), Project Completion Rate.
⏱ Operational KPIs – Billable Utilization %, Average Billing Rate, Revenue per Employee.
These indicators give a complete picture of profitability, efficiency, and client success.
🌟 Advantages of the Accounting Firms KPI Dashboard
✅ Centralized Performance Monitoring – All your data in one dashboard.
✅ Real-Time Insights – Instantly compare MTD, YTD & PY performance.
✅ Improved Decision-Making – Data visuals simplify strategy reviews.
✅ Flexible Customization – Modify KPIs and targets as your firm grows.
✅ Enhanced Accountability – Assign responsibility for each metric.
✅ Cost-Efficient Tool – No BI software required — Excel does it all.
✅ Professional Presentation – Perfect for partner reports & client briefings.
💡 Best Practices for Effective Use
-
📅 Update Actual & Target data monthly for accurate insights.
-
🎯 Define each KPI clearly with formulas and units.
-
🧩 Assign ownership to specific team members for accountability.
-
📊 Use conditional formatting to highlight critical trends.
-
📈 Compare YTD data to previous years for strategic context.
-
🔒 Protect formulas and confidential data with Excel password features.
When used consistently, this dashboard becomes a strategic command center for your firm’s growth and efficiency.


Reviews
There are no reviews yet.