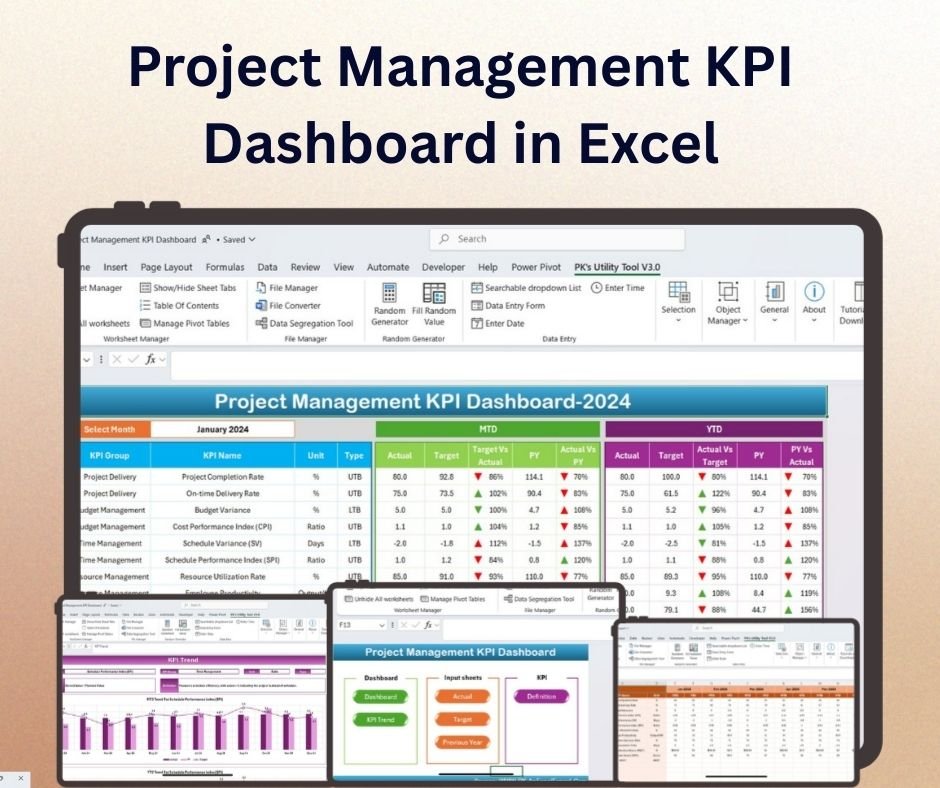
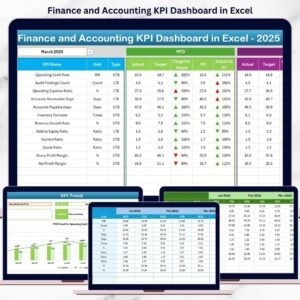
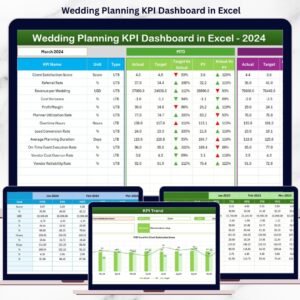
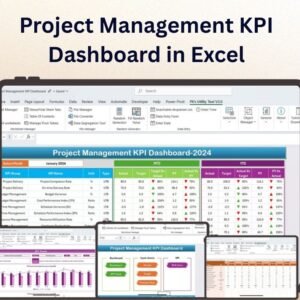
The Project Management KPI Dashboard in Excel is a robust and dynamic tool designed to help project managers and teams track and analyze key performance indicators (KPIs) across multiple projects. This dashboard provides a centralized location to monitor project progress, budget performance, resource utilization, and team performance, helping you stay on top of your projects and ensure that they are delivered on time and within budget.
This Excel-based dashboard is fully customizable, allowing you to track the specific KPIs that matter most to your business or project objectives. With a visually appealing layout, real-time updates, and easy-to-read graphs and charts, you can quickly gain insights into project performance, identify potential risks, and take proactive actions to keep your projects on track. Whether you’re managing a single project or multiple projects simultaneously, this KPI dashboard ensures that you have all the critical information you need at your fingertips.
Key Features of the Project Management KPI Dashboard in Excel:
📊 Comprehensive KPI Tracking
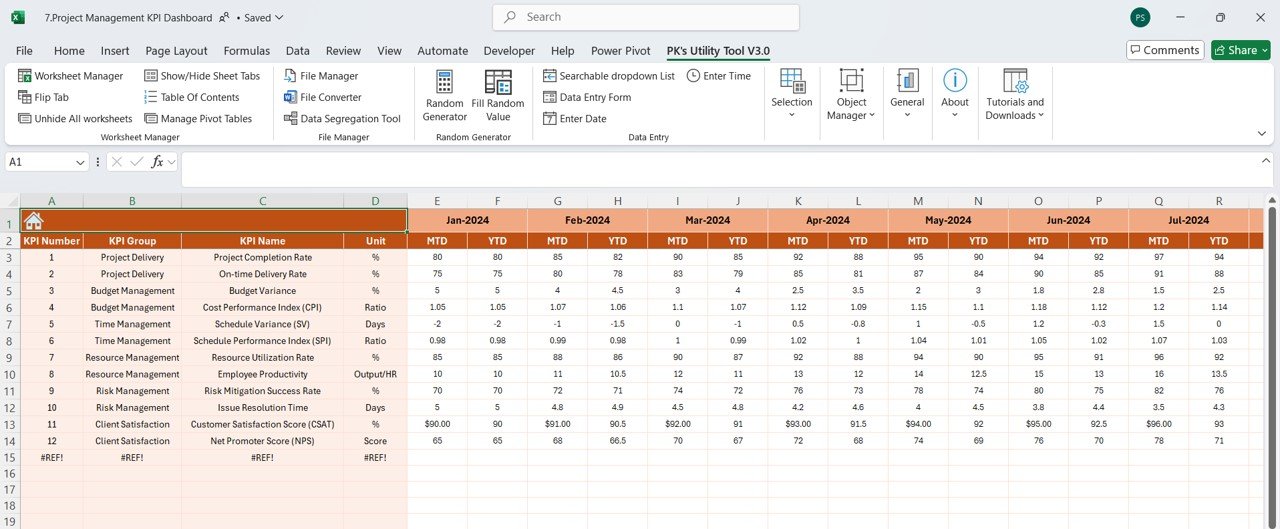
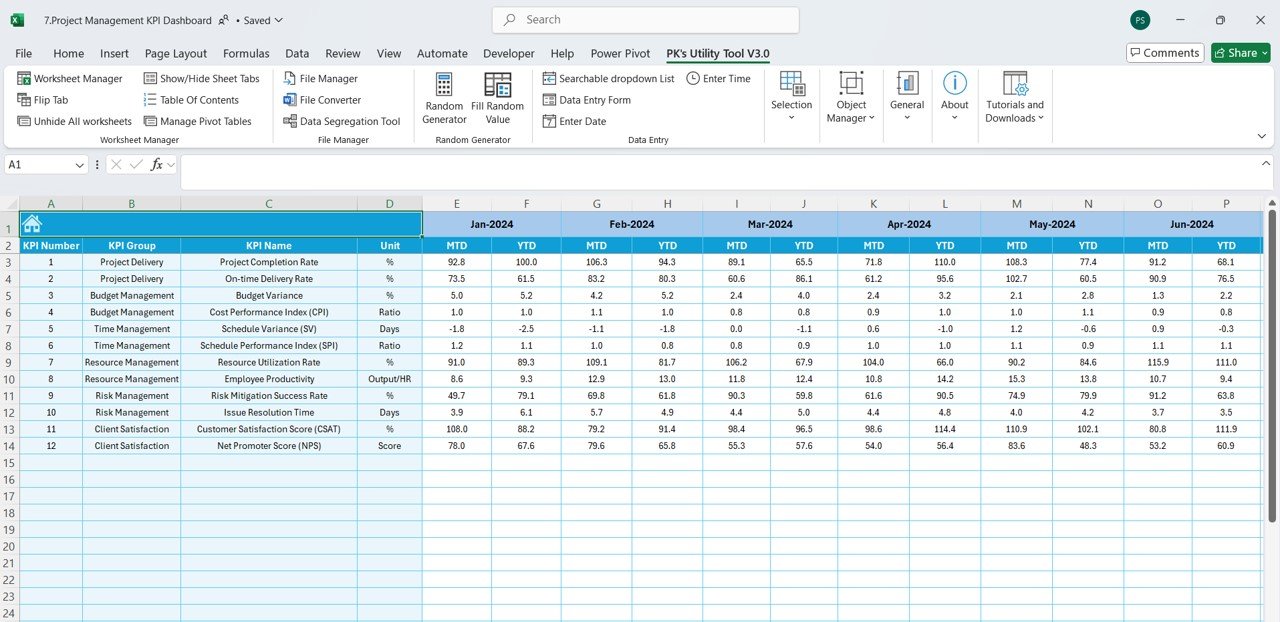
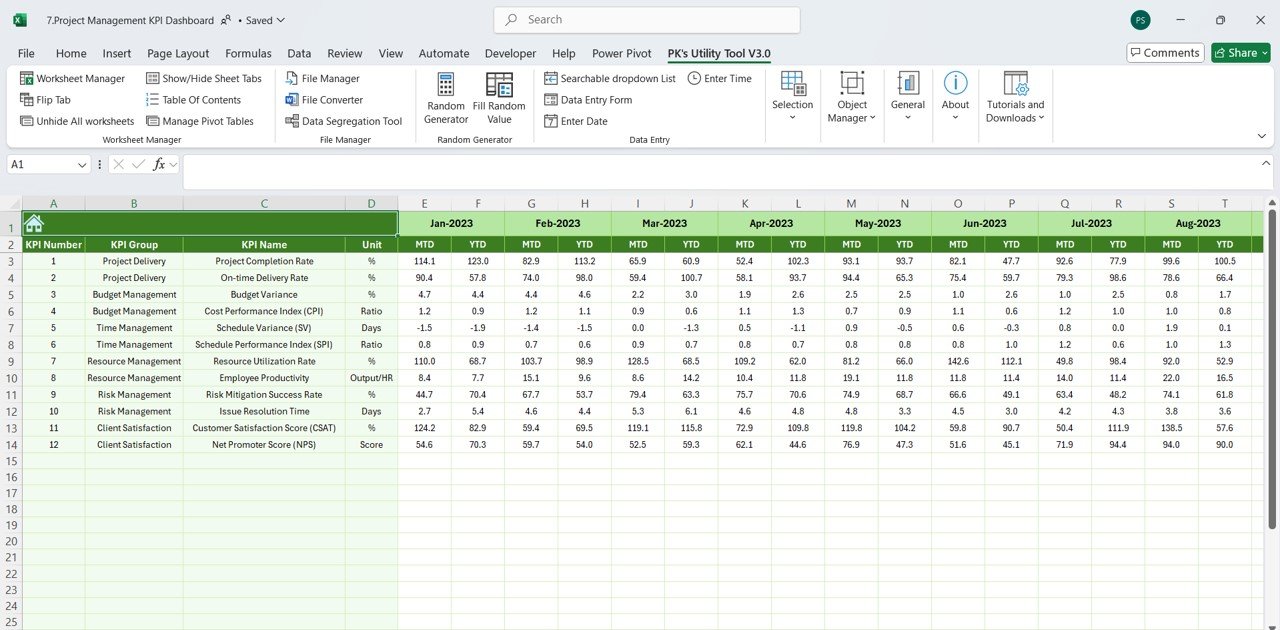
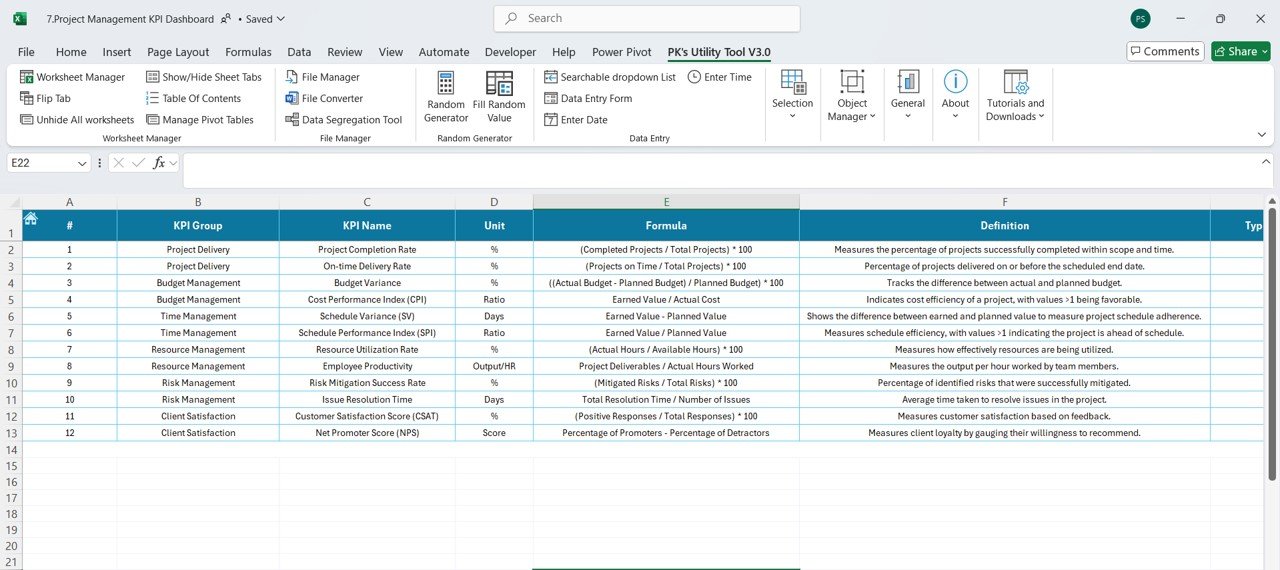
Monitor a wide range of project management KPIs, including project status, budget tracking, resource allocation, task completion, and team performance.
📅 Real-Time Data Updates
Automatically update the dashboard as you enter new data, ensuring that you have access to the most current project information at all times.
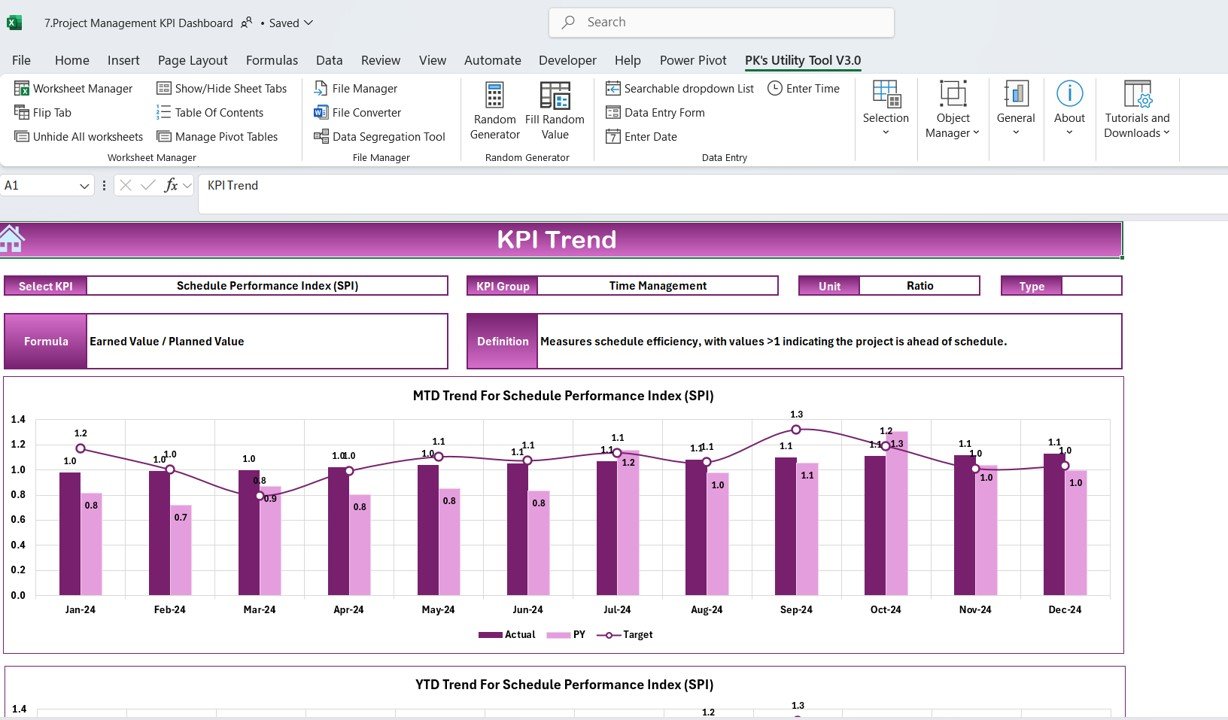
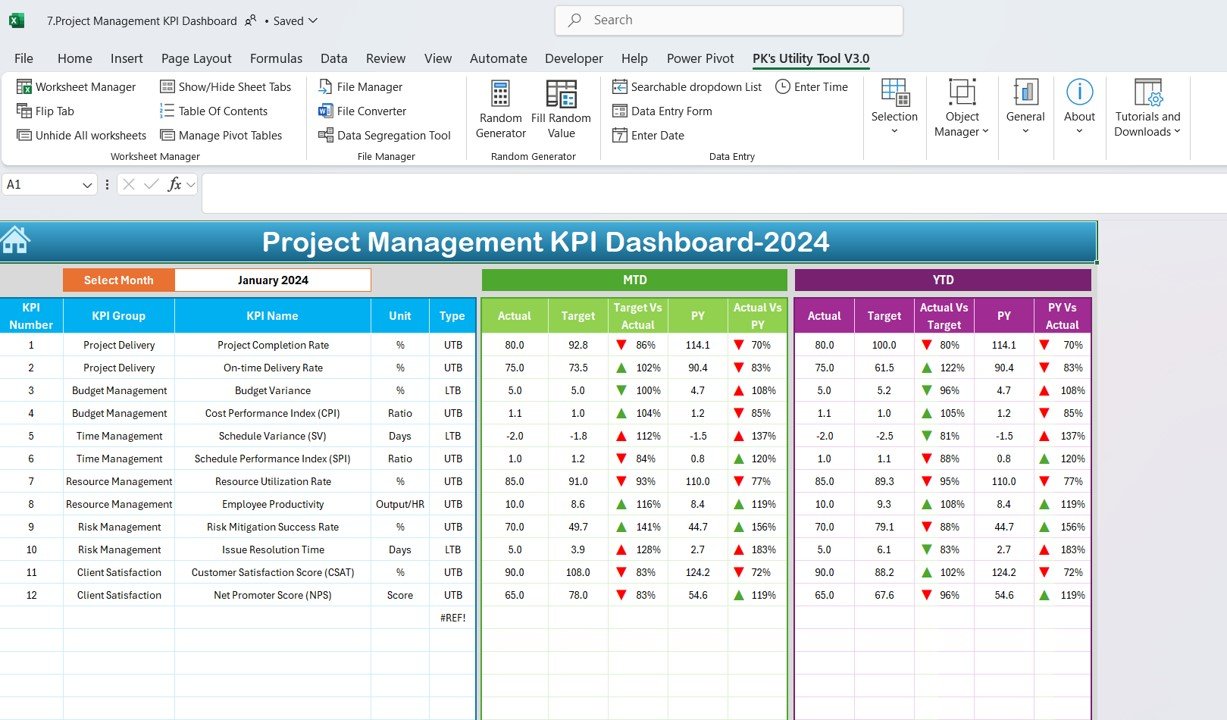
📈 Visual Data Representation
Visualize your project’s performance using dynamic charts, graphs, and progress indicators that make it easy to identify trends, delays, and areas needing attention.
🔄 Customizable Metrics
Tailor the dashboard to track the KPIs most relevant to your projects, allowing for flexible and effective project monitoring.
🛠️ User-Friendly Interface
With an intuitive design, this dashboard is easy to set up and use, making it accessible even to users with basic Excel knowledge.
Why You’ll Love the Project Management KPI Dashboard in Excel:
✅ Centralized Project Monitoring – Track and manage all of your projects’ KPIs in one place, giving you a comprehensive view of project performance and progress. ✅ Real-Time Monitoring – Stay informed with automatic data updates that provide real-time insights into your project performance. ✅ Customizable to Fit Your Needs – Adjust the dashboard to reflect your specific project goals, KPIs, and team structure. ✅ Clear Visual Insights – Use visual charts and graphs to simplify complex project data, making it easy to understand and present to stakeholders. ✅ Improved Decision Making – Leverage the data from the dashboard to make informed, data-driven decisions that keep projects on schedule and within budget.
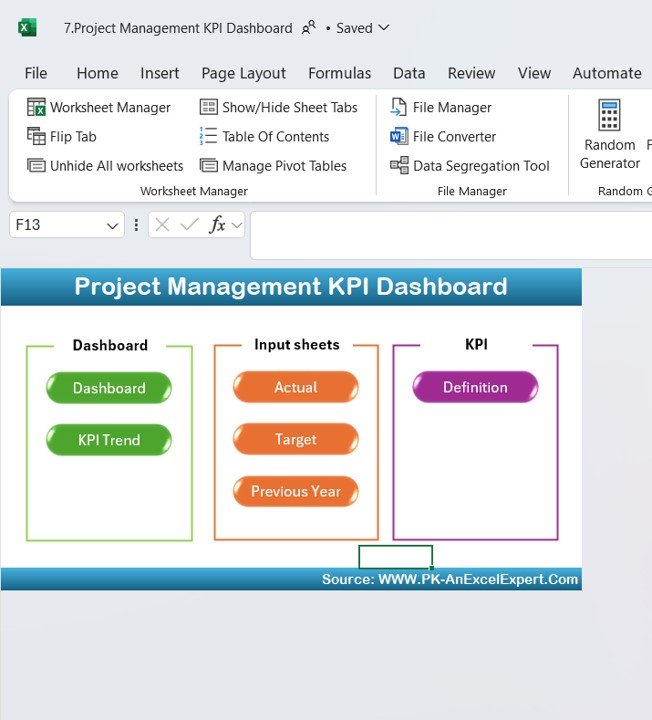
What’s Inside the Project Management KPI Dashboard in Excel:
- Project KPIs – Monitor essential KPIs such as project status, task completion, budget tracking, resource allocation, and team performance.
- Real-Time Updates – The dashboard automatically updates with the latest data to ensure your project metrics are always up to date.
- Customizable Design – Adjust the dashboard to track the specific KPIs and project data that matter most to your business or project objectives.
- Visual Performance Indicators – Use easy-to-understand graphs, charts, and progress bars to visualize project performance.
- User-Friendly Layout – A clean and intuitive layout that makes it easy to input data and track multiple projects without hassle.
How to Use the Project Management KPI Dashboard in Excel:
1️⃣ Download the Template – Get immediate access to the Excel file after purchase. 2️⃣ Input Your Project Data – Enter project details such as tasks, milestones, budget figures, and resource allocation. 3️⃣ Customize the Dashboard – Modify the KPIs, charts, and layout to fit your specific project goals. 4️⃣ Monitor Progress – Use the dashboard to track the completion of tasks, budget performance, and resource utilization in real time. 5️⃣ Make Informed Decisions – Leverage the insights from the dashboard to manage resources, adjust timelines, and ensure the successful completion of your projects.
Who Can Benefit from the Project Management KPI Dashboard in Excel:
- Project Managers
- Business Analysts
- Operations Managers
- Resource Managers
- Executives overseeing multiple projects
- Anyone responsible for managing, monitoring, and optimizing project performance
The Project Management KPI Dashboard in Excel is a must-have tool for anyone managing projects. It provides a clear, comprehensive view of project performance, helping you stay on top of progress, manage resources, and make data-driven decisions to ensure your projects are successful.
Click here to read the Detailed blog post
https://www.pk-anexcelexpert.com/project-management-kpi-dashboard-in-excel/


Reviews
There are no reviews yet.