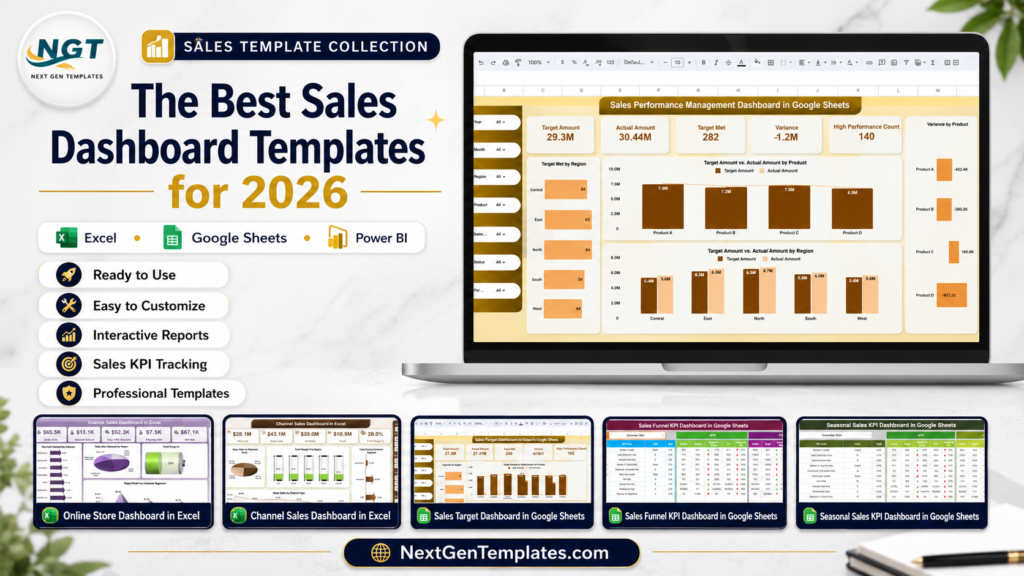
sales dashboard Excel templates are still one of the fastest ways for US sales teams to get clean pipeline, revenue, margin, and target reporting without committing to another recurring platform. In 2026, the pressure is especially sharp for founders and sales leaders: reps need better visibility, managers need faster reviews, and finance teams want numbers they can trust before the next forecast call.
The cost gap is hard to ignore. Salesforce Sales Cloud pricing currently lists Starter Suite at $25 per user/month and Pro Suite at $100 per user/month. A five-user team can spend roughly $1,500 to $6,000 per year before implementation, add-ons, or admin time. By comparison, the templates in this roundup start at $6.99 and top out at $17.99 as one-time purchases. This post compares 10 sales dashboard templates across Excel, Google Sheets, and Power BI, and positions each one for the right sales-team archetype: SMB founder, mid-market sales leader, or enterprise sales ops team.
Compare the Best Sales Dashboard Templates
| Template | Format | Best For | Price |
|---|---|---|---|
| Sales Dashboard in Power BI | Power BI | Enterprise sales ops needing executive BI | $17.99 |
| After-Sales Service KPI Dashboard in Google Sheets | Google Sheets | Customer success and service leaders | $9.99 |
| Sales Performance Management Dashboard in Google Sheets | Google Sheets | Mid-market sales leaders tracking reps and targets | $6.99 |
| Used Car Sales KPI Dashboard in Google Sheets | Google Sheets | Auto dealers and dealership managers | $12.99 |
| Sales Target Dashboard in Google Sheets | Google Sheets | Teams that need lightweight target tracking | $6.99 |
| Seasonal Sales KPI Dashboard in Google Sheets | Google Sheets | Retail and ecommerce teams managing peak seasons | $9.99 |
| Sales Funnel KPI Dashboard in Google Sheets | Google Sheets | Pipeline owners and revenue teams | $9.99 |
| Sales Dashboard For online Store in Excel | Excel | SMB founders and ecommerce operators | $17.99 |
| Channel Sales Dashboard in Power BI | Power BI | Enterprise channel sales ops | $17.99 |
| Channel Sales Dashboard in Excel | Excel | SMB channel managers and distributors | $17.99 |
Why Sales Dashboard Templates Matter in 2026
- SaaS reporting costs compound fast: Salesforce lists Starter Suite at $25 per user/month and Pro Suite at $100 per user/month. For lean teams, a one-time sales tracker template can cover reporting needs before a CRM analytics rollout makes sense.
- Reps still lose time to non-selling work: Salesforce State of Sales research has repeatedly shown that sellers spend the majority of their week on non-selling tasks. Better dashboards do not fix every workflow issue, but they reduce manual report chasing and status-update confusion.
- Sales channels are multiplying: McKinsey’s 2026 Global B2B Pulse reports that B2B buyers now use an average of 10 channels across the purchase journey. That makes channel and source-level reporting more important than ever.
- Digital revenue is no longer a side channel: The same McKinsey research reports that 71% of B2B companies now offer ecommerce, and among those companies, roughly one-third of revenue flows through digital channels.
- Analytics separates faster growers: McKinsey has also reported that B2B companies that use analytics effectively for marketing and sales performance are 1.5 times more likely to achieve above-average growth. A clean sales KPI dashboard is a practical starting point for that analytics habit.
Best Sales Dashboard Templates by Team Archetype
1. Sales Dashboard For online Store in Excel – Best for the SMB Founder
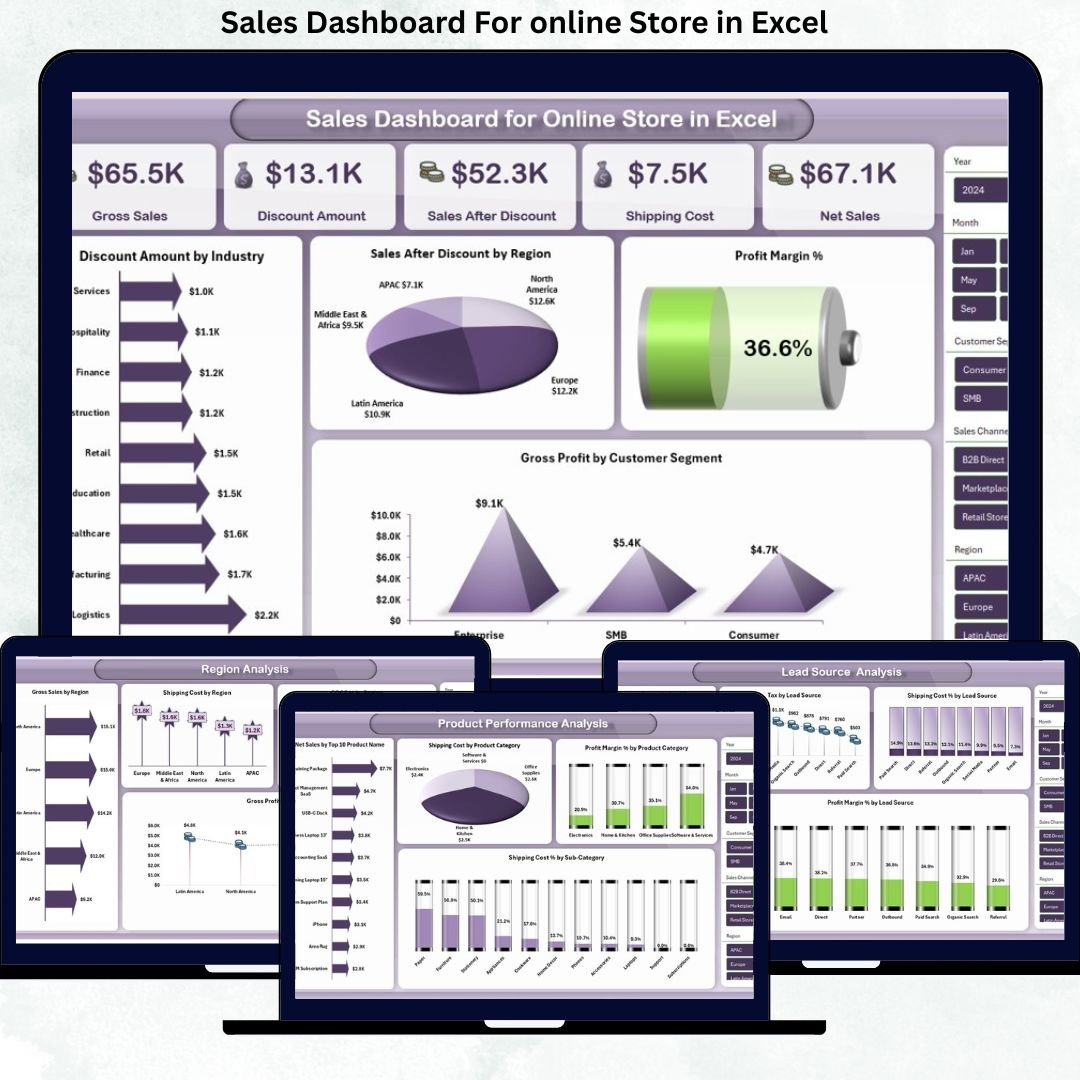
Best archetype: SMB founder or ecommerce operator who needs sales dashboard Excel reporting without a monthly analytics subscription. This template is built for online stores that want to see gross sales, net sales, discounts, shipping cost, profit margin, product performance, source performance, region analysis, and monthly trends from one workbook.
Screenshot view: the product screens show an ecommerce-style dashboard with KPI cards, product profitability views, lead source analysis, regional sales reporting, and monthly trend visuals. That makes it useful when Shopify, WooCommerce, Etsy, or marketplace exports are sitting in CSV files and you need a clean reporting layer.
- Weekly founder review of gross sales, net sales, and margin.
- Product profitability analysis before buying more inventory.
- Lead source comparison for ad spend and discount planning.
- Board, investor, or accountant reporting without granting SaaS access.
Price: $17.99. Get the Sales Dashboard For online Store in Excel.
2. Channel Sales Dashboard in Excel – Best for the SMB Channel Manager
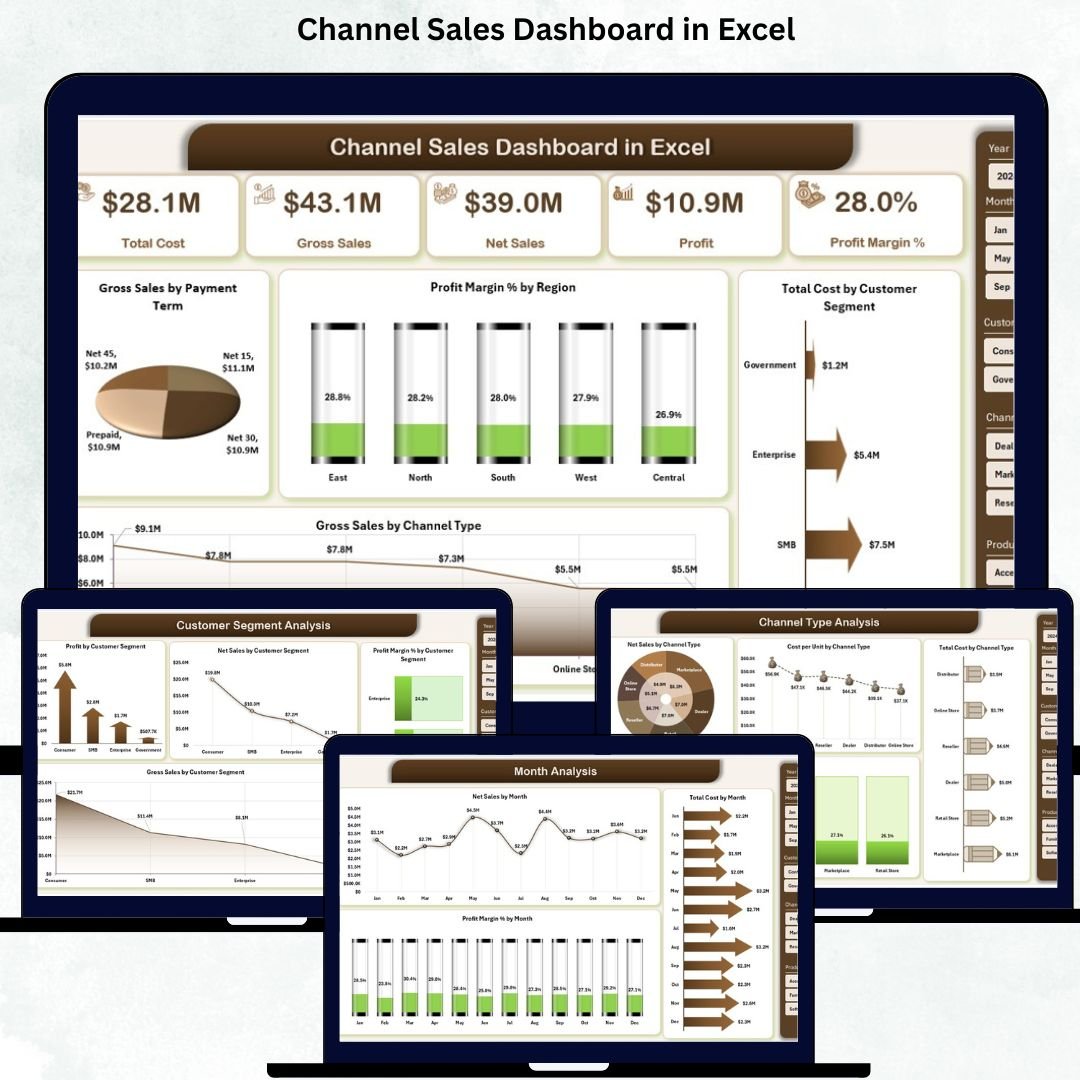
Best archetype: SMB sales manager, distributor, wholesaler, or retail operator selling through multiple channels but still living in Excel. This dashboard helps teams compare channel type, product category, customer segment, region, cost, profit, and monthly sales trends without needing a BI implementation.
Screenshot view: the workbook includes an overview page plus channel type analysis, product category analysis, customer segment analysis, and monthly performance views. It is a practical sales tracker template when the team sells through retail, direct, online, distributor, and reseller routes.
- Compare direct, reseller, retail, wholesale, and online channel performance.
- Review profit margin by region before changing territory strategy.
- Identify customer segments that drive profit, not just revenue.
- Prepare a monthly Excel sales report for leadership meetings.
Price: $17.99. Get the Channel Sales Dashboard in Excel.
3. Sales Performance Management Dashboard in Google Sheets – Best for Mid-Market Sales Leaders
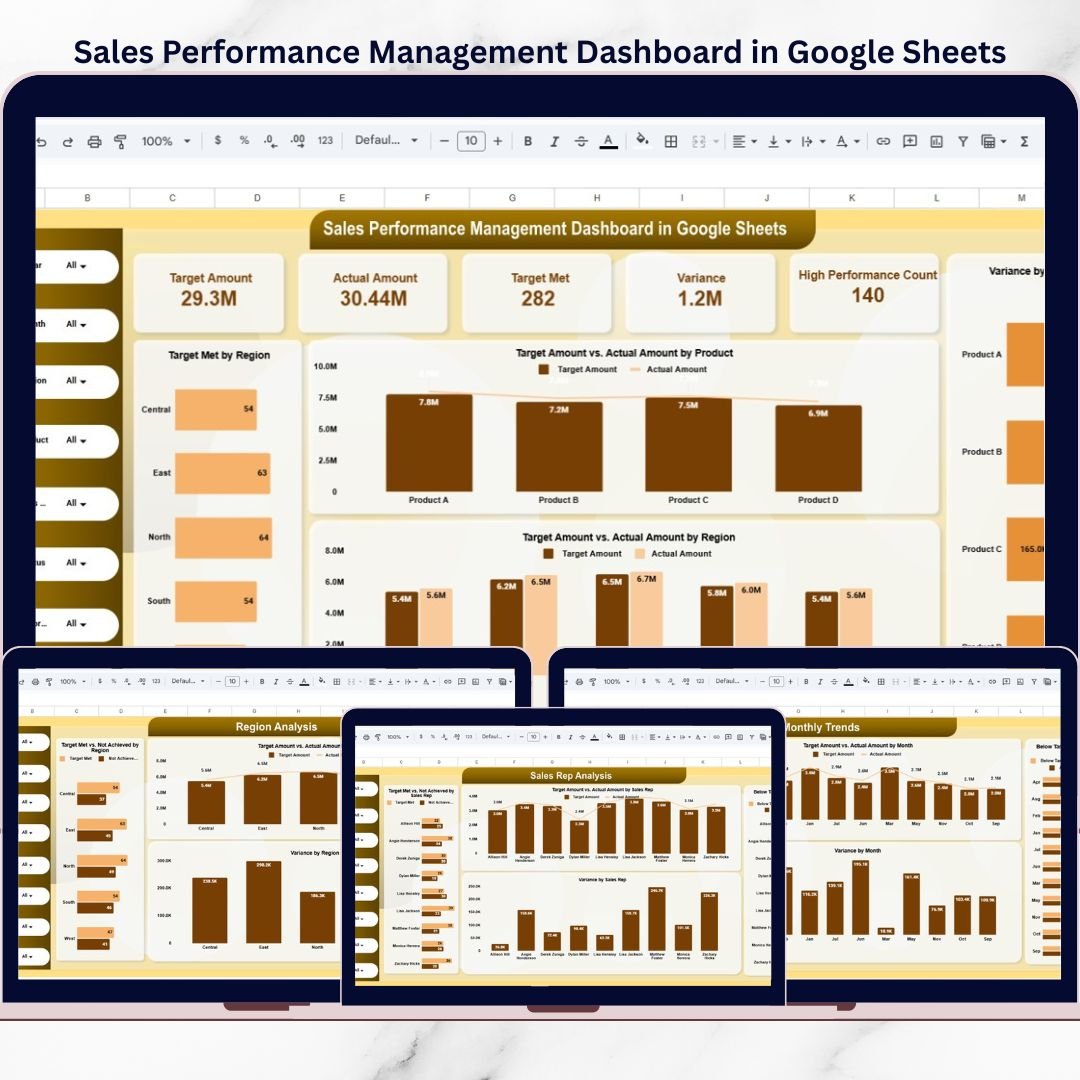
Best archetype: mid-market sales leader who needs a collaborative sales KPI dashboard for targets, actuals, variance, achievement status, and sales rep accountability. Google Sheets is the right format when the team wants real-time access, quick sharing, and no desktop file handoff.
Screenshot view: the product screens show an overview dashboard, product analysis, region analysis, sales rep analysis, monthly trends, and a detailed records/search view. It is built for practical target-vs-actual reviews rather than vanity charts.
- Run weekly target reviews by product, region, and sales rep.
- Spot below-target areas before the end of the month.
- Give sales managers a shared source of truth in Google Drive.
- Support coaching, incentives, and forecast conversations.
Price: $6.99. Get the Sales Performance Management Dashboard in Google Sheets.
4. Sales Target Dashboard in Google Sheets – Best for Lightweight Target Tracking
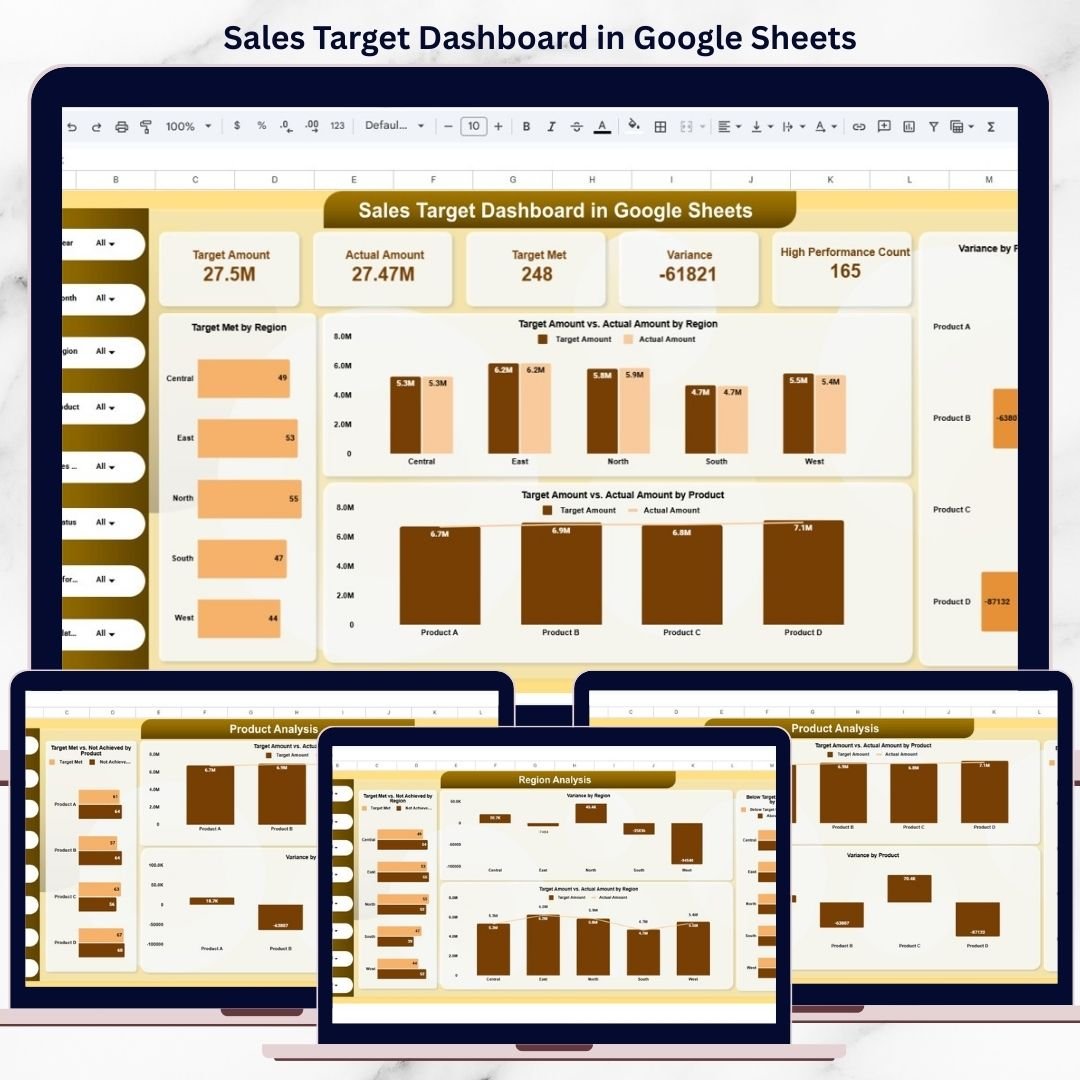
Best archetype: sales team or founder who wants a simple cloud-based sales target tracker before moving into a larger CRM dashboard. The main advantage is speed: open the Sheet, replace the sample data, and start reviewing target progress with the team.
Screenshot view: the featured product image and screens position this as a Google Sheets dashboard for structured target review. Use it as a lightweight sales tracker template for smaller teams that need target visibility but do not want a complex Power BI model or a recurring SaaS cost.
- Set and monitor monthly sales targets in a shared Sheet.
- Track planned vs actual performance during weekly sales meetings.
- Give founders a quick target snapshot without CRM configuration.
- Maintain an editable tracker for reps, managers, and finance.
Price: $6.99. Get the Sales Target Dashboard in Google Sheets.
5. Sales Funnel KPI Dashboard in Google Sheets – Best for Pipeline Owners
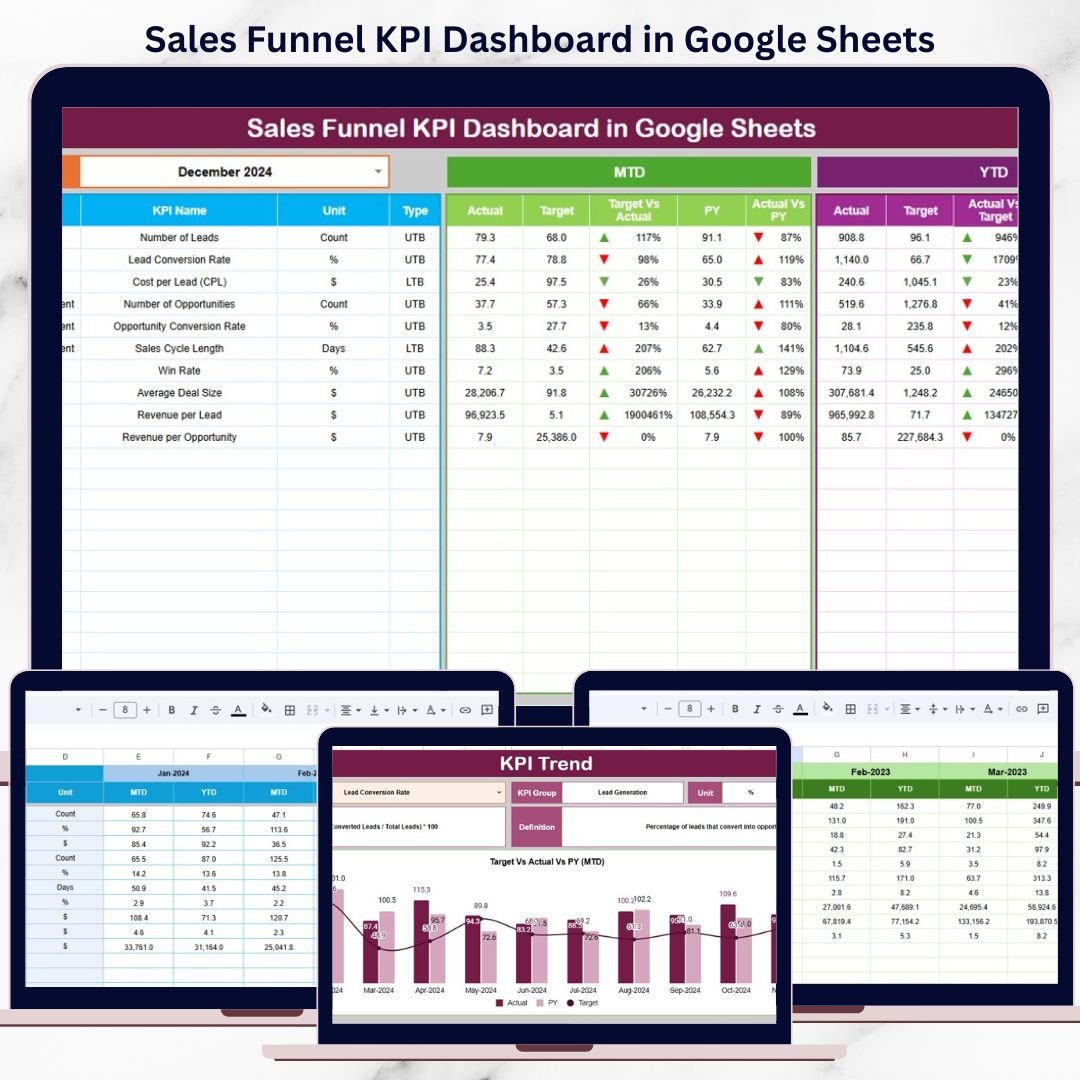
Best archetype: revenue leader, founder, or sales operations manager who cares most about funnel health. This sales KPI dashboard focuses on the journey from leads to opportunities to closed deals, making it a strong fit for pipeline reviews and conversion-rate improvement.
Screenshot view: the product screens show a dashboard sheet, KPI trend view, actual number sheet, target sheet, previous-year sheet, and KPI definition sheet. The structure supports MTD and YTD tracking, target comparison, previous-year benchmarking, and trend analysis.
- Track lead-to-opportunity and opportunity-to-win movement.
- Identify stages where deals slow down or drop out.
- Compare funnel KPIs against targets and last year.
- Review pipeline health in a shared Google Sheets environment.
Price: $9.99. Get the Sales Funnel KPI Dashboard in Google Sheets.
6. Seasonal Sales KPI Dashboard in Google Sheets – Best for Peak-Season Planning
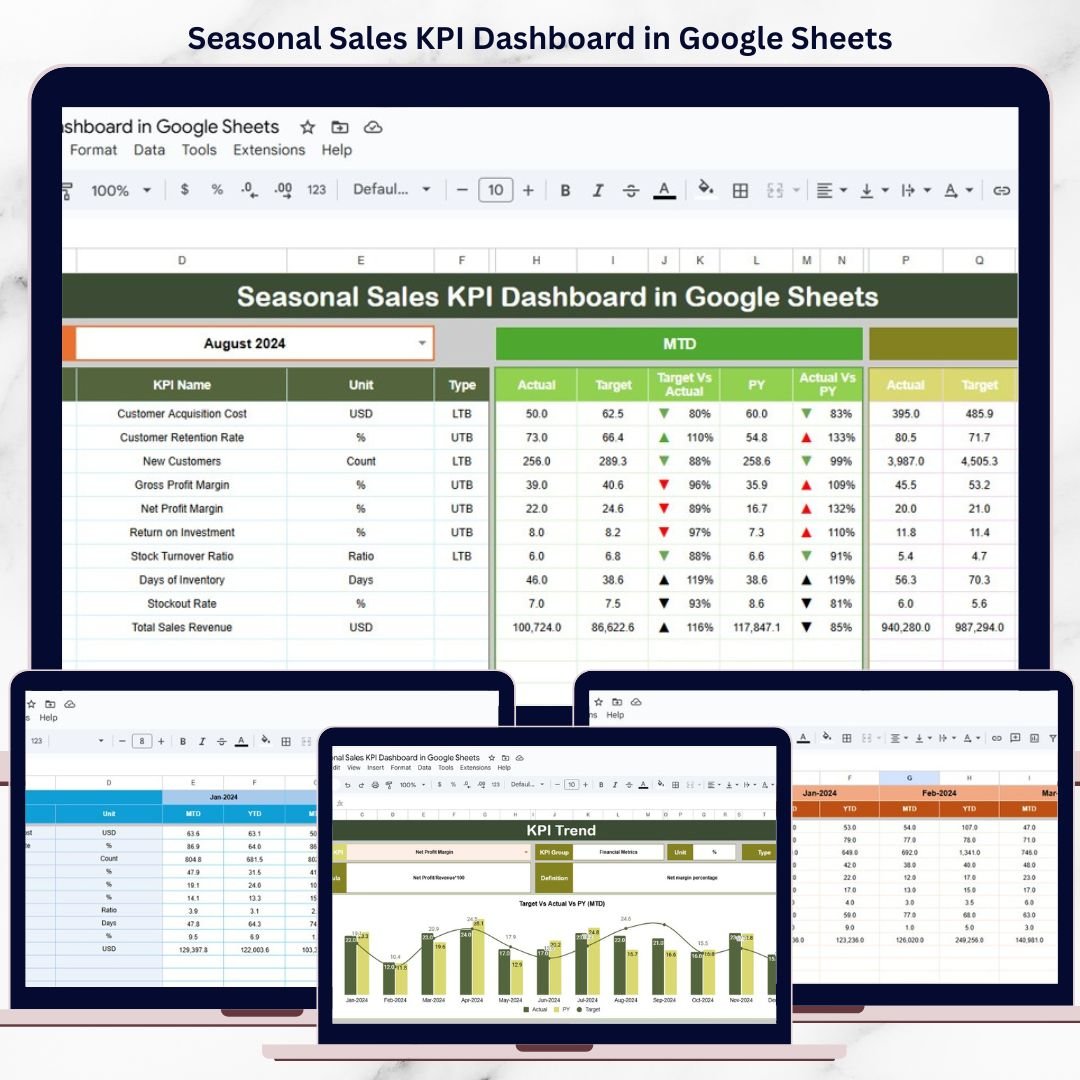
Best archetype: retail, ecommerce, wholesale, or seasonal business leader who needs to prepare before demand spikes. Seasonal teams need different dashboards because the danger is not only missing target. It is misreading seasonality, overstocking, under-staffing, and reacting too late.
Screenshot view: the product screens show an MTD/YTD dashboard, target vs actual comparisons, previous-year benchmarking, KPI trend analysis, actual input, targets, previous-year data, and KPI definitions. That is useful for businesses where November, December, summer, or back-to-school periods drive a major share of annual sales.
- Compare current seasonal sales against target and prior year.
- Track weekly or monthly peak-season progress in Google Sheets.
- Coordinate inventory, staffing, and promotions around trends.
- Review seasonal KPIs with operations and marketing teams.
Price: $9.99. Get the Seasonal Sales KPI Dashboard in Google Sheets.
7. Used Car Sales KPI Dashboard in Google Sheets – Best for Dealership Sales Teams
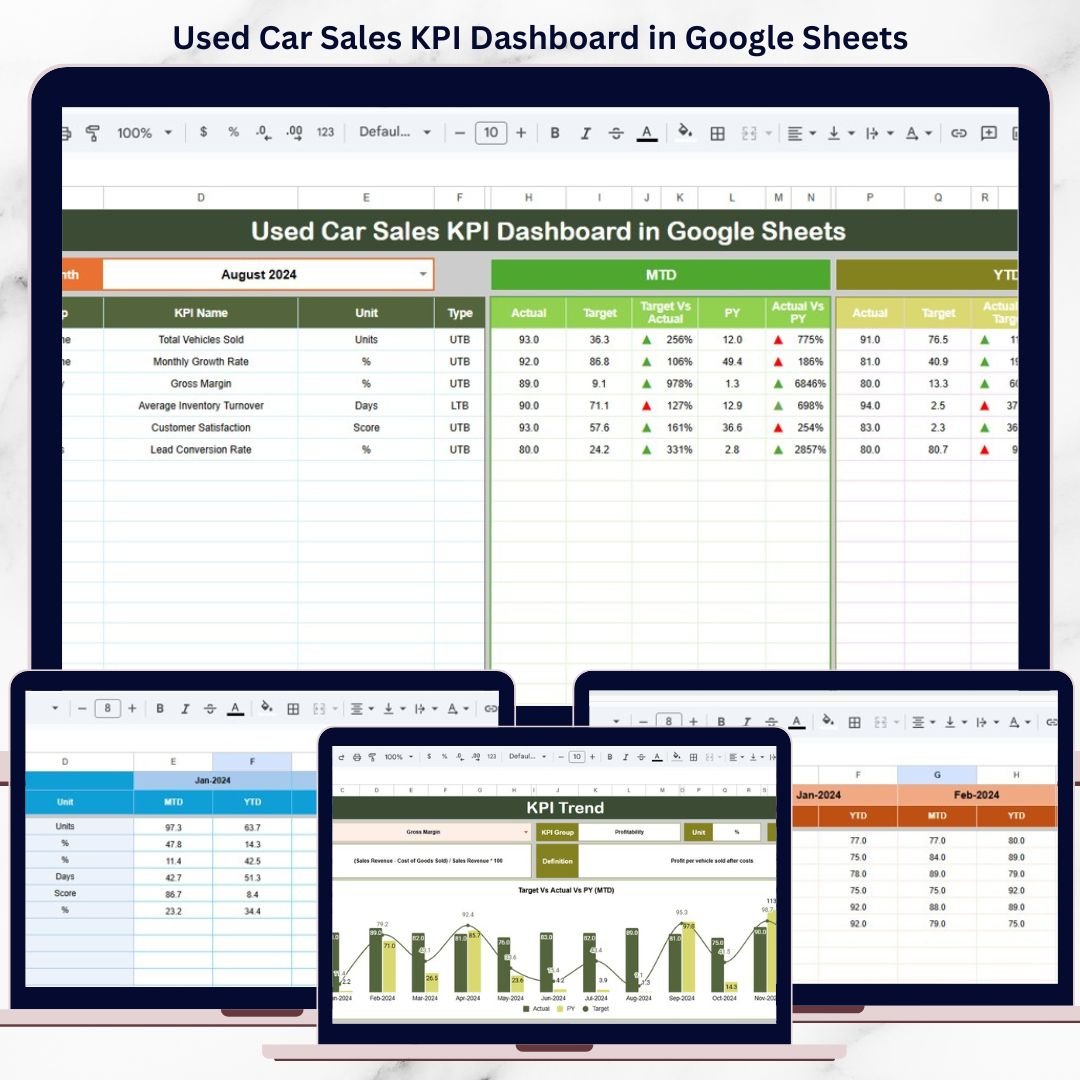
Best archetype: used car dealership owner, sales manager, or automotive analyst who needs industry-specific sales visibility. This is not a generic sales dashboard. It is aimed at dealership performance, where units sold, revenue, profit, inventory movement, conversion, and target achievement all matter.
Screenshot view: the product screens show a dashboard sheet with MTD and YTD KPI comparisons, a KPI trend sheet, actual number input, target sheet, previous-year sheet, and KPI definition sheet. That gives dealership teams a repeatable monthly review process.
- Track used car sales KPIs month-to-date and year-to-date.
- Compare target vs actual dealership performance.
- Review year-over-year movement for seasonality and demand.
- Use the KPI trend sheet for sales review meetings.
Price: $12.99. Get the Used Car Sales KPI Dashboard in Google Sheets.
8. After-Sales Service KPI Dashboard in Google Sheets – Best for Retention and Service Revenue
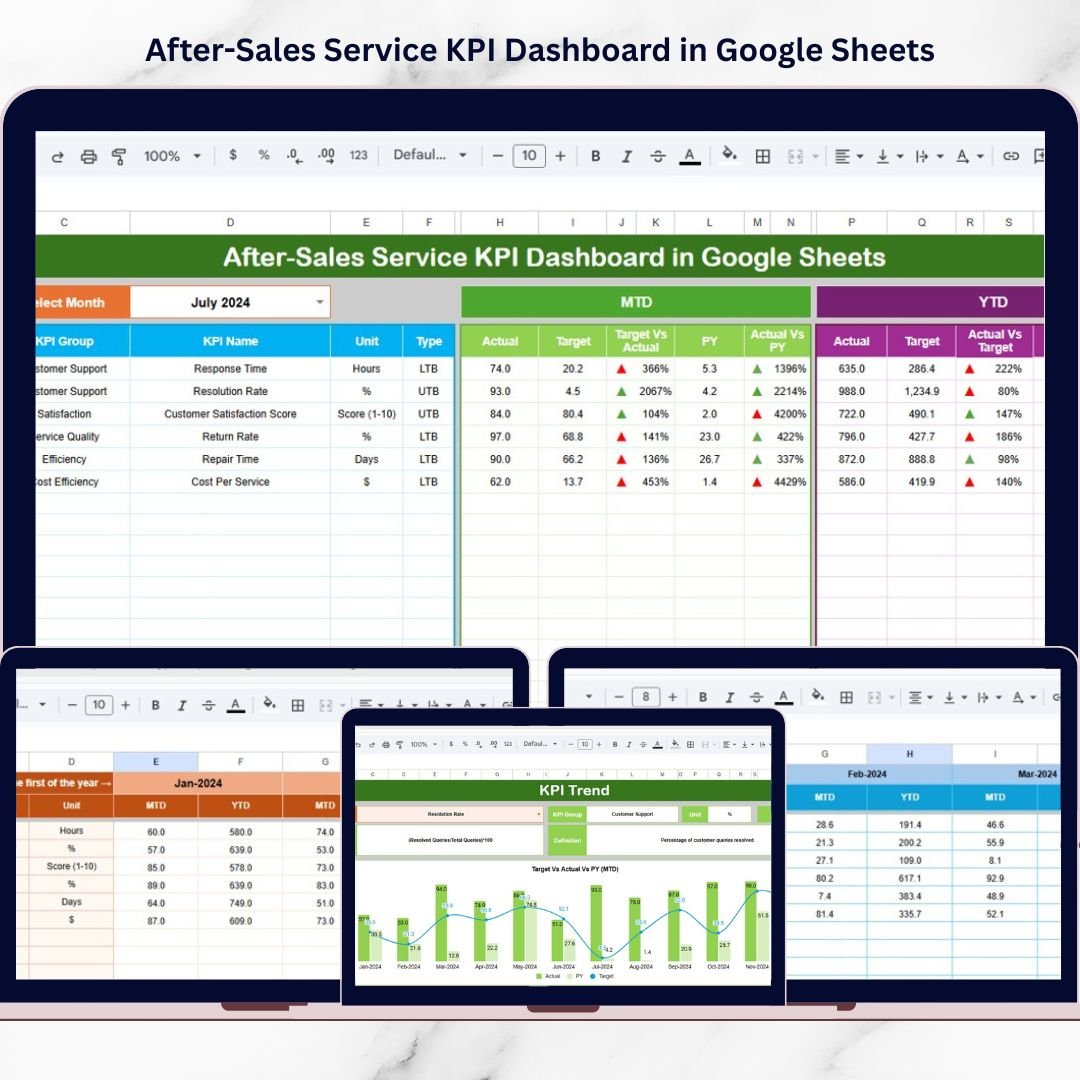
Best archetype: service leader, customer success manager, support supervisor, or sales leader responsible for renewals and repeat purchase experience. After-sales reporting belongs in a sales roundup because retention, response quality, resolution speed, and customer loyalty directly affect future revenue.
Screenshot view: the product screens show a KPI dashboard with MTD and YTD views, target vs actual comparison, previous-year benchmarking, KPI trends, actual input, target input, previous-year input, and KPI definitions. It is useful where service performance needs monthly visibility without a dedicated service analytics platform.
- Track response time, resolution rate, SLA performance, and service quality.
- Review customer support performance with sales and operations.
- Connect service gaps to churn, repeat sales, and account health.
- Maintain a shared Google Sheets scorecard for distributed teams.
Price: $9.99. Get the After-Sales Service KPI Dashboard in Google Sheets.
9. Sales Dashboard in Power BI – Best for Enterprise Sales Ops
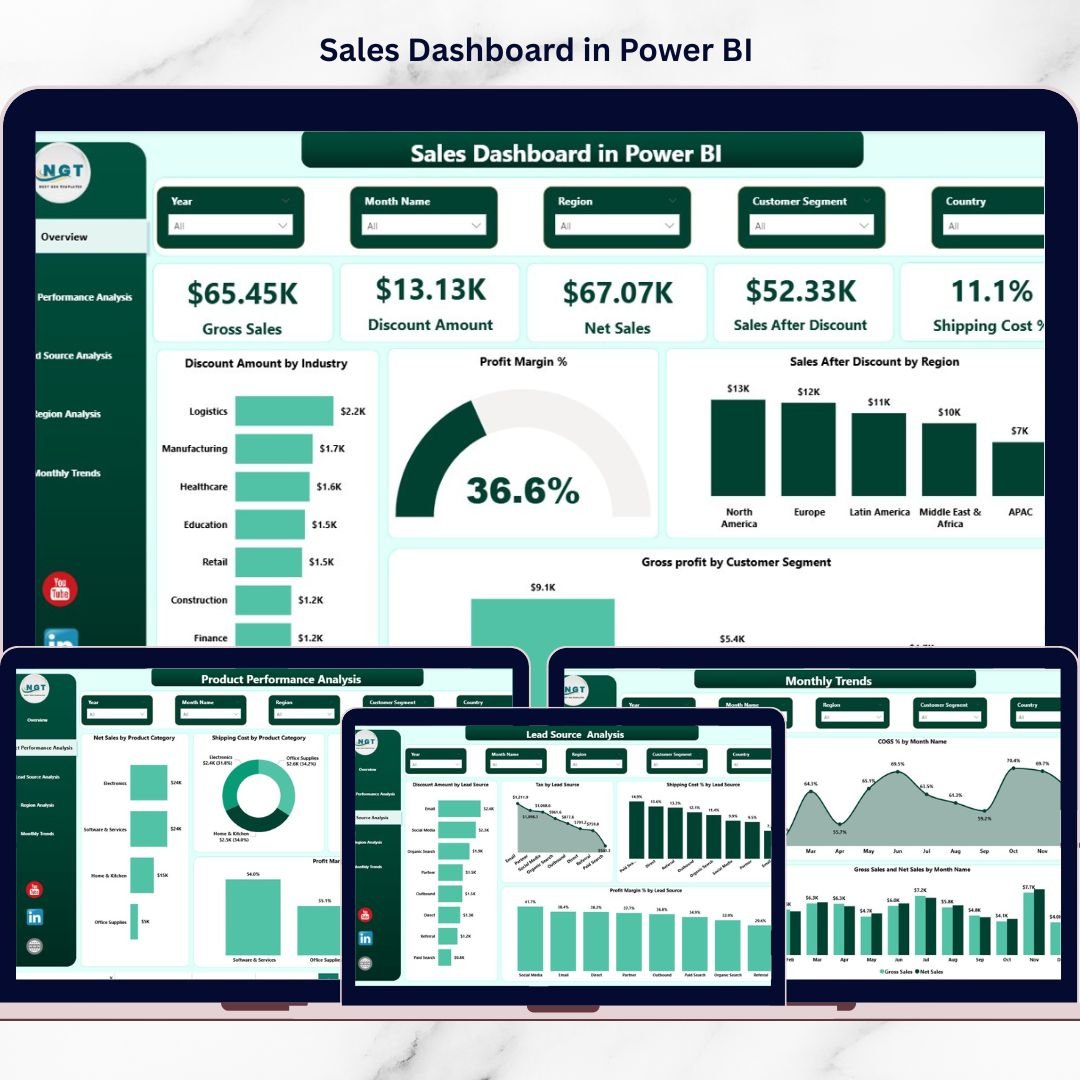
Best archetype: enterprise sales ops, business intelligence team, or sales leader who needs interactive Power BI reporting. This is the strongest pick when the team already uses Microsoft tools and wants a dashboard that can eventually connect to larger datasets, scheduled refreshes, and executive reporting workflows.
Screenshot view: the product screens show a five-page Power BI report covering overview, product performance, lead source, region analysis, and monthly trends. KPIs include gross sales, net sales, profit margin, discount impact, shipping cost, regional performance, and product profitability.
- Build executive sales reviews around Power BI visuals.
- Analyze discounts, shipping cost, and profit margin together.
- Filter sales by month, region, product category, industry, or source.
- Create a scalable BI reporting layer from sales data.
Price: $17.99. Get the Sales Dashboard in Power BI.
10. Channel Sales Dashboard in Power BI – Best for Enterprise Channel Sales Ops
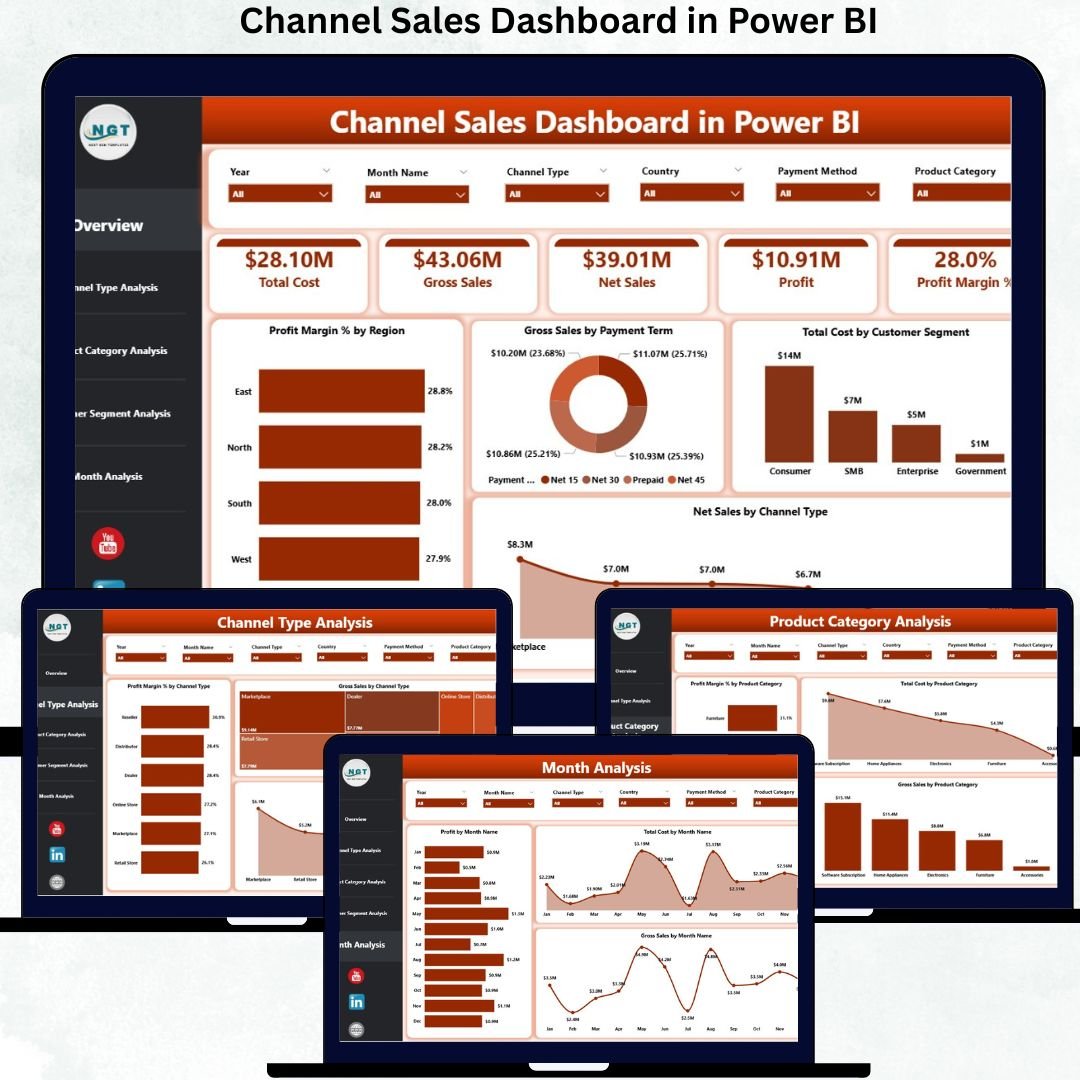
Best archetype: enterprise channel sales ops team managing distributors, resellers, direct sales, online channels, customer segments, and regional revenue. Choose this over the Excel version when the reporting needs are more interactive, the data is larger, and executives expect BI-style filtering.
Screenshot view: the product screens show five Power BI pages: overview, channel type analysis, product category analysis, customer segment analysis, and monthly trends. The focus is channel performance, profit margin, total cost, gross sales, net sales, customer segments, and channel strategy.
- Compare channel profitability across direct, reseller, distributor, and online sales.
- Review product category performance by sales channel.
- Analyze customer segment profitability and cost behavior.
- Prepare executive Power BI reports for commercial leadership.
Price: $17.99. Get the Channel Sales Dashboard in Power BI.
How to Choose Between Excel, Google Sheets, and Power BI
Choose the format based on workflow, not software fashion. The best sales dashboard template is the one your team will actually keep updated.
| Decision Factor | Choose Excel | Choose Google Sheets | Choose Power BI |
|---|---|---|---|
| Team size | Founder, finance owner, or small team | Shared mid-market team | Enterprise or analytics team |
| Collaboration style | File-based reporting | Real-time cloud editing | Published BI reports |
| Best workflow | CSV exports, margin review, simple refresh | Target tracking, team reviews, shared updates | Interactive filtering, larger datasets, executive reporting |
| Best template | Sales Dashboard For online Store in Excel | Sales Performance Management Dashboard in Google Sheets | Sales Dashboard in Power BI |
If you are a founder, start with Excel because it is the fastest route from raw export to decision. If you are a mid-market sales leader, Google Sheets is easier for shared target tracking. If you run enterprise sales ops, Power BI is the right format for interactive dashboards, slicers, drilldowns, and executive distribution.
Sales Dashboard FAQ
What is a sales dashboard Excel template?
A sales dashboard Excel template is a ready-made workbook that turns sales data into KPI cards, charts, tables, and trend reports. It helps teams track revenue, targets, margin, product performance, region performance, and sales trends without building a workbook from scratch.
Which sales dashboard template is best for an SMB founder?
The best SMB founder pick is the Sales Dashboard For online Store in Excel. It is low cost, easy to own, and built for founders who want sales, margin, product, source, region, and monthly trend reporting without another monthly SaaS bill.
Which sales KPI dashboard is best for a mid-market sales leader?
The Sales Performance Management Dashboard in Google Sheets is the best mid-market sales leader option because it supports target vs actual reviews, sales rep accountability, product analysis, region analysis, monthly trends, and shared access.
Which template is best for enterprise sales operations?
The Sales Dashboard in Power BI is the strongest enterprise sales ops choice for broad sales analytics. For indirect, reseller, distributor, or partner sales, the Channel Sales Dashboard in Power BI is the better fit.
Can these templates replace Salesforce dashboards?
They can replace basic manual reporting for small and mid-sized teams, but they do not replace Salesforce as a CRM. Use these templates when you need affordable KPI reporting, Excel or Google Sheets ownership, or Power BI visuals without a full CRM analytics rollout.
What KPIs should a sales dashboard track?
A good sales dashboard should track gross sales, net sales, target vs actual, variance, profit margin, discounts, sales by product, sales by region, lead source performance, funnel conversion, monthly trends, and rep-level performance when relevant.
Are these sales tracker templates one-time purchases?
Yes. The products in this roundup are paid NextGenTemplates templates with one-time prices listed in the comparison table. Prices range from $6.99 to $17.99 based on the product and format.
Can I customize these templates?
Yes. Excel and Google Sheets templates can usually be customized by editing fields, formulas, colors, charts, and input sheets. Power BI templates can be customized in Power BI Desktop if you are comfortable with report design, data models, and measures.
Which template is best for sales funnel tracking?
The Sales Funnel KPI Dashboard in Google Sheets is the best funnel-specific template because it focuses on pipeline KPIs, target comparison, previous-year benchmarks, KPI trends, and shared Google Sheets reporting.
Should I choose the Excel or Power BI channel sales dashboard?
Choose the Channel Sales Dashboard in Excel if your team works from spreadsheets and needs a simple owned file. Choose the Channel Sales Dashboard in Power BI if you need interactive filtering, executive BI visuals, or larger data analysis.
Closing CTA
Sales reporting gets expensive when every dashboard becomes a subscription, and it gets messy when every manager builds their own spreadsheet. These 10 templates give you a middle path: professional reporting, one-time pricing, and the right format for the way your sales team actually works.
Built by PK – Microsoft Certified Professional with 15+ years of Excel, Google Sheets, and Power BI experience. Founder of NextGenTemplates, reaching 300K+ subscribers across YouTube channels. Every template is hand-built and tested before release.
For step-by-step video tutorials, visit the NextGenTemplates YouTube channel.