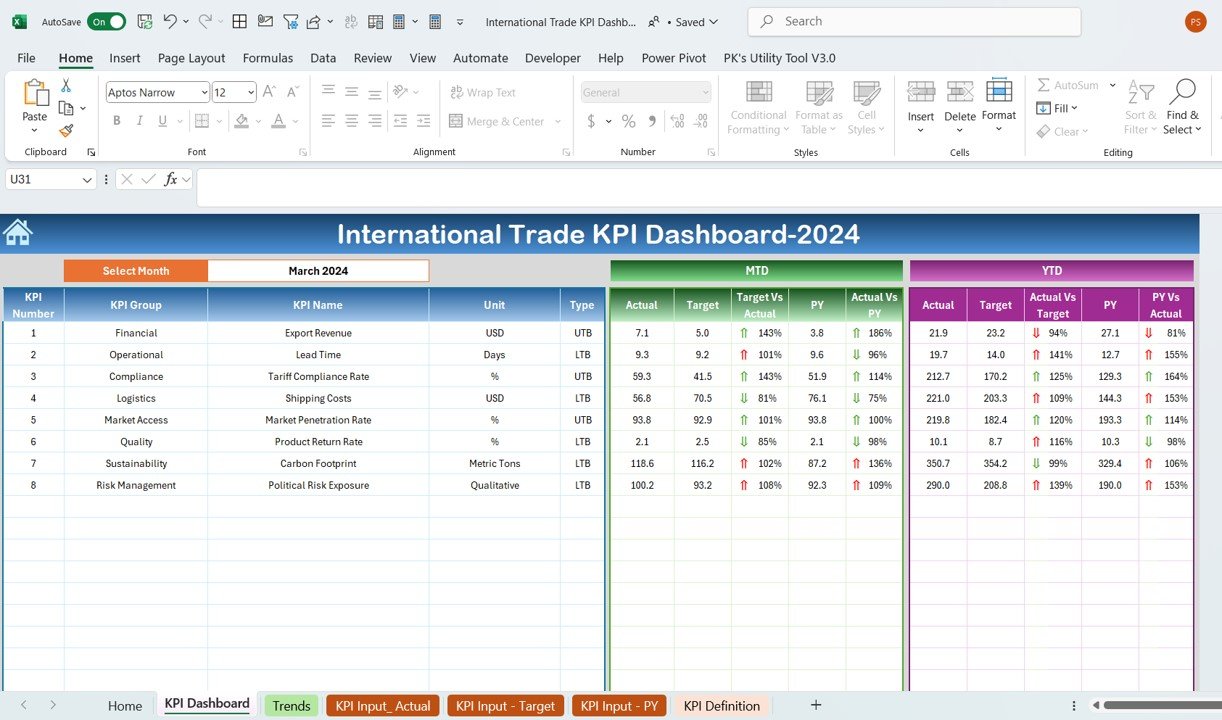


The International Trade KPI Dashboard in Excel is a powerful tool designed to help businesses and trade managers monitor, analyze, and optimize their international trade activities. Whether you’re importing, exporting, or involved in global supply chain operations, this Excel-based dashboard helps track key performance indicators (KPIs) that are essential for effective international trade management.
From monitoring trade volumes to tracking tariff costs and managing foreign exchange rates, this dashboard provides real-time insights into your international trade performance. It’s an ideal tool for improving decision-making, enhancing trade compliance, and identifying opportunities to increase efficiency in global trade operations.
Key Features of the International Trade KPI Dashboard in Excel
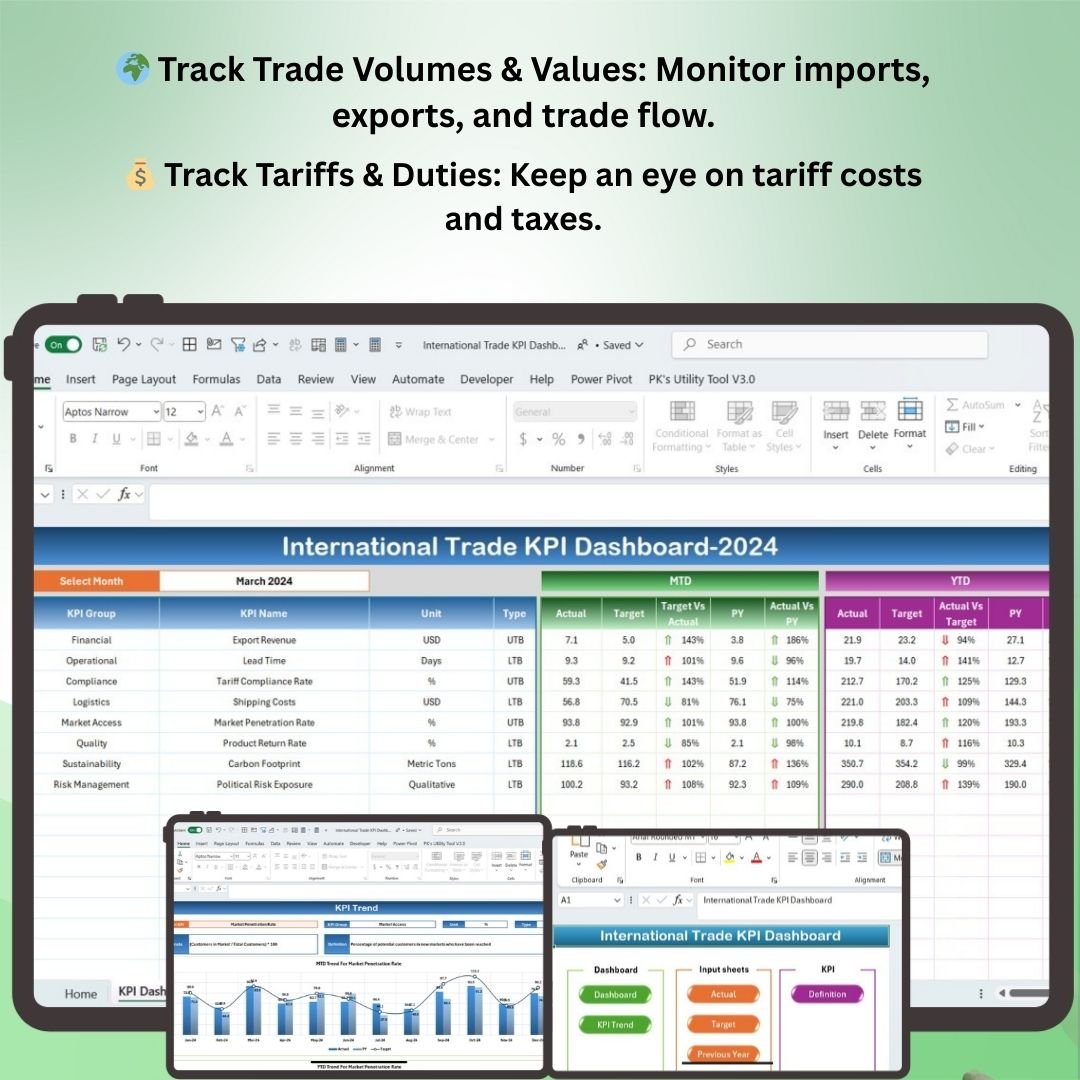
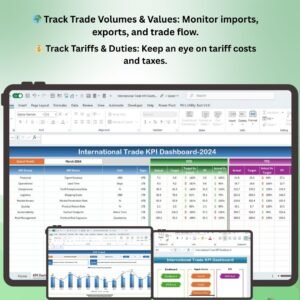
🌍 Track Trade Volumes & Values
Monitor the volume and value of your international trade activities, including imports, exports, and shipments, helping you assess the flow of goods across borders and ensure compliance with trade agreements.
💰 Monitor Tariffs & Duties
Track the costs of tariffs, duties, and taxes imposed on goods, helping you manage and optimize trade costs effectively and avoid unexpected fees.
📈 Track Foreign Exchange Rates
Track currency fluctuations and exchange rates that impact international trade transactions. Make informed decisions by monitoring forex market trends.
📊 Trade Performance Metrics
Analyze key trade metrics such as trade balance, export/import ratio, and growth in trade volume. Visualize trends over time to assess the effectiveness of your international trade strategies.
📝 Document & Compliance Tracking
Track trade documents, including bills of lading, invoices, and certificates of origin. Ensure compliance with international trade regulations and minimize the risk of penalties.
🖥️ Customizable & Interactive Dashboard
This Excel dashboard is interactive and customizable to meet your specific international trade needs. Use filters and charts to drill down into the data and gain actionable insights.
Why You’ll Love the International Trade KPI Dashboard in Excel
✅ Streamline International Trade Management
Monitor key trade metrics in one centralized dashboard, making it easier to track international trade performance, manage costs, and optimize your operations.
✅ Optimize Trade Costs & Tariffs
By tracking tariffs and duties, you can make better decisions on cost optimization and avoid unnecessary charges in your global trade operations.
✅ Make Data-Driven Decisions
Get real-time insights into trade volumes, foreign exchange rates, and performance metrics to guide your decision-making and trade strategies.
✅ Improve Trade Compliance
Ensure your international trade processes are compliant with global regulations by tracking required documents and certifications.
✅ Fully Customizable & Scalable
Customize the dashboard to fit your organization’s unique trade activities. Whether you’re managing imports, exports, or both, this dashboard scales to meet your needs.
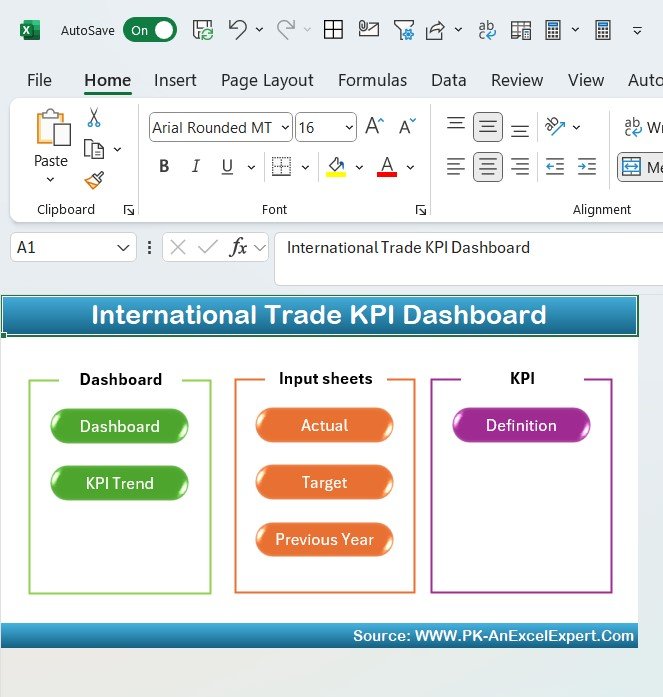
What’s Inside the International Trade KPI Dashboard Template in Excel?
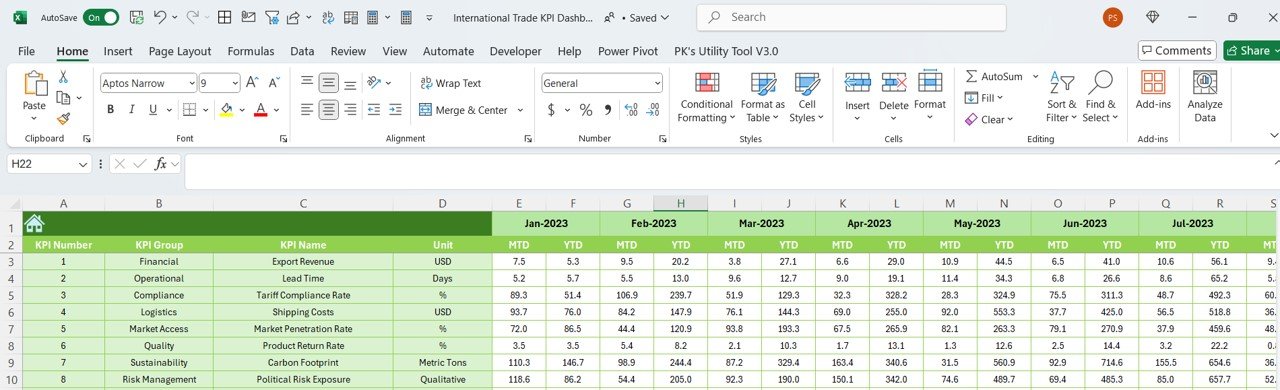
- Trade Volumes & Values Tracking: Track imports, exports, and overall trade volume and values.
- Tariff & Duty Tracking: Monitor tariff costs and taxes associated with international trade transactions.
- Foreign Exchange Rate Monitoring: Track and analyze currency exchange rate fluctuations.
- Trade Performance Metrics: Analyze trade balance, export/import ratios, and trends.
- Document & Compliance Tracking: Keep track of essential trade documents and ensure compliance with regulations.
- Interactive & Customizable Charts: Visualize data with interactive charts and graphs to gain deeper insights into your trade operations.
How to Use the International Trade KPI Dashboard in Excel
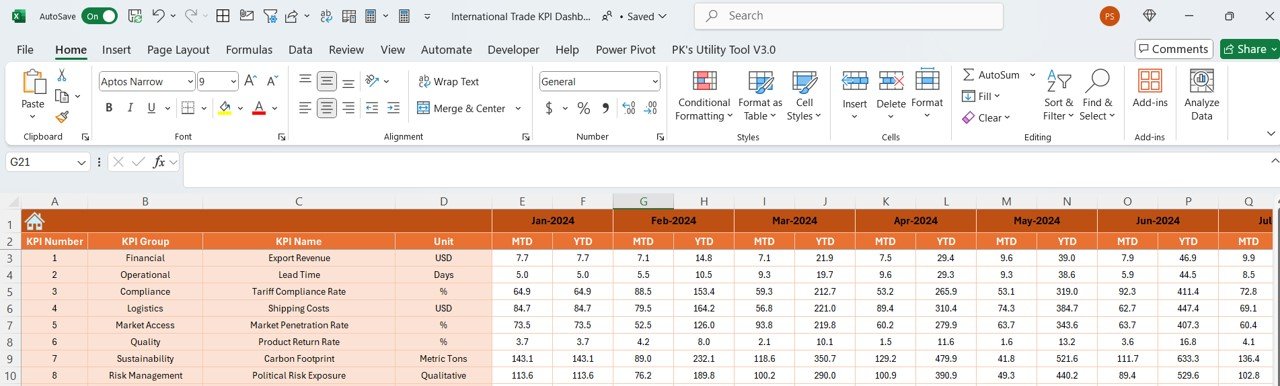
1️⃣ Download the Template: Get immediate access to the International Trade KPI Dashboard in Excel.
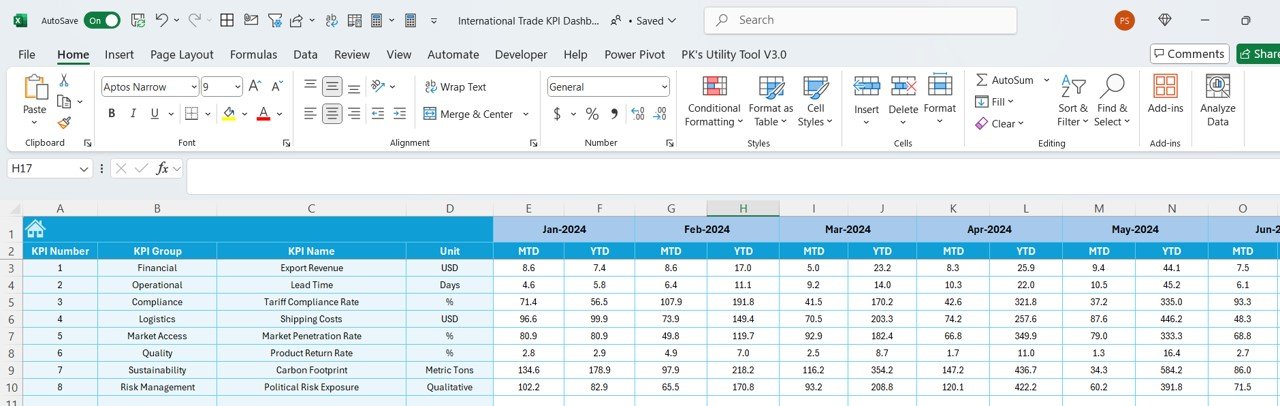
2️⃣ Input Your Trade Data: Enter trade volumes, values, tariffs, exchange rates, and document details into the dashboard.
3️⃣ Monitor & Track KPIs: Use the dashboard to track important KPIs, including trade volumes, tariffs, exchange rates, and performance metrics.
4️⃣ Analyze Trends & Optimize Strategies: Use the data and visual insights to optimize your trade strategies, reduce costs, and enhance trade performance.
5️⃣ Ensure Compliance: Track trade documents and ensure your business adheres to international trade regulations and requirements.
Who Can Benefit from the International Trade KPI Dashboard in Excel?
🔹 Trade Managers & International Business Managers
🔹 Exporters & Importers
🔹 Logistics & Supply Chain Managers
🔹 Financial Analysts & Trade Analysts
🔹 Customs & Compliance Teams
🔹 Businesses Involved in Global Trade Operations
Stay ahead in the global market by effectively managing your international trade activities with the International Trade KPI Dashboard in Excel. Track, analyze, and optimize your trade performance for improved operational efficiency and reduced trade costs.
Click here to read the Detailed blog post
Visit our YouTube channel to learn step-by-step video tutorials
Youtube.com/@PKAnExcelExpert


Reviews
There are no reviews yet.