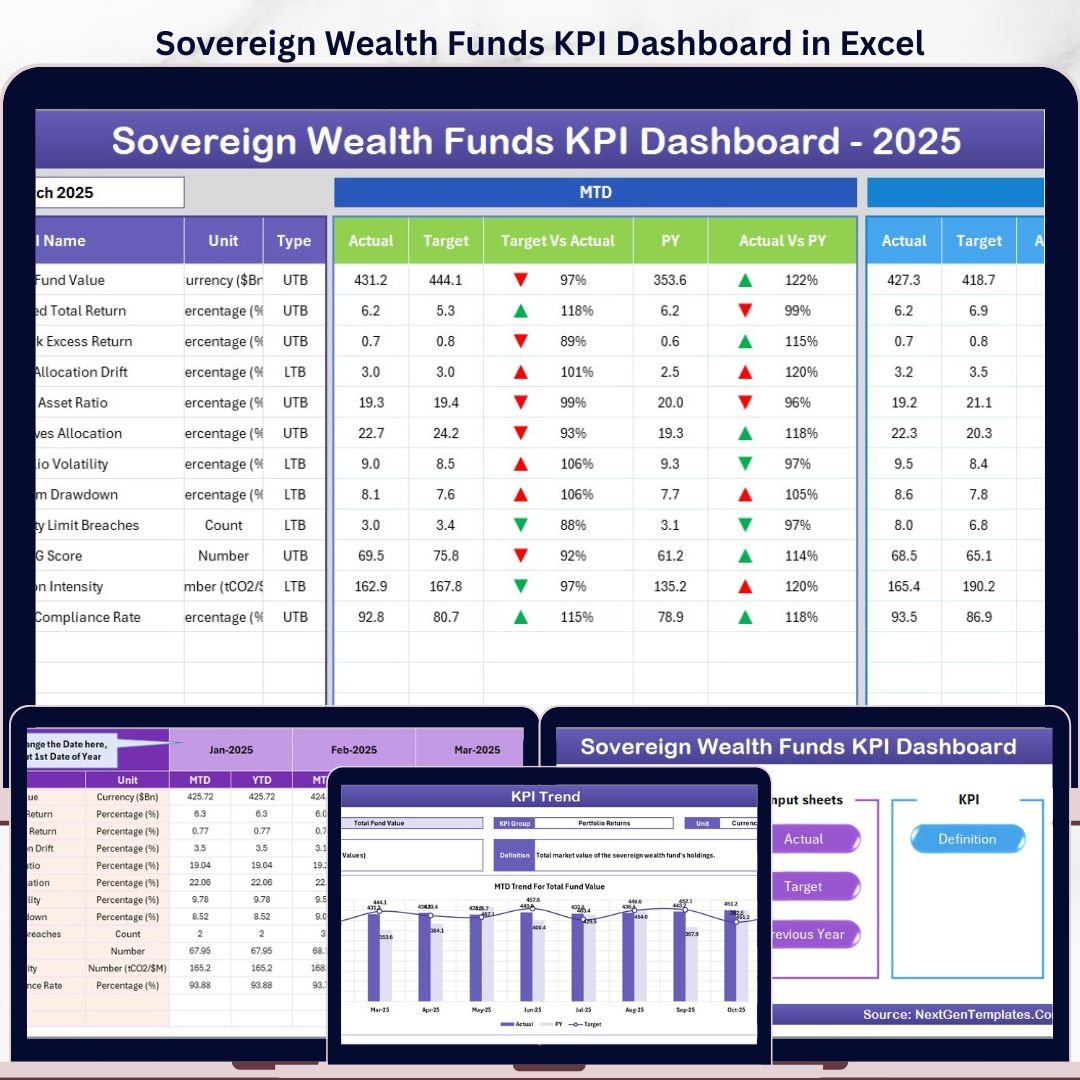


The Sovereign Wealth Funds KPI Dashboard in Excel tracks every KPI you define across 7 connected worksheets, with built-in MTD and YTD calculations, Target vs Actual variance, Previous Year comparison, and conditional-formatting arrows that flip green or red automatically. Setup takes under 10 minutes — just input your KPI names, monthly actuals, targets, and previous-year numbers, then pick any month from the dropdown to refresh the entire dashboard.
🌍 Join 8,400+ teams in 40+ countries using NextGenTemplates to replace paid SaaS analytics tools with one-time-purchase Excel, Google Sheets, Power BI, and HTML templates.
✅ Instant download · One-time payment · No subscription · No per-user fees · Lifetime access
🔑 Key Features of the Sovereign Wealth Funds KPI Dashboard in Excel
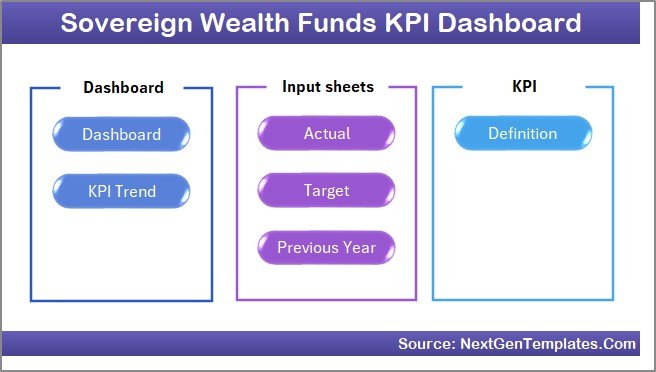
📊 7 fully linked worksheets — a Home navigation sheet, an interactive Dashboard, a KPI Trend page, three input sheets (Actual, Target, Previous Year), and a KPI Definition master sheet. Every page connects through formulas, so updating input cells refreshes the dashboard automatically.
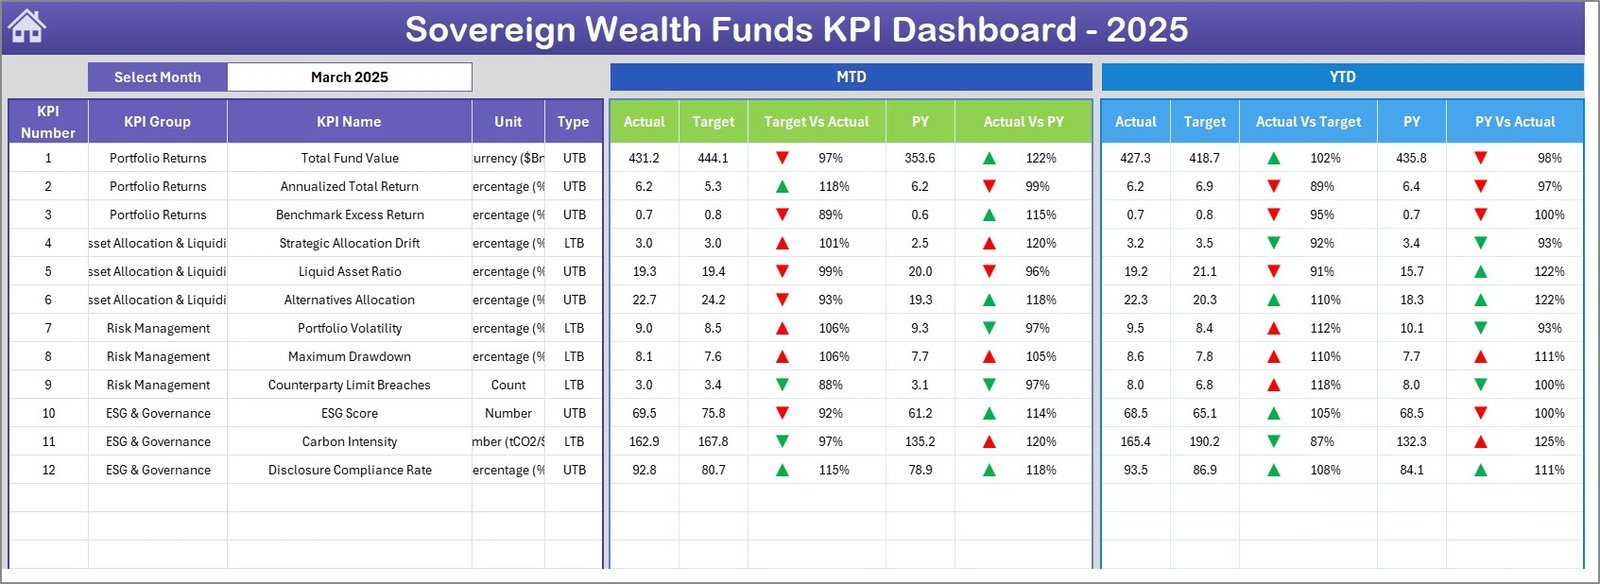
📅 Dynamic month selector on cell D3 of the Dashboard tab — pick any month and every MTD figure, YTD calculation, variance percentage, and trend chart updates in a single click without any macros.
🎯 Three-way performance comparison — every KPI is shown side-by-side against its monthly Target, the Previous Year actual, and the current Actual, with green-up and red-down arrows generated by Excel conditional formatting based on the KPI type (LTB or UTB).
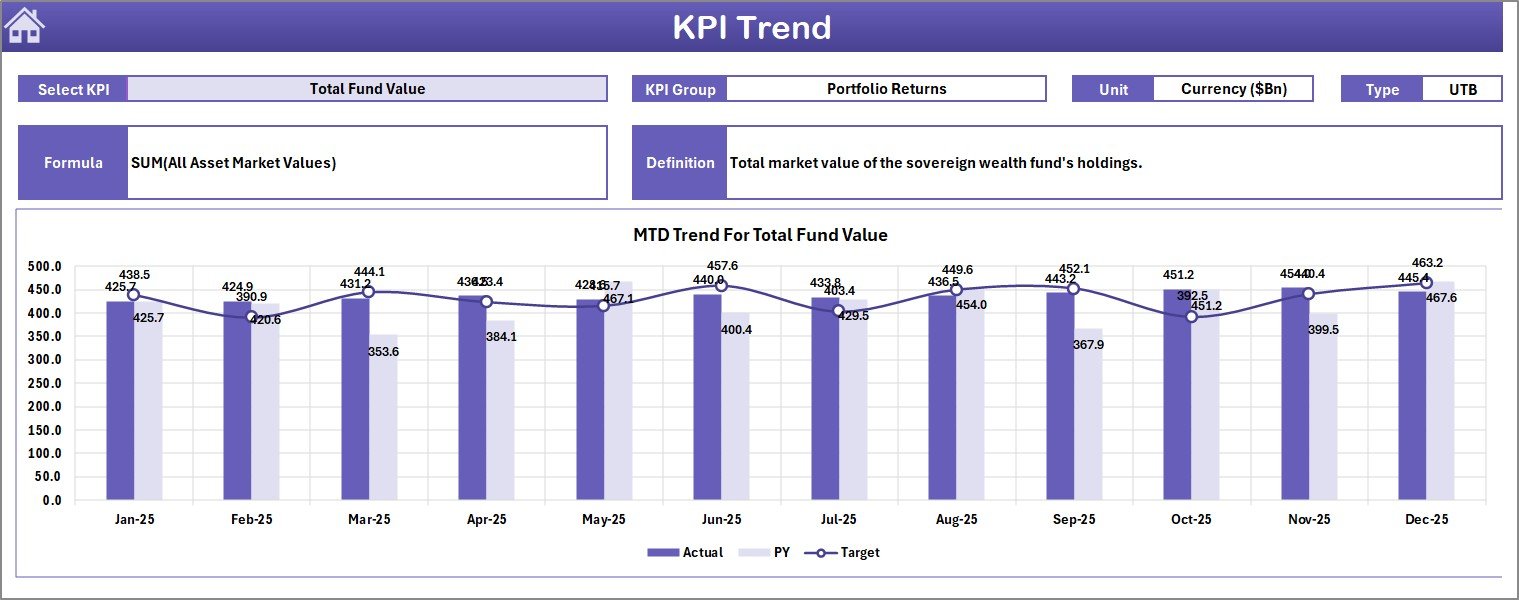
📈 KPI Trend page with isolated drill-down — select any KPI from the dropdown on cell C3 and the page displays its definition, group, unit, formula, type, plus MTD and YTD trend charts comparing Actual, Target, and Previous Year across the full fiscal year.
🔁 Auto-rolling fiscal year — enter the first month of your fiscal year on cell E1 of the Actual Input sheet and the entire dashboard re-anchors to that calendar. Works for January-start, April-start, July-start, or any custom fiscal year used by sovereign wealth funds globally.
🧠 LTB / UTB intelligence — the KPI Definition sheet lets you mark each KPI as “Lower the Better” (e.g., Tracking Error, Expense Ratio) or “Upper the Better” (e.g., Annual Return %, Sharpe Ratio). Variance arrows and conditional formatting flip direction automatically, so a lower number on an LTB KPI shows green.
📦 What’s Inside the Sovereign Wealth Funds KPI Dashboard in Excel
Page 1: Home Sheet
The index page with 6 large navigation buttons that jump to each respective worksheet (Dashboard, KPI Trend, Actual Numbers Input, Target Numbers Input, Previous Year Numbers, KPI Definition). One-click navigation keeps the workbook usable for fund analysts and senior leadership alike.
Page 2: Dashboard Sheet
The main dashboard. Select the month from the dropdown on cell D3 and every KPI row recalculates. The MTD block shows Actual, Target, Previous Year, Target vs Actual variance %, and PY vs Actual variance %, each with up/down arrow conditional formatting. The YTD block mirrors the same six columns, giving you a complete monthly-and-cumulative view of fund performance in one screen.

Page 3: KPI Trend Sheet
Select any KPI from the dropdown on cell C3. The page displays its KPI Group, Unit, Type (LTB or UTB), Formula, and Definition pulled from the master KPI Definition sheet. Below, two trend charts plot the MTD and YTD evolution of Actual, Target, and Previous Year across all 12 months of the fiscal year.
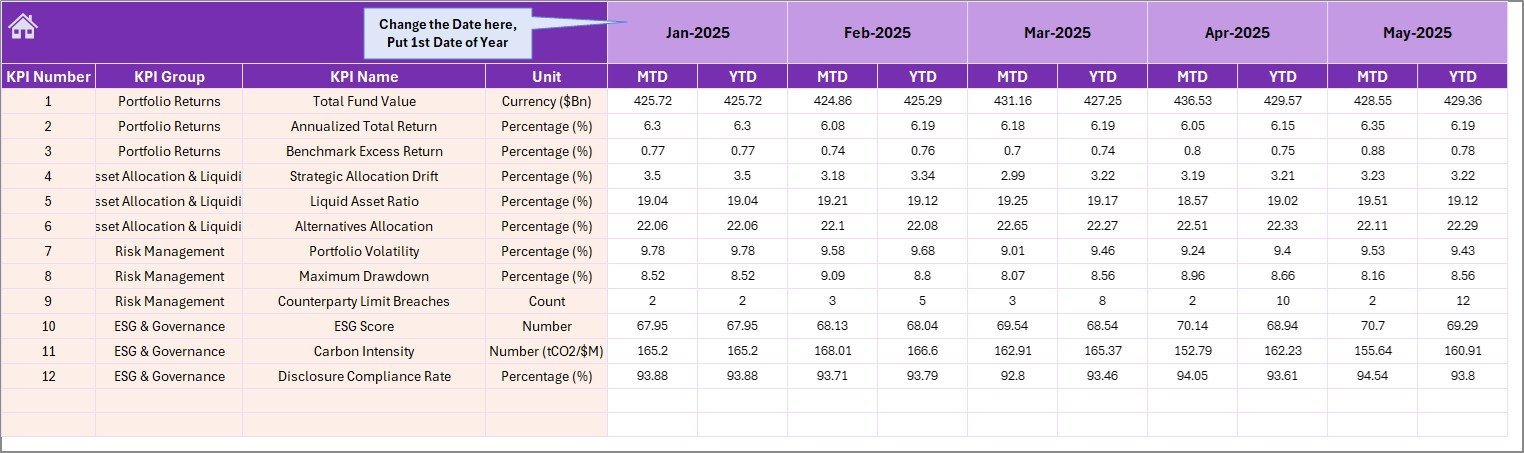
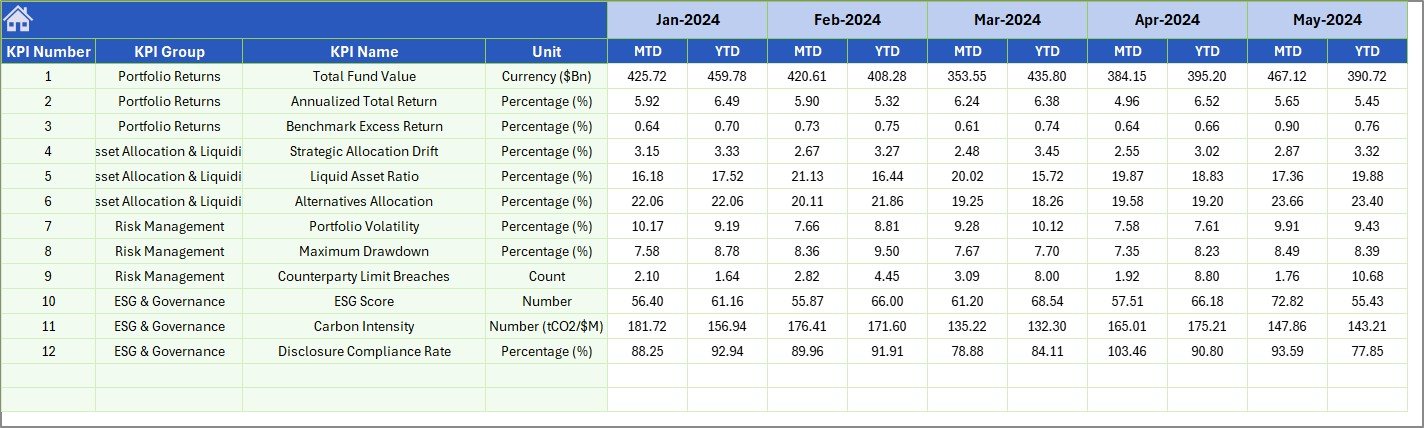
Page 4: Actual Numbers Input Sheet
Enter your MTD and YTD actuals for each KPI here. Change the first month of the fiscal year on cell E1 and the column headers re-label themselves automatically. The dashboard reads directly from this sheet, so a typo here is the only thing that can break a number.

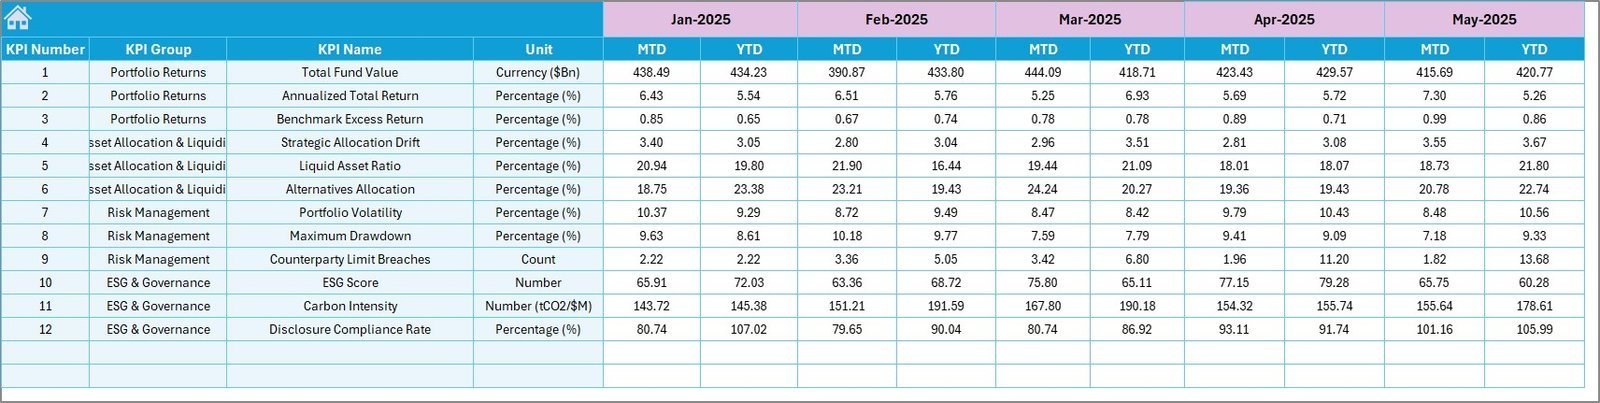
Page 5: Target Numbers Input Sheet
Enter the monthly MTD targets and cumulative YTD targets for every KPI. These targets feed the Target vs Actual variance columns on the Dashboard and the target line on the KPI Trend charts.

Page 6: Previous Year Numbers Sheet
Same layout as the Actual sheet — enter prior fiscal year MTD and YTD figures for every KPI. These numbers power the PY vs Actual variance arrows and the Previous Year line on every trend chart.
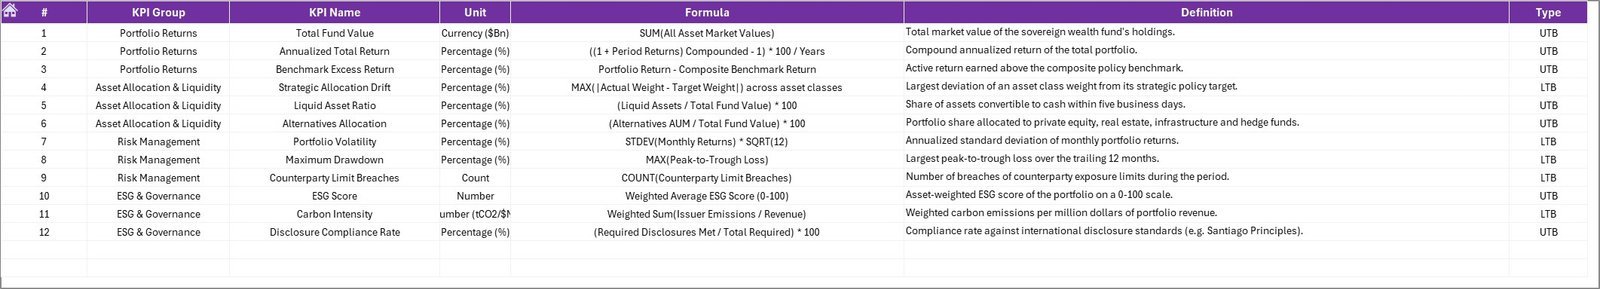
Page 7: KPI Definition Sheet
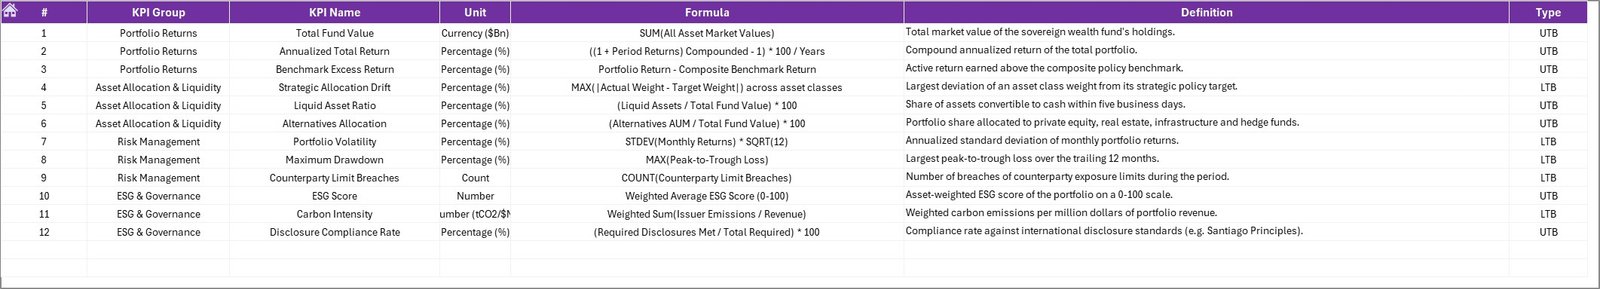
The master configuration sheet. Enter the KPI Name, KPI Group (e.g., Return, Risk, Liquidity, ESG), Unit (%, USD, ratio), Formula, KPI Definition, and KPI Type (LTB or UTB). Every other sheet looks up information from here, so renaming or reordering KPIs only needs to happen on this one sheet.
📊 Sovereign Wealth Funds KPI Dashboard in Excel vs. Google Sheets Equivalent vs. Paid Fund Analytics SaaS — Where This Fits
| Feature | Sovereign Wealth Funds KPI Dashboard in Excel | Google Sheets equivalent | Paid SaaS (Addepar / Allvue / eFront) |
|---|---|---|---|
| Cost | $14.99 one-time | $0 (build it yourself) | $30,000-200,000+ / year |
| Platform | Microsoft Excel (desktop, web, mobile) | Google Sheets (browser only) | Web-based, vendor-hosted |
| Setup time | Under 10 minutes | 20-40 hours to build | 3-6 months implementation |
| MTD / YTD pre-built | ✅ | ❌ (manual formulas) | ✅ |
| Target vs Actual variance arrows | ✅ | ❌ | ✅ |
| LTB / UTB logic per KPI | ✅ | ❌ | ✅ |
| Works offline | ✅ | ❌ | ❌ |
| Year-1 cost at 5 users | $14.99 | $0 + 30+ hours of analyst time | $30,000-200,000+ |
| Customizable KPI list | ✅ (any number of KPIs) | ✅ | Limited to vendor schema |
For sovereign wealth fund teams, family offices, and investment analysts who want institutional-grade KPI reporting without paying six figures a year, the Sovereign Wealth Funds KPI Dashboard in Excel sits in the sweet spot.
👥 Who This Template Is For — and Who It’s Not For
✅ This template is built for:
- Sovereign wealth fund analysts producing monthly board reports on return, risk, and allocation KPIs
- Pension fund and endowment teams tracking 10-30 KPIs across multi-asset portfolios
- Family offices and private wealth advisors that need a defensible MTD/YTD reporting cadence without paying for Addepar or Allvue
- Finance and FP&A teams in asset management firms preparing investment committee packs
- Independent CFAs and fund consultants building white-label reports for clients
❌ This template is NOT for:
- Funds requiring real-time market data feeds (Bloomberg / Refinitiv integration) — this template is input-driven, not API-connected
- Teams that need full-blown portfolio accounting, NAV calculation, or regulatory filings — those workflows need a dedicated platform
- Multi-currency NAV reporting at the holding level — currency translation is not built in
⚙️ How to Use the Sovereign Wealth Funds KPI Dashboard in Excel
- Open the file in Microsoft Excel (desktop preferred for full chart fidelity).
- Go to the KPI Definition sheet and enter each KPI Name, Group, Unit, Formula, Definition, and Type (LTB or UTB).
- On the Actual Numbers Input sheet, set the fiscal year start month on cell E1, then enter MTD and YTD actuals for each KPI.
- Enter targets in the Target Numbers Input sheet and prior-year figures in the Previous Year Numbers sheet.
- Open the Dashboard sheet and pick any month from the dropdown on D3 — every variance, arrow, and trend chart updates instantly.
- Use the KPI Trend sheet to deep-dive any single KPI’s monthly evolution.
💼 Real-World Use Cases
Aisha leads investment performance reporting at a $40 billion sovereign wealth fund in the Gulf region. She uses the Sovereign Wealth Funds KPI Dashboard in Excel to consolidate 18 KPIs — Annual Return %, Volatility %, Sharpe Ratio, Allocation Drift, Liquidity Ratio, ESG Score — into one monthly investment-committee pack, replacing a 14-tab manual workbook that used to take her three days every month.
Marco runs a single-family office overseeing €800M for a European industrial family. He uses the dashboard to track 12 portfolio KPIs against family-defined targets and to show the family principals exactly how MTD performance compares to prior year — without paying €60,000 per year for an enterprise reporting platform.
Priya consults for three mid-sized pension funds in Asia. She white-labels the template for each client, drops in their KPI list and previous-year actuals, and delivers a board-ready monthly report in under an hour — turning what used to be a three-week consulting engagement into a same-day deliverable.
❓ Frequently Asked Questions
What KPIs does the Sovereign Wealth Funds KPI Dashboard in Excel track?
The Sovereign Wealth Funds KPI Dashboard in Excel tracks any KPIs you define on the KPI Definition sheet. Common configurations include Annual Return %, Volatility %, Sharpe Ratio, Tracking Error, Allocation Drift, Liquidity Ratio, ESG Score, Cost-to-Income Ratio, and Asset Allocation %. Each KPI can be marked LTB or UTB, so variance arrows flip the correct color automatically.
How long does setup take?
For a 10-15 KPI configuration, full setup takes under 10 minutes — enter your KPI list, monthly actuals, targets, and previous-year numbers, then pick any month from the Dashboard dropdown. No formulas need to be edited, no macros need to be enabled.
How does this compare to Addepar or Allvue?
Addepar and Allvue are enterprise platforms running $30,000-200,000+ per year with API feeds, portfolio accounting, and consolidated NAV. The Sovereign Wealth Funds KPI Dashboard in Excel is a one-time $14.99 KPI-monitoring layer — it does not replace those platforms, but it gives smaller funds and family offices institutional-grade MTD/YTD KPI reporting without the annual cost.
Does the dashboard handle non-calendar fiscal years?
Yes. Enter the first month of your fiscal year on cell E1 of the Actual Numbers Input sheet and the dashboard re-anchors automatically. Works for January-start, April-start (UK), July-start (Australia), or any custom fiscal year.
Can I add more KPIs after the initial setup?
Yes. Add new rows to the KPI Definition sheet, then add matching rows to the Actual, Target, and Previous Year input sheets. The Dashboard and KPI Trend pages pick up new KPIs automatically without any formula editing.
Are macros required?
No. The Sovereign Wealth Funds KPI Dashboard in Excel uses only standard Excel formulas, named ranges, data validation dropdowns, conditional formatting, and chart links. There are no VBA macros, so the file opens cleanly with macros disabled.
Can I share this with my investment committee?
Yes. Save the file as PDF or share the workbook via OneDrive / SharePoint. For board distribution, hide the input sheets and share only the Home, Dashboard, and KPI Trend tabs.
👤 About the Author
Built by PK — Microsoft Certified Professional with 15+ years of Excel, Google Sheets, and Power BI experience. Founder of NextGenTemplates, reaching 300K+ subscribers across YouTube channels (@PK-AnExcelExpert, @NextGenTemplates, @NeoTechNavigators). Every template is hand-built and tested before release.
🔗 Explore Related Templates
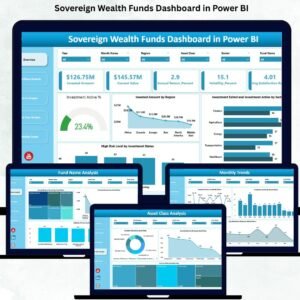
- Sovereign Wealth Funds Dashboard in Excel — the multi-page analytical version covering Fund Name, Sector, Asset Class, and Region breakdowns (great companion to this KPI tracker).
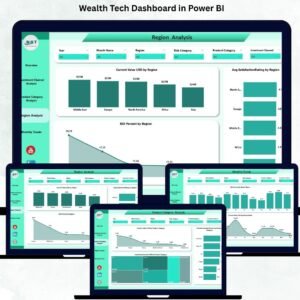
- Wealth Tech Dashboard in Excel — investment channel and product-category analytics for WealthTech platforms and advisors.
- Investor Services Dashboard in Excel — operational KPI tracking for fund administration and investor services teams.
- Also available as: Sovereign Wealth Funds Dashboard in Power BI for teams standardized on Microsoft’s BI stack.
- Browse all Excel KPI Dashboards or the broader Financial Tools library.
📖 Click here to read the Detailed Blog Post
🎥 Visit our YouTube channel for step-by-step video tutorials
👉 YouTube.com/@NextGenTemplates


Reviews
There are no reviews yet.