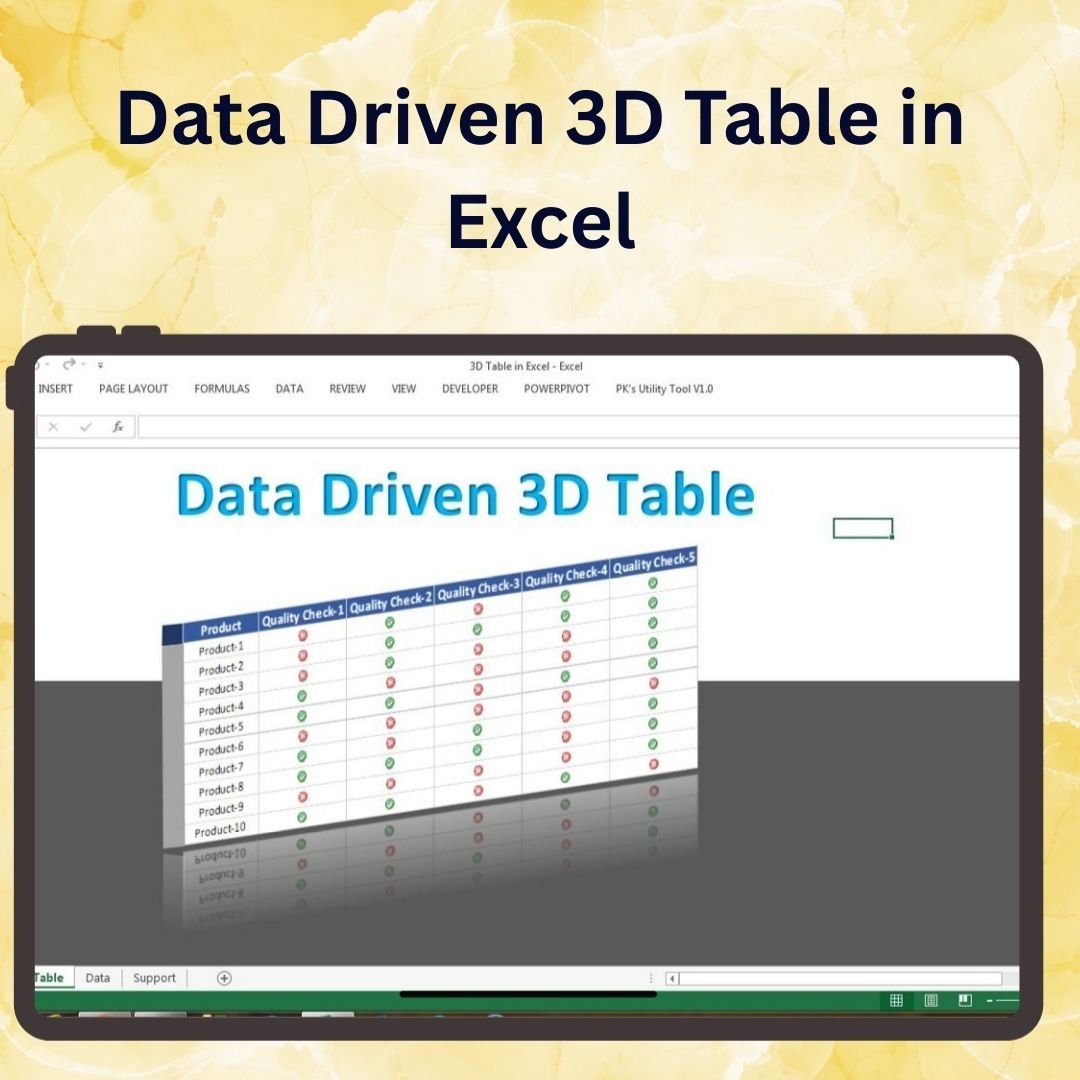
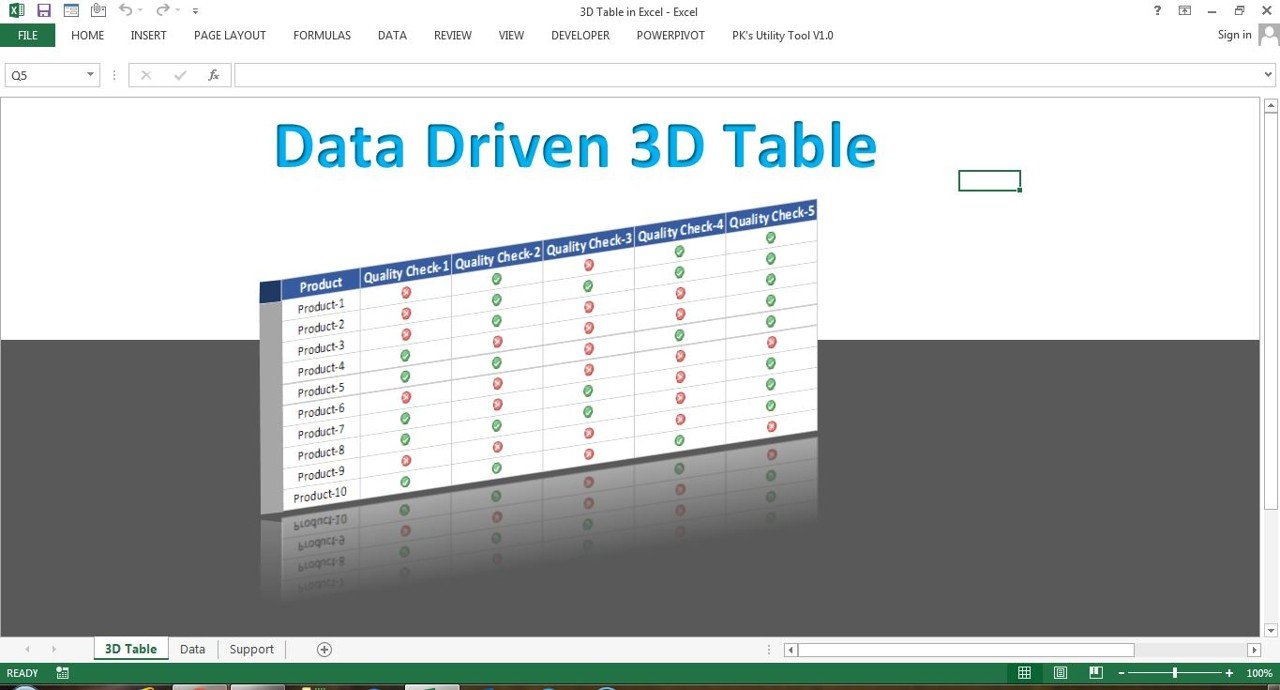
The Data-Driven 3D Table in Excel is an innovative and powerful tool designed to help you visualize and analyze complex data in a dynamic 3D format. This Excel template takes your traditional 2D tables and transforms them into engaging, interactive 3D visualizations that make it easier to interpret and present data. Whether you are analyzing financial data, sales performance, or project metrics, this template allows you to create an immersive data presentation that helps you and your team quickly identify trends, outliers, and key insights.
With the Data-Driven 3D Table, you can turn static data into an interactive and visually appealing dashboard that supports decision-making and enhances data analysis. Customize the table to suit your specific needs, and watch as the data automatically updates and adjusts based on the inputs. Ideal for business analysts, financial professionals, and project managers, this tool will take your data presentation skills to the next level.
Key Features of the Data-Driven 3D Table in Excel
📊 Transform Data into 3D Visuals
Convert your raw data into 3D tables that are easy to read and visually engaging. View relationships between data points in three dimensions for better analysis and decision-making.
🔄 Interactive & Dynamic Display
The table automatically updates as you input or change data, ensuring real-time reflection of your analysis. Interactive features such as slicers allow you to filter data and view it from multiple angles.
📉 Advanced Data Analysis Tools
Use the built-in data analysis tools to uncover trends, correlations, and patterns in your data. The 3D table offers an immersive way to interpret data beyond traditional 2D tables.
📈 Customizable Dashboard
Easily customize the 3D table to meet your specific needs. Adjust the colors, data fields, and layout to suit your business objectives and make the dashboard unique to your analysis.
🖥️ Easy to Use & Fully Compatible
No advanced Excel skills required. Simply input your data, and the table will generate dynamic 3D visualizations that you can adjust and refine as needed.
Why You’ll Love the Data-Driven 3D Table in Excel
✅ Make Data More Engaging & Understandable
Transform complex data into engaging 3D visuals that make it easier for anyone to understand. Present data in a more interactive and dynamic format.
✅ Save Time with Real-Time Data Updates
Changes to the data automatically update the 3D table, eliminating the need for manual adjustments or reformatting.
✅ Optimize Decision-Making
Visualize trends, outliers, and key insights that can help inform business decisions. Quickly identify data patterns that would otherwise be missed in 2D tables.
✅ Enhance Reporting & Presentations
Impress your audience with dynamic, professional-quality data presentations that go beyond traditional tables and charts.
✅ Fully Customizable to Your Needs
Customize the table to suit your specific data analysis needs. Whether you’re tracking financials, performance metrics, or project progress, this 3D table adapts to your requirements.
What’s Inside the Data-Driven 3D Table in Excel?
- 3D Visualization Tools: Transform your data into 3D tables for better analysis and reporting.
- Dynamic Filters: Use slicers to interactively filter and display the data from different perspectives.
- Real-Time Data Updates: Automatically reflect changes in data to keep your analysis up-to-date.
- Customizable Dashboard: Modify colors, data points, and layout to match your business requirements.
- Data Analysis Features: Analyze trends, correlations, and performance patterns through 3D visualization.
How to Use the Data-Driven 3D Table in Excel
1️⃣ Download the Template: Get instant access to your Data-Driven 3D Table in Excel.
2️⃣ Input Your Data: Enter your data into the provided fields. The table will automatically generate 3D visualizations based on your data.
3️⃣ Use Dynamic Filters: Filter data with slicers to explore different views and insights of your data.
4️⃣ Customize & Analyze: Adjust the table layout, colors, and data fields, and use the built-in analysis tools to gain insights and make data-driven decisions.
Who Can Benefit from the Data-Driven 3D Table in Excel?
🔹 Business Analysts & Data Scientists
🔹 Project Managers & Team Leaders
🔹 Financial Professionals & Accountants
🔹 Sales & Marketing Teams
🔹 Consultants & Decision-Makers
🔹 Anyone Looking to Present Data in a More Dynamic Way
Transform how you present and analyze data with the Data-Driven 3D Table in Excel. Turn raw data into interactive, 3D visualizations that make your data more engaging and insightful.
Click here to read the Detailed blog post
Visit our YouTube channel to learn step-by-step video tutorials
Youtube.com/@PKAnExcelExpert


Reviews
There are no reviews yet.