



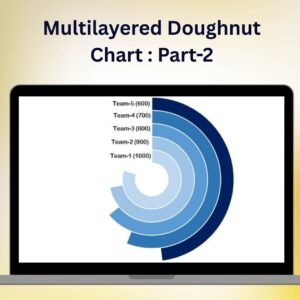
The An Innovative chart for team level performance in Excel is a dynamic and visually compelling way to track and analyze the performance of your team members. This chart offers an innovative approach to visualizing individual and team performance, making it easy to identify strengths, areas for improvement, and overall progress. Whether you’re a manager, team leader, or HR professional, this chart provides an insightful, at-a-glance view of team dynamics and achievements.
This Excel-based chart uses a combination of unique visual elements to represent individual performance metrics, team comparisons, and overall performance. With fully customizable features, the Innovative Chart for Team-Level Performance can be tailored to fit your specific performance metrics, whether you’re tracking KPIs, project milestones, or sales targets. The interactive design ensures that you can present and analyze team performance clearly and effectively.

Key Features of the Innovative Chart for An Innovative chart for team level performance
📌 Dynamic Performance Visualization
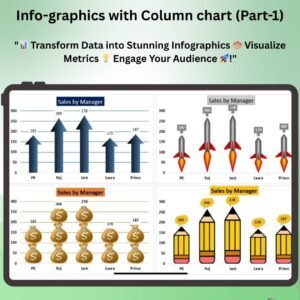
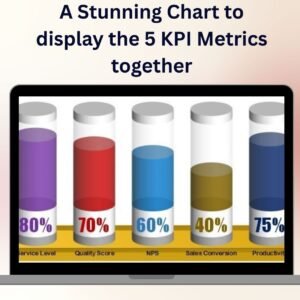
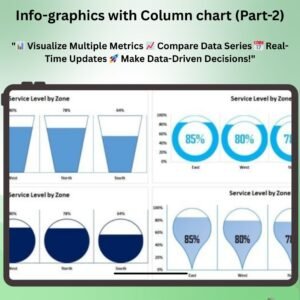
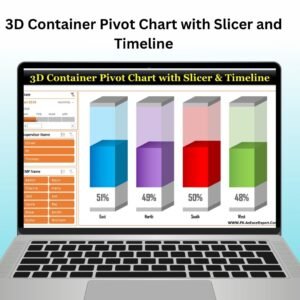
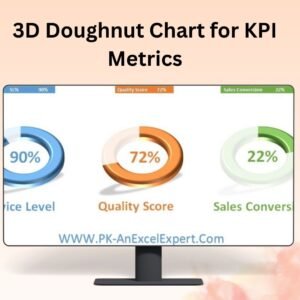
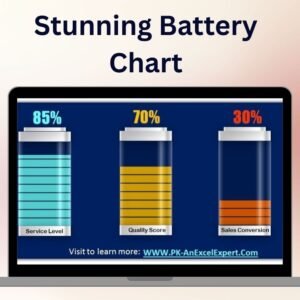
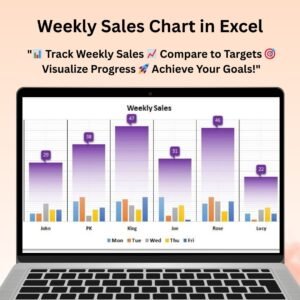
This chart offers a visually engaging way to track team-level performance. By using unique visual elements, such as color gradients and dynamic bars, it gives you a clear picture of each team member’s performance and how they compare to others.
🛠 Customizable Performance Metrics
The chart can be easily customized to track specific performance metrics that are important to your team. Whether you’re measuring sales targets, project completion, or customer service performance, this chart lets you adjust the data points to reflect what matters most to you.
💡 Team-Level Comparisons
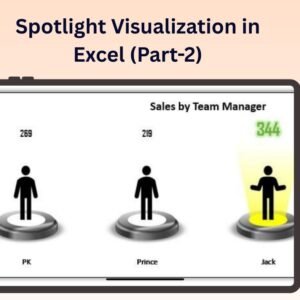
Easily compare the performance of individual team members and identify areas where improvement is needed. This feature provides a visual comparison to help managers make data-driven decisions for performance reviews, resource allocation, and team development.
🔢 Real-Time Data Updates
The Innovative Chart for Team-Level Performance automatically updates in real time as data is entered. This ensures that your chart always reflects the most current performance data, making it easy to track progress and adjust goals as needed.
🚀 Interactive Design
This chart features an interactive design that allows users to easily adjust the data inputs and watch the visual changes instantly. The user-friendly interface ensures a smooth experience when analyzing performance.
📊 Customizable Color Schemes
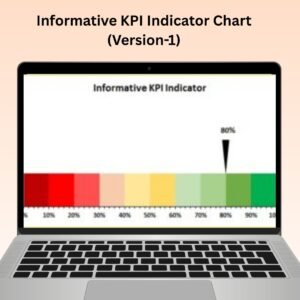
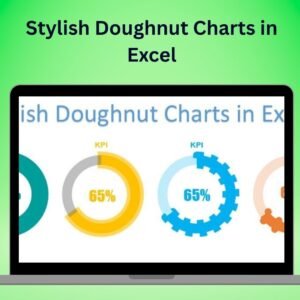
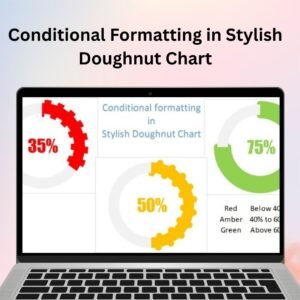
The chart offers various color schemes that can be adjusted to match your company’s branding or to highlight key performance indicators more effectively. Use color gradients or solid colors to represent performance levels and progress toward goals.
⚙ User-Friendly Interface
Despite its advanced functionality, the Innovative Chart for Team-Level Performance is designed to be easy to use. You don’t need to be an Excel expert to create and customize this chart—simply enter your data, adjust the settings, and the chart will do the rest.
🚀 Why You’ll Love the Innovative Chart for Team-Level Performance
✅ Clear and Engaging Visuals – Track team performance in a visually compelling way. ✅ Customizable Metrics – Tailor the chart to track the performance data that matters most to you. ✅ Real-Time Data Updates – The chart updates automatically as new data is entered. ✅ Interactive Design – Adjust data inputs and see the changes in real-time. ✅ Team Comparison – Compare team members’ performance and identify trends. ✅ Customizable Colors – Use different color schemes to highlight performance levels.
📂 What’s Inside the Innovative Chart for Team-Level Performance?
- Dynamic Chart Design: A visually engaging chart to track individual and team performance.
- Customizable Performance Metrics: Adjust the data points to track specific team goals and KPIs.
- Real-Time Data Updates: Automatically reflects data changes to ensure up-to-date performance tracking.
- Step-by-Step Setup Instructions: Easy-to-follow guide for setting up and customizing the chart.
🔍 How to Use the Innovative Chart for Team-Level Performance
1️⃣ Download the Template – Instant access to the Excel file upon purchase. 2️⃣ Input Your Team’s Data – Enter performance data such as sales, projects completed, or other relevant metrics. 3️⃣ Customize the Chart – Adjust the metrics and color schemes to suit your needs. 4️⃣ Track Progress – Monitor performance over time and make data-driven decisions. 5️⃣ Compare and Analyze – Use the chart for team performance reviews and development strategies.
🎯 Who Can Benefit from the Innovative Chart for Team-Level Performance? 🔹 Team Leaders
🔹 HR Managers
🔹 Sales Managers
🔹 Project Managers
🔹 Business Analysts
🔹 Anyone looking to track and compare team-level performance metrics
Track and analyze team performance with ease using the Innovative Chart for Team-Level Performance in Excel. This tool makes it easier to visualize, compare, and monitor individual and team goals, helping you drive better performance and decision-making.
Click here to read the Detailed blog post
https://www.pk-anexcelexpert.com/an-innovative-chart-for-team-level-performance/
Visit our YouTube channel to learn step-by-step video tutorials
Watch the step-by-step video tutorial:
Compatibility and Requirements
- Works in Microsoft Excel desktop (Excel 2016 or later, or Microsoft 365).
- Microsoft explains how Excel charts work in Create a chart from start to finish.
Frequently Asked Questions
What does this team performance chart show?
It shows each team member’s performance, how members compare with each other and overall team progress.
Which metrics can I chart?
You can chart the metrics that matter to your team, such as sales targets, project completion or customer service results.
Does the chart update when I change the data?
Yes. The chart updates as soon as you enter or change data.
Can I change the colors?
Yes. You can switch color schemes to match your brand or to highlight performance levels.
Does it include setup help?
Yes. The file comes with step-by-step setup instructions for entering data and customizing the chart.
Related Team Performance Templates
- Dynamic Performance Chart in Excel: another performance chart in Excel
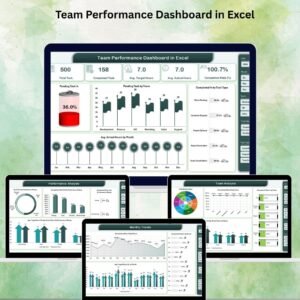
- Team Performance Dashboard in Excel: a full team dashboard in Excel
- Team Performance Report in Excel: a printable team report
- Team Performance Dashboard in Google Sheets: the team dashboard in Google Sheets
- Data Analyst’s Chart & Visualization Pack: 10 chart templates in one download
Browse all Excel charts and visualizations or the Excel HR templates.







Reviews
There are no reviews yet.