

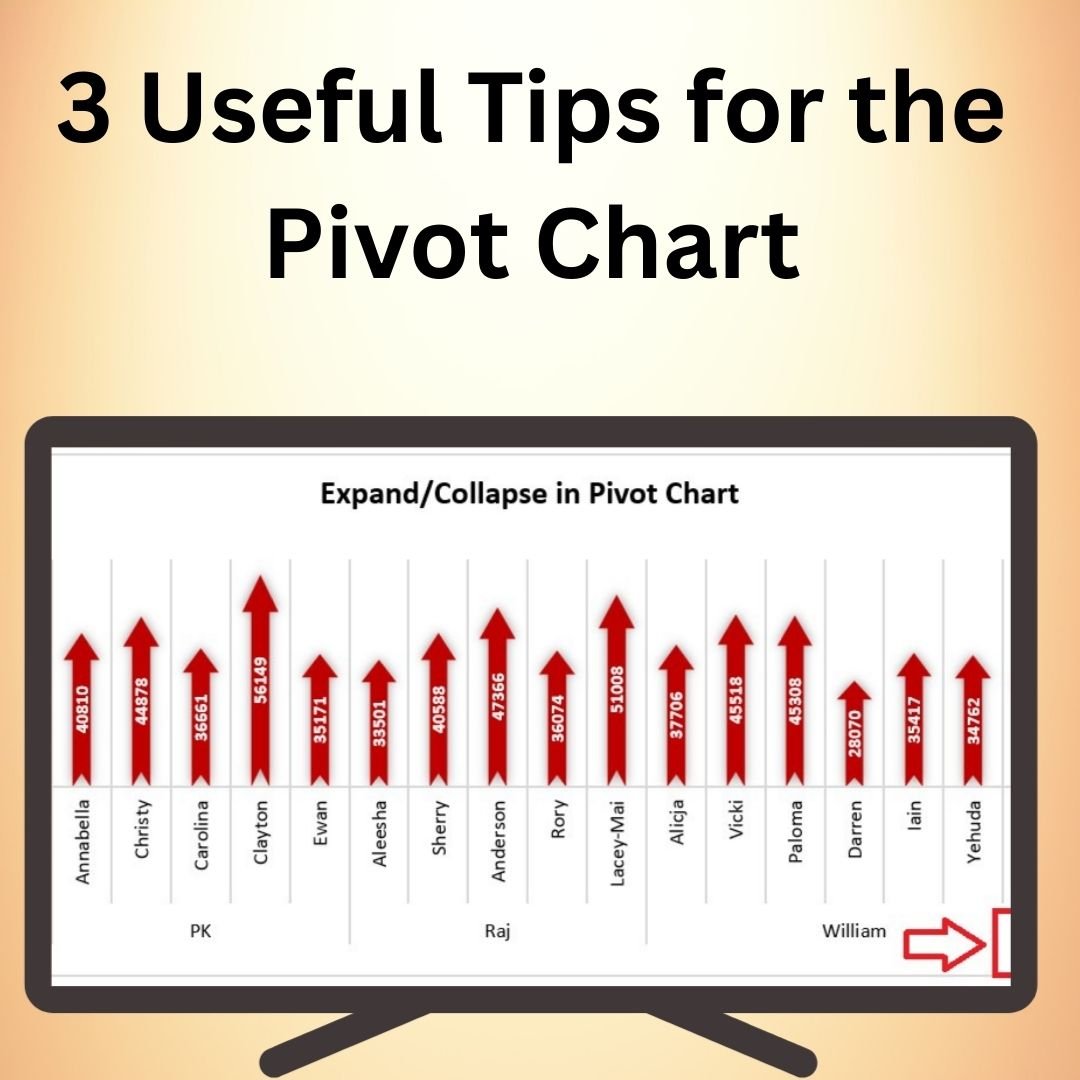
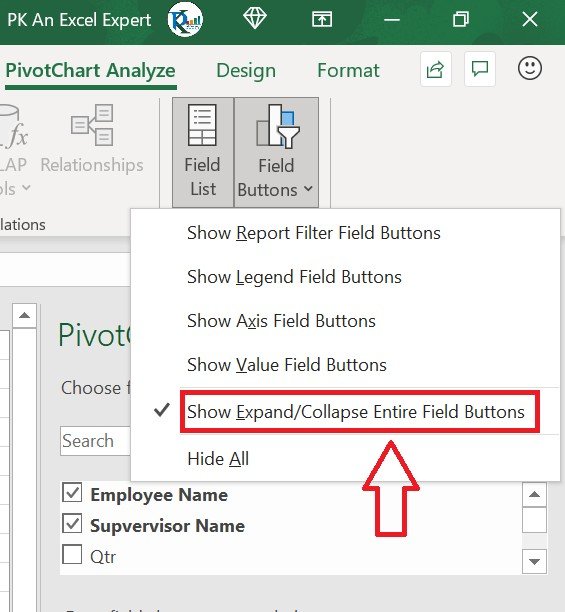
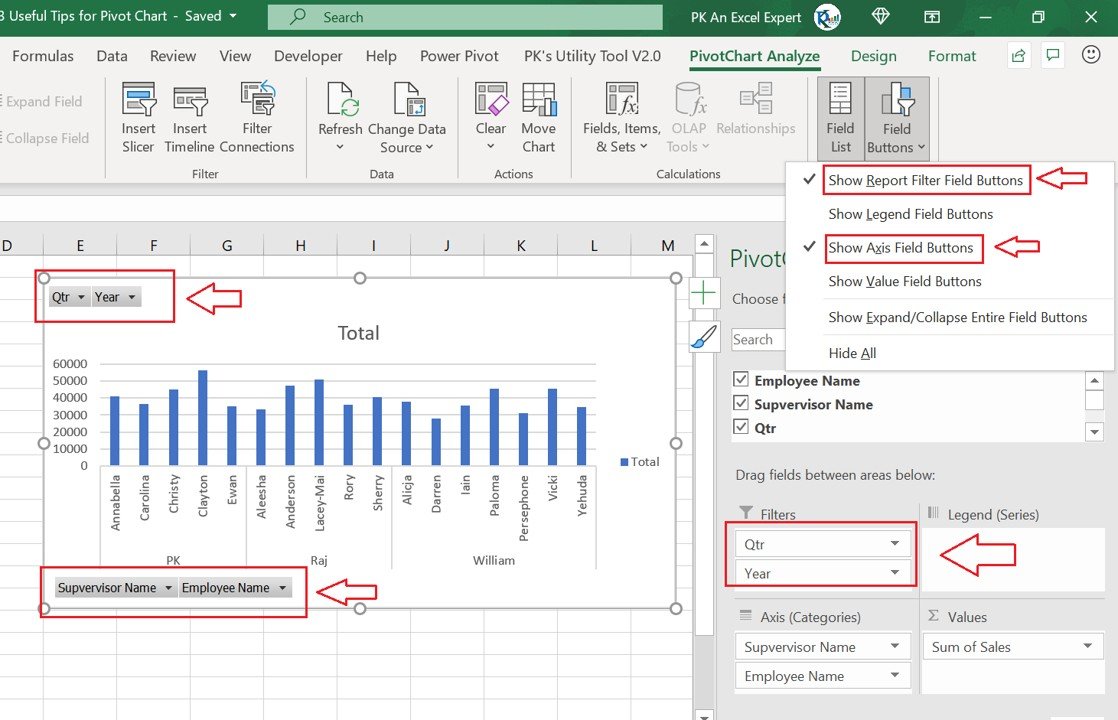

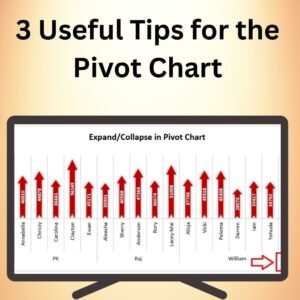
The 3 Useful Tips for the Pivot Chart in Excel is a valuable resource for anyone looking to enhance their data analysis and reporting using Pivot Charts. Pivot Charts are a powerful tool in Excel, allowing users to summarize, analyze, and visualize large datasets quickly and effectively. However, to make the most out of Pivot Charts, it’s important to understand some key tips and tricks that can help you get better results and create more dynamic, insightful reports.
This guide shares three essential tips that will allow you to harness the full potential of Pivot Charts in Excel. Whether you’re new to Pivot Charts or looking to refine your skills, these tips will enhance your data visualizations and make them more meaningful.
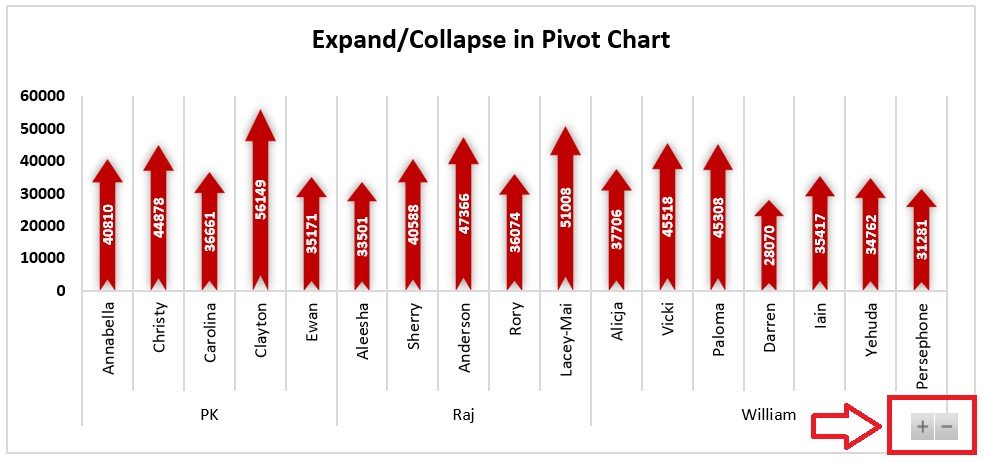
Key Features of the 3 Useful Tips for the Pivot Chart in Excel
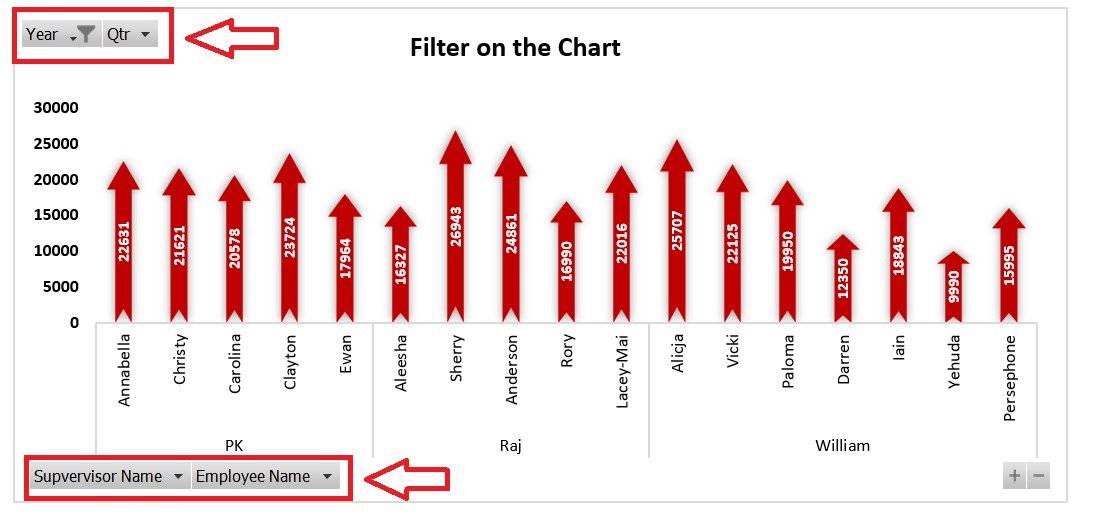
📌 Tip #1: Use Pivot Chart Filters to Focus on Relevant Data
The first tip involves using filters within Pivot Charts to isolate and focus on specific segments of your data. By applying filters such as category, time period, or region, you can highlight the most relevant insights and make your charts more focused and easier to understand. This feature allows you to refine your data presentation and avoid overwhelming your audience with unnecessary details.
🛠 Tip #2: Customize Your Pivot Chart for Better Clarity
One of the great features of Pivot Charts is their flexibility. This tip teaches you how to customize your charts, including adjusting chart types, adding labels, and changing the chart’s color scheme. By customizing your Pivot Chart, you can make it more visually appealing and ensure it aligns with your presentation or branding style.
💡 Tip #3: Use Multiple Pivot Charts for Comprehensive Analysis
Instead of relying on a single chart, use multiple Pivot Charts to break down different aspects of your data. This tip explains how to use multiple Pivot Charts in a dashboard format to provide a more comprehensive view of your data. By doing so, you can present different perspectives on the same dataset, such as comparing sales across regions, time periods, or product categories.
🔢 Clear Data Visualization
These tips help you visualize your data more clearly by focusing on key insights, customizing the presentation, and providing different perspectives on the data. This will help make your reports and presentations more informative and effective.
🚀 Why You’ll Love the 3 Useful Tips for the Pivot Chart in Excel
✅ Better Data Focus – Use filters to focus on the most relevant data for your audience. ✅ Customizable Design – Adjust chart types, colors, and labels to create clearer, more impactful reports. ✅ Comprehensive Data Analysis – Use multiple Pivot Charts to present a well-rounded view of your data. ✅ Time-Saving Tips – Simplify your data analysis and reporting with easy-to-apply tips. ✅ Enhanced Data Insights – Make your charts more meaningful and actionable.
📂 What’s Inside the 3 Useful Tips for the Pivot Chart in Excel?
- Tip #1: Use Pivot Chart Filters to Focus on Key Data
- Tip #2: Customize Your Pivot Chart for Clearer Presentation
- Tip #3: Use Multiple Pivot Charts for a Comprehensive View
- Step-by-Step Instructions: Learn how to apply each tip to enhance your Pivot Chart experience.
🔍 How to Use the 3 Useful Tips for the Pivot Chart in Excel
1️⃣ Download the Guide – Instant access to the tips and techniques upon purchase. 2️⃣ Learn the Tips – Follow the detailed instructions to apply each tip to your Pivot Charts. 3️⃣ Enhance Your Charts – Implement filters, customizations, and multiple charts for better insights. 4️⃣ Analyze and Present – Use the enhanced Pivot Charts for more effective data analysis and reporting.
🎯 Who Can Benefit from the 3 Useful Tips for the Pivot Chart in Excel? 🔹 Business Analysts
🔹 Financial Analysts
🔹 Marketing Teams
🔹 Project Managers
🔹 Data Analysts
🔹 Anyone looking to improve their Pivot Chart skills in Excel
Optimize your data presentations and enhance your reports with the 3 Useful Tips for the Pivot Chart in Excel. These tips will help you create more focused, visually appealing, and insightful Pivot Charts that make your data stand out.
Click here to read the Detailed blog post
https://www.pk-anexcelexpert.com/3-useful-tips-for-the-pivot-chart/
Visit our YouTube channel to learn step-by-step video tutorials
Watch the step-by-step video tutorial:
Compatibility and Requirements
- Works in Microsoft Excel desktop (Excel 2016 or later, or Microsoft 365).
- The tips use PivotTables and PivotCharts. Microsoft’s guide is Create a PivotTable to analyze worksheet data.
Frequently Asked Questions
What are the three tips?
Use Pivot Chart filters to focus on the data that matters, customize the chart for clearer presentation, and use multiple Pivot Charts for a fuller view of the same data.
Who is this for?
Anyone who builds reports with Pivot Charts, from beginners to users who want to refine their charts.
Does it include step-by-step instructions?
Yes. Each tip comes with step-by-step instructions you can apply to your own Pivot Charts.
Can I use the tips to build a dashboard?
Yes. The third tip shows how to place multiple Pivot Charts in a dashboard format.
Related Pivot Chart Templates
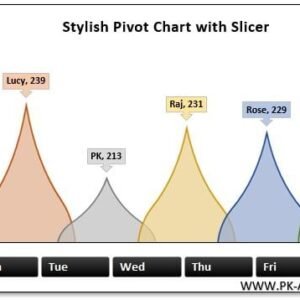
- Stylish Pivot Chart with Slicer in Excel: a pivot chart filtered by a slicer
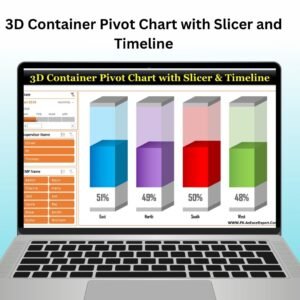
- 3D Container Pivot Chart with Slicer and Timeline: a pivot chart with a timeline filter
- Excel Magic: Connect Charts & Slicers in Seconds: connect several charts to slicers
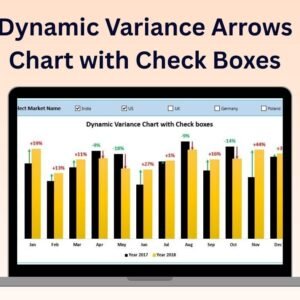
- Dynamic Variance Arrows Chart with Slicers: variance arrows you filter with slicers
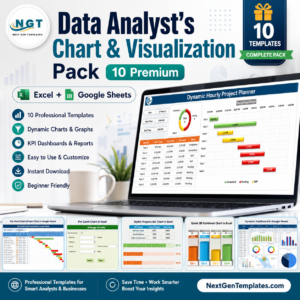
- Data Analyst’s Chart & Visualization Pack: 10 chart templates for Excel and Google Sheets in one download
Browse all Excel chart templates or the Excel dashboards.






Reviews
There are no reviews yet.