

Are you struggling to track critical KPIs in your stem cell bank operations? Finding it difficult to manage compliance, performance, and data accuracy across multiple sheets?
Stem Cell Banks KPI Dashboard in Power BI!
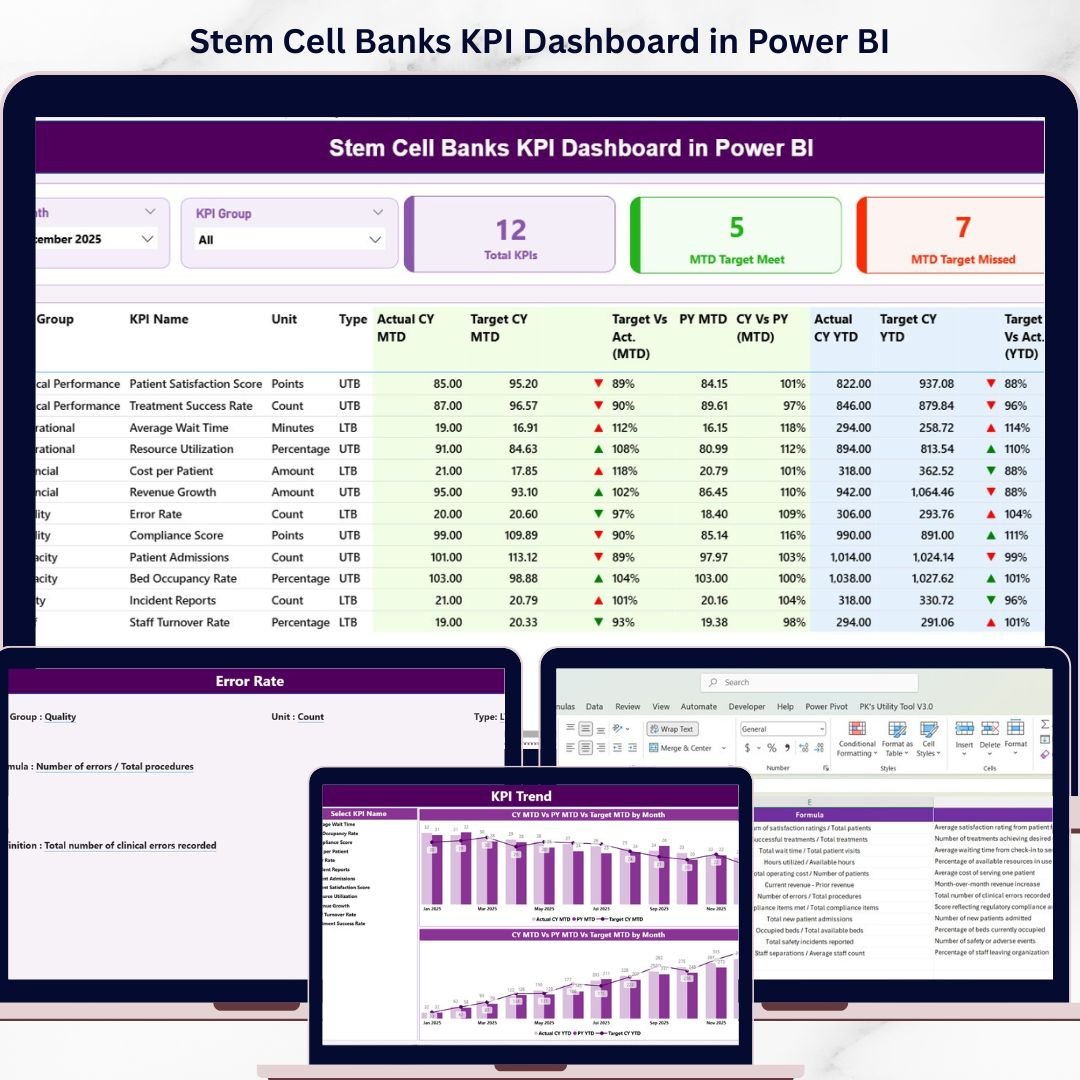
This powerful, ready-to-use Power BI dashboard is designed specifically for healthcare organizations, stem cell banks, and laboratory teams to monitor, analyze, and optimize performance in real time. Instead of relying on scattered spreadsheets and manual reporting, this dashboard brings all your critical KPIs into one centralized and interactive platform.
With advanced visuals, automated calculations, and dynamic filters, you can instantly gain deep insights into operational efficiency, compliance tracking, and performance trends. As a result, you can make faster, smarter, and data-driven decisions that improve both service quality and operational outcomes.
🔑 Key Features of Stem Cell Banks KPI Dashboard in Power BI
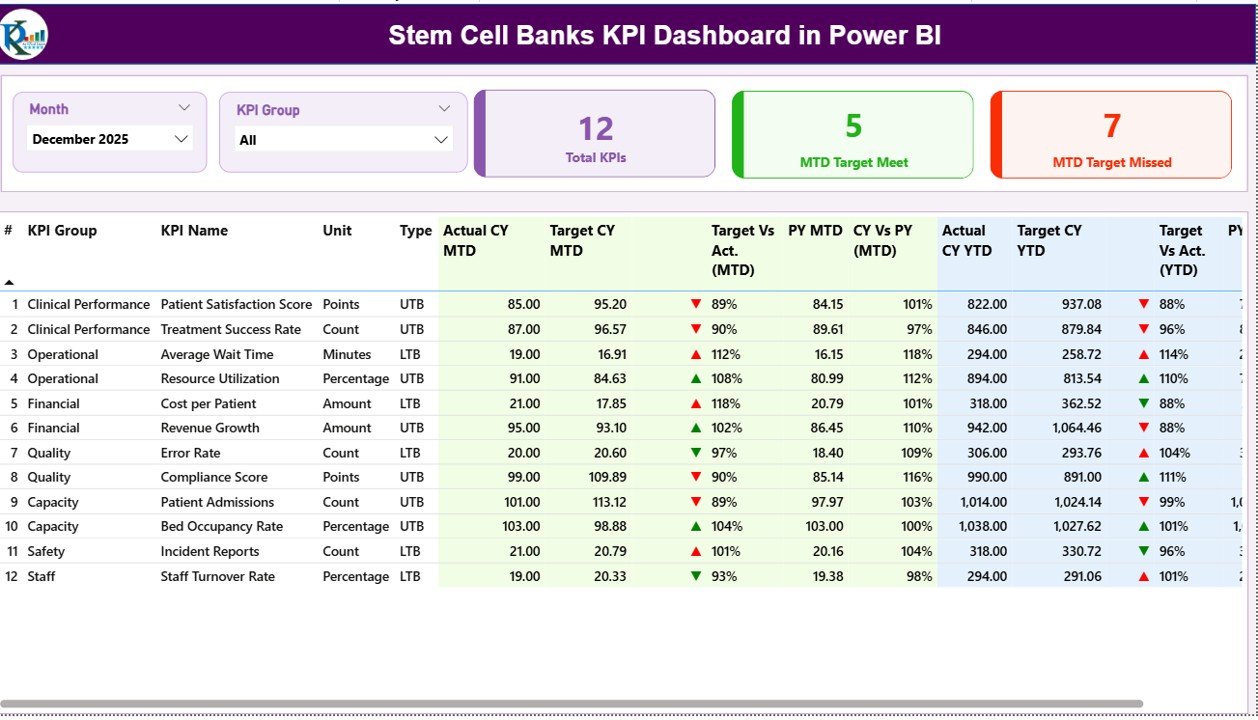
✨ 📊 Real-Time KPI Monitoring – Track all key performance indicators instantly with dynamic visuals and live updates.
✨ 🎯 Target vs Actual Comparison – Easily compare actual performance against targets for both MTD and YTD metrics.
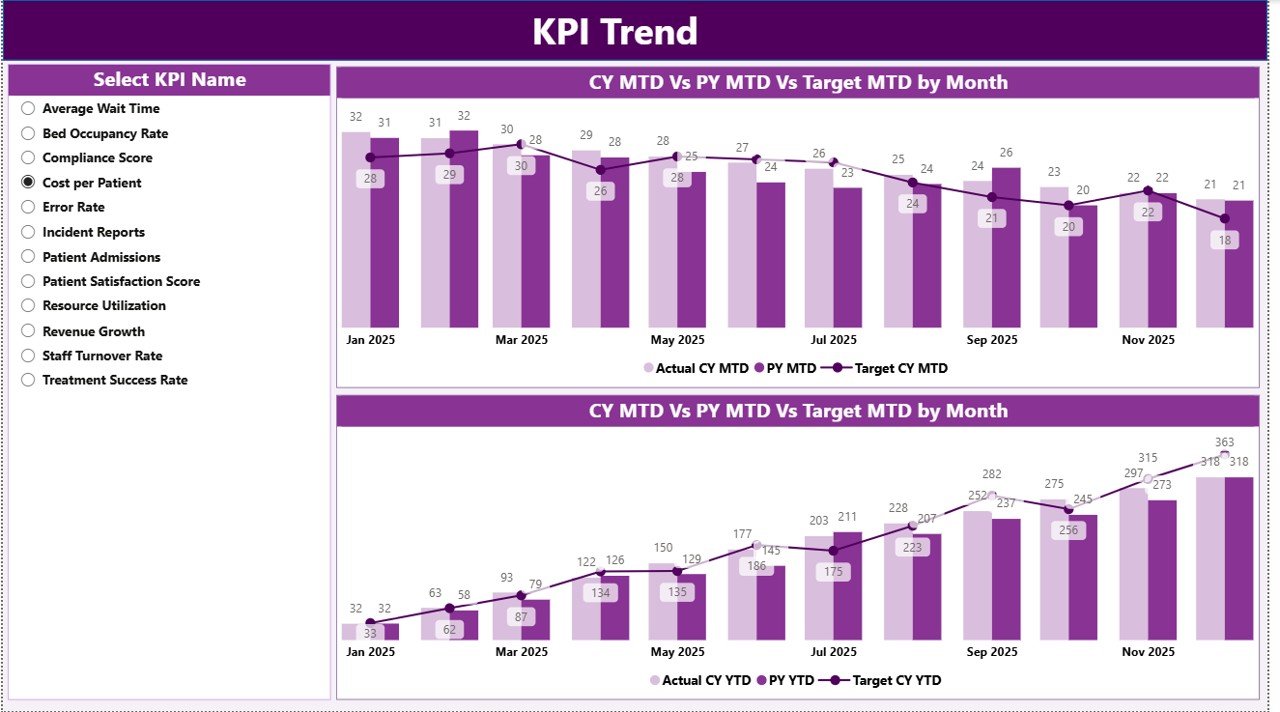
✨ 📈 Trend Analysis Dashboard – Analyze KPI trends over time and compare current performance with previous year data.
✨ 📋 Detailed KPI Table – Get complete KPI insights including type (LTB/UTB), units, performance indicators, and variance.
✨ 🎛️ Interactive Slicers & Filters – Filter data by Month and KPI Group to drill down into specific insights.
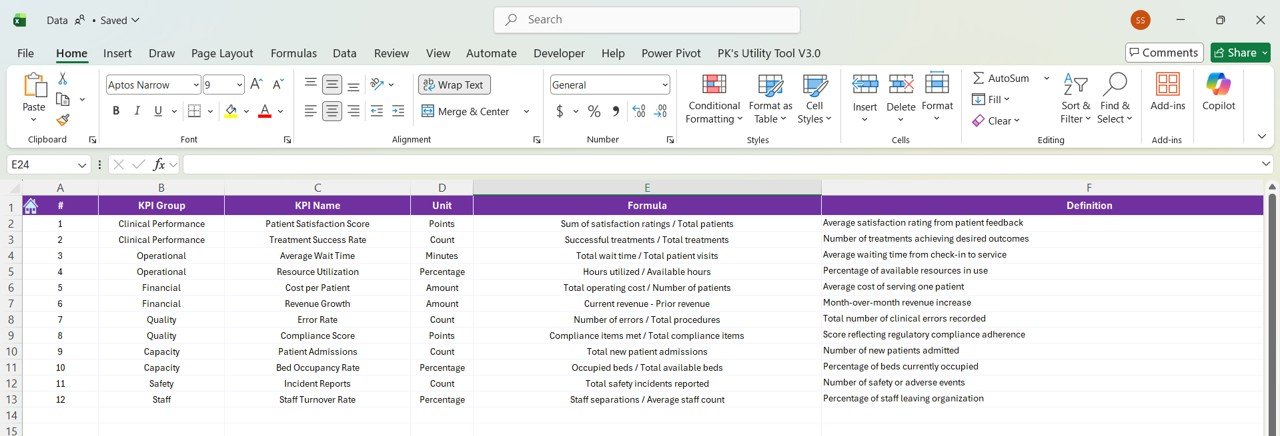
✨ 📘 KPI Definition Page – Understand KPI formulas, logic, and definitions with a dedicated drill-through page.
✨ ⚡ Automated Reporting – Eliminate manual reporting with fully automated calculations and visual updates.
📂 What’s Inside the Stem Cell Banks KPI Dashboard in Power BI
📁 Summary Page – Central dashboard with KPI cards, slicers, and detailed KPI performance table.
📁 KPI Trend Page – Visualize KPI trends using combo charts for MTD and YTD comparisons.
📁 KPI Definition Page – Drill-through page explaining KPI logic, formulas, and definitions.
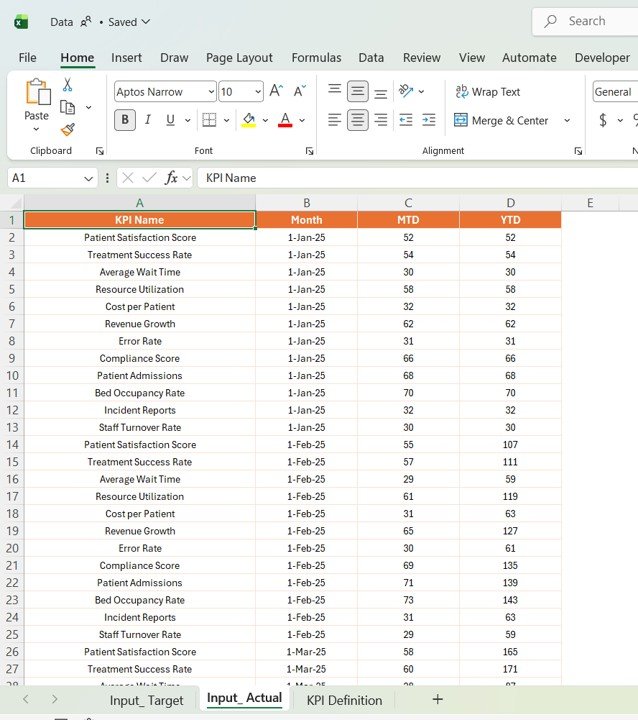
📁 Excel Data Source Files – Structured input sheets for Actual, Target, and KPI Definitions.
📁 Automated Power BI Visuals – Dynamic charts that update automatically when data is refreshed.
🛠️ How to Use the Stem Cell Banks KPI Dashboard in Power BI
👉 Step 1: Enter your KPI data in the Excel input sheets (Actual & Target)
👉 Step 2: Define KPIs clearly in the KPI Definition sheet
👉 Step 3: Load or refresh data in Power BI
👉 Step 4: Use slicers to filter KPIs by month or group
👉 Step 5: Analyze trends, performance, and compliance metrics
💡 Designed for ease of use—no advanced technical skills required!
👥 Who Can Benefit from This Stem Cell Banks KPI Dashboard in Power BI
✔️ Stem Cell Bank Managers – Monitor operations and improve efficiency
✔️ Laboratory Analysts – Track KPI performance and trends
✔️ Healthcare Data Analysts – Generate insights from complex datasets
✔️ Hospital Administrators – Ensure compliance and operational excellence
✔️ Compliance Teams – Monitor regulatory KPIs and maintain standards
This dashboard is not just a reporting tool—it’s a complete performance management system for stem cell banks. It empowers you to track real-time KPIs, improve operational efficiency, and maintain compliance with ease.
If you want to reduce manual work, improve accuracy, and make smarter healthcare decisions, this dashboard is your ultimate solution.


