



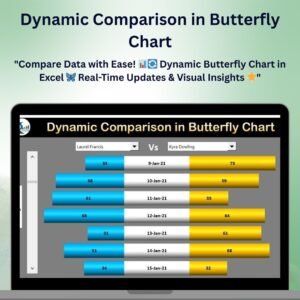
The Dynamic Comparison in Butterfly Chart is a visually striking and powerful tool for comparing two sets of data side by side. Perfect for businesses, analysts, or anyone needing to visually represent data comparisons, this Excel-based butterfly chart allows you to track and compare various metrics in a way that is both engaging and informative. The chart dynamically updates as data is added, providing a real-time view of your comparisons.
The butterfly chart, also known as a “paired bar chart,” is ideal for comparing metrics like sales performance across different periods, product performance, market share analysis, and more. Its unique design allows for easy identification of disparities and trends between two data sets, making it an essential tool for data-driven decision-making.

Key Features of the Dynamic Comparison in Butterfly Chart
📌 Side-by-Side Data Comparison
The butterfly chart allows you to compare two different data sets side by side, making it easier to visualize how they differ. This feature is ideal for comparing sales figures, performance metrics, financial data, or any other comparable values.
🛠 Dynamic and Real-Time Updates
As you input new data, the chart automatically updates to reflect changes in the comparison. This dynamic feature ensures that you always have the most up-to-date information, helping you make timely and informed decisions.
💡 Customizable Data Fields
The butterfly chart is fully customizable to match your specific comparison needs. You can adjust the data fields, labels, and categories to suit your business requirements. Whether you’re comparing sales data, budget allocation, or product performance, the chart adapts to your data.
🔢 Clear Visualization of Trends
The chart provides a clear and visually appealing way to compare data points. The two sets of data are represented in opposing directions, making it easy to spot trends, outliers, and areas that require attention.
🚀 Multiple Use Cases
This dynamic butterfly chart can be used for various applications, including sales comparisons, market research, employee performance analysis, financial reporting, and much more. Its versatility makes it suitable for businesses of all sizes and industries.
📊 Interactive and Engaging Design
With its interactive features and clean design, the butterfly chart makes complex data easy to understand and present. It can be used in presentations, reports, or dashboards to effectively communicate data insights.
⚙ Easy Setup and Customization
The butterfly chart is easy to set up, even for users with limited Excel experience. With clear instructions, you can customize the chart in minutes and start using it to compare your data effectively.
🚀 Why You’ll Love the Dynamic Comparison in Butterfly Chart
✅ Side-by-Side Data Comparison – Effortlessly compare two different data sets. ✅ Real-Time Updates – The chart dynamically adjusts as you update the data. ✅ Customizable Data Fields – Tailor the chart to match your unique comparison needs. ✅ Clear and Visual Comparison – Easily spot trends, disparities, and outliers. ✅ Simple Setup – Get started quickly with clear, user-friendly instructions.
📂 What’s Inside the Dynamic Comparison in Butterfly Chart?
- Side-by-Side Comparison: Compare two data sets side by side for a clear visual representation.
- Dynamic and Real-Time Updates: The chart automatically adjusts as you enter new data.
- Customizable Labels and Categories: Adjust the chart to match your business needs and data categories.
- Clear Visual Indicators: Easily identify differences and trends in your data.
- Simple Setup Instructions: Quick and easy steps to get the chart up and running.
🔍 How to Use the Dynamic Comparison in Butterfly Chart
1️⃣ Download the Template – Instant access to the Excel file upon purchase. 2️⃣ Input Your Data – Enter the two sets of data you want to compare. 3️⃣ Customize the Chart – Adjust labels, categories, and other elements to fit your comparison. 4️⃣ Track Changes – Watch the chart update automatically as new data is entered. 5️⃣ Present and Share – Use the butterfly chart in reports, meetings, or presentations to showcase your data comparisons.
🎯 Who Can Benefit from the Dynamic Comparison in Butterfly Chart? 🔹 Business Analysts
🔹 Sales Managers
🔹 Marketing Teams
🔹 Financial Analysts
🔹 Project Managers
🔹 Anyone who needs to compare data sets visually
Enhance your data analysis with the Dynamic Comparison in Butterfly Chart. With its real-time updates and customizable features, this chart helps you compare and present your data more effectively.
Click here to read the Detailed blog post
https://www.pk-anexcelexpert.com/downloads/dynamic-comparison-in-butterfly-chart/








Reviews
There are no reviews yet.