Are you struggling to track startup investments, monitor portfolio performance, and evaluate investor engagement efficiently? Managing angel network activities using scattered spreadsheets and manual reports can quickly become overwhelming.
The Business Angel Networks KPI Dashboard in Power BI is a powerful, ready-to-use analytics solution designed to simplify investment performance tracking. This dashboard transforms complex investment data into clear, interactive insights that help angel networks make smarter, faster, and more confident decisions.
Instead of analyzing multiple reports manually, this dashboard consolidates all important investment KPIs into one centralized Power BI interface. Through dynamic charts, KPI indicators, and performance comparisons, users can instantly monitor startup performance, investor participation, funding progress, and KPI achievement.
With the help of this professional dashboard, angel network managers and analysts can visualize both short-term and long-term performance trends using Month-to-Date (MTD) and Year-to-Date (YTD) analytics.
If you want to gain complete control over your investment analytics, this dashboard is the perfect solution.
🚀 Key Feature of Business Angel Networks KPI Dashboard in Power BI
📊 Interactive KPI Monitoring
Track important investment and performance indicators in an interactive Power BI dashboard environment.
📅 Month & KPI Group Filters
Analyze performance easily using built-in slicers that allow filtering by month and KPI category.
📈 MTD and YTD Performance Tracking
Monitor both short-term and long-term KPI performance through Month-to-Date and Year-to-Date analytics.
📉 Target vs Actual Comparison
Instantly evaluate whether KPIs meet or miss targets through automated comparisons.
🟢 Visual KPI Indicators
Green and red icons clearly show whether performance targets are achieved or missed.
📊 KPI Trend Analysis
Analyze performance trends over time using interactive combo charts that compare targets, actual values, and previous year results.
📑 Drill-Through KPI Definition Page
Understand KPI formulas, definitions, and calculations through a detailed drill-through page.
⚡ Automated Data Updates
Simply update the Excel data source and refresh the Power BI file to instantly update the entire dashboard.
📁 Excel Integrated Data Source
The dashboard connects seamlessly with Excel for easy data entry and management.
📦 What’s Inside the Business Angel Networks KPI Dashboard in Power BI
This dashboard contains three powerful analytical pages designed to provide both high-level insights and detailed KPI analysis.
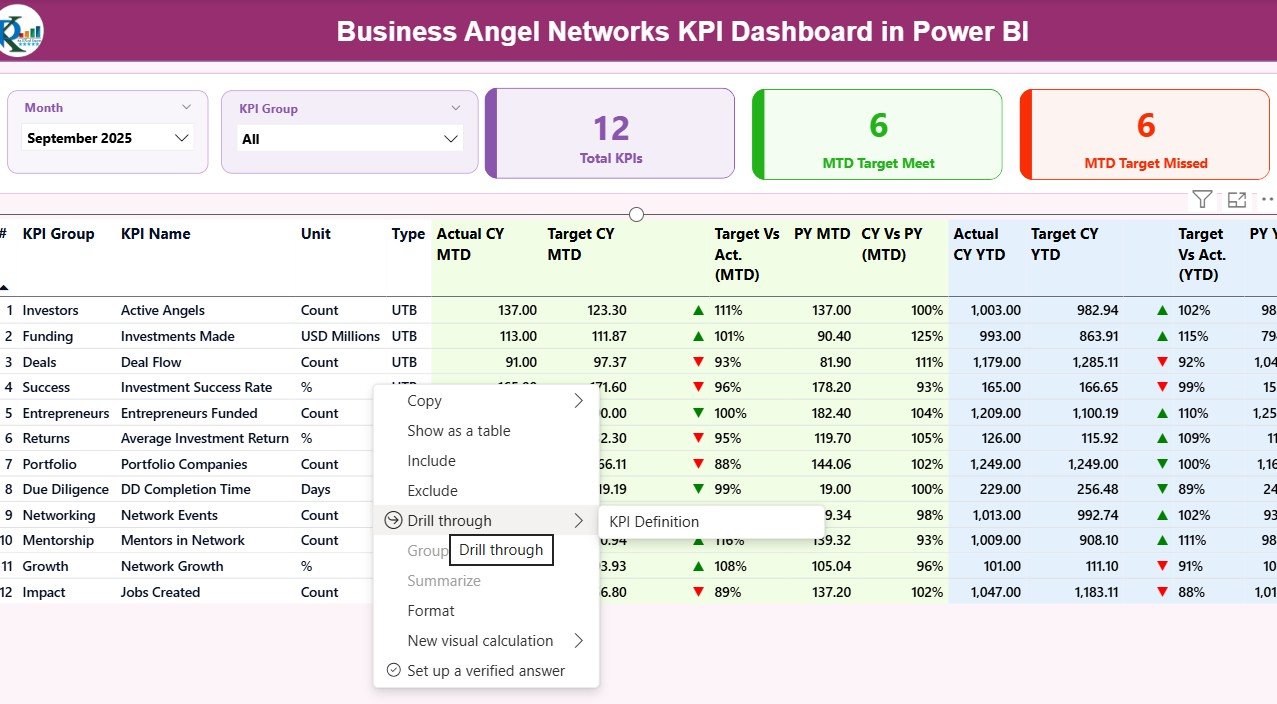
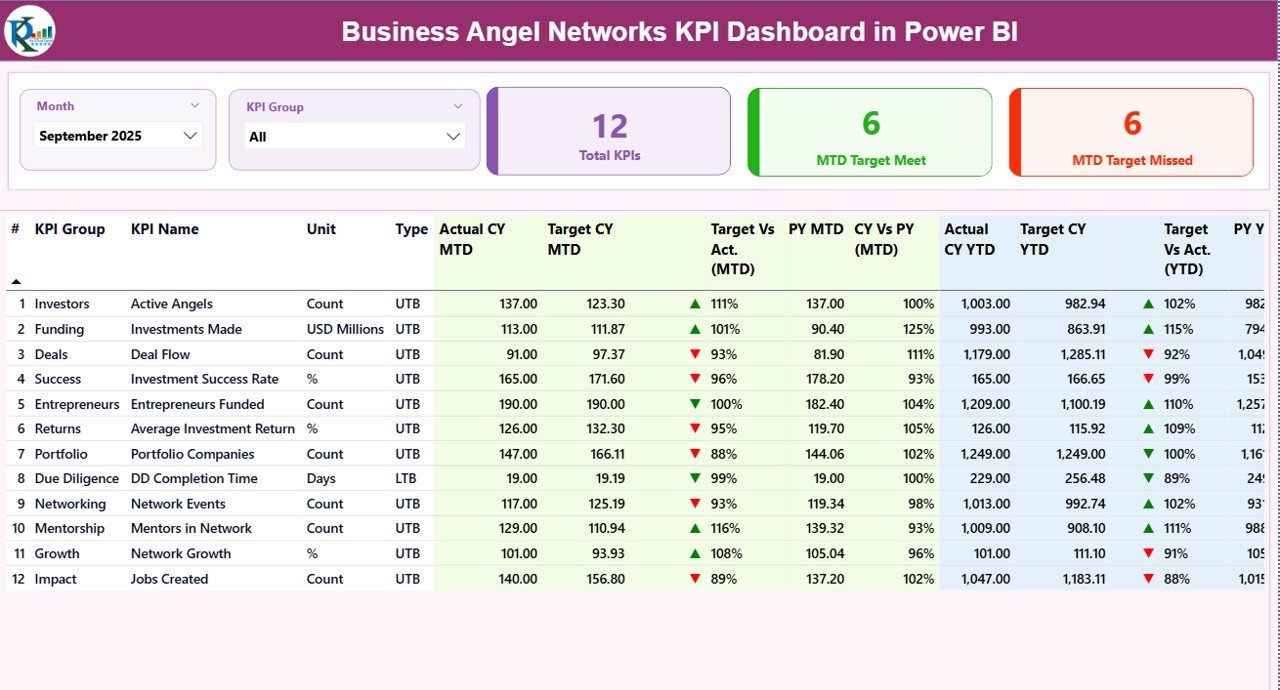
1️⃣ Summary Page
The Summary Page acts as the main dashboard overview where users can instantly monitor KPI performance.
It includes:
-
KPI Cards showing
-
Total KPIs Count
-
MTD Target Meet Count
-
MTD Target Missed Count
-
-
Interactive filters including:
-
Month slicer
-
KPI Group slicer
-
-
Detailed KPI performance table showing:
-
KPI Number
-
KPI Group
-
KPI Name
-
Unit
-
KPI Type (LTB / UTB)
-
Actual CY MTD
-
Target CY MTD
-
Target vs Actual (MTD)
-
Previous Year MTD
-
CY vs PY (MTD)
-
Actual CY YTD
-
Target CY YTD
-
Target vs Actual (YTD)
-
Previous Year YTD
-
CY vs PY (YTD)
-
This page gives users a complete performance snapshot in seconds.
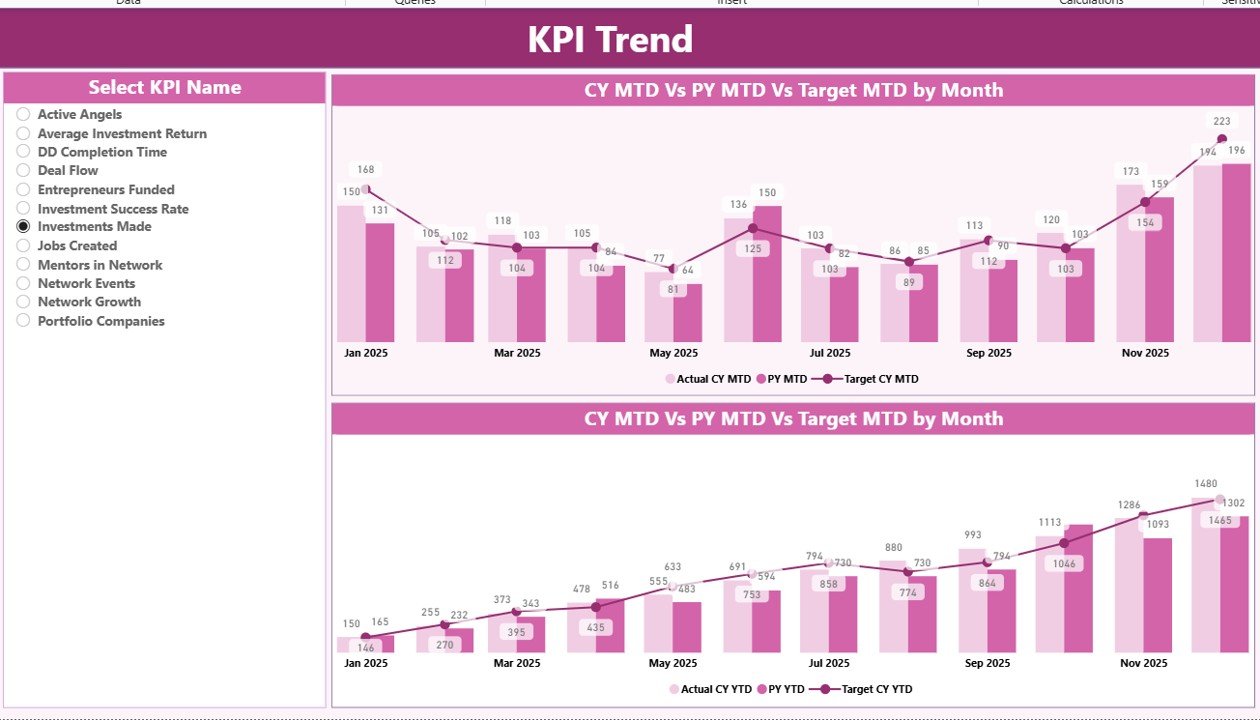
2️⃣ KPI Trend Page
The KPI Trend Page allows users to evaluate KPI performance over time.
It contains:
📊 Two interactive combo charts displaying:
-
Current Year Actual values
-
Target values
-
Previous Year performance
Users can also select specific KPIs using the KPI Name slicer to analyze performance trends individually.
This page helps identify:
-
Performance improvement
-
Declining KPIs
-
Stable performance indicators
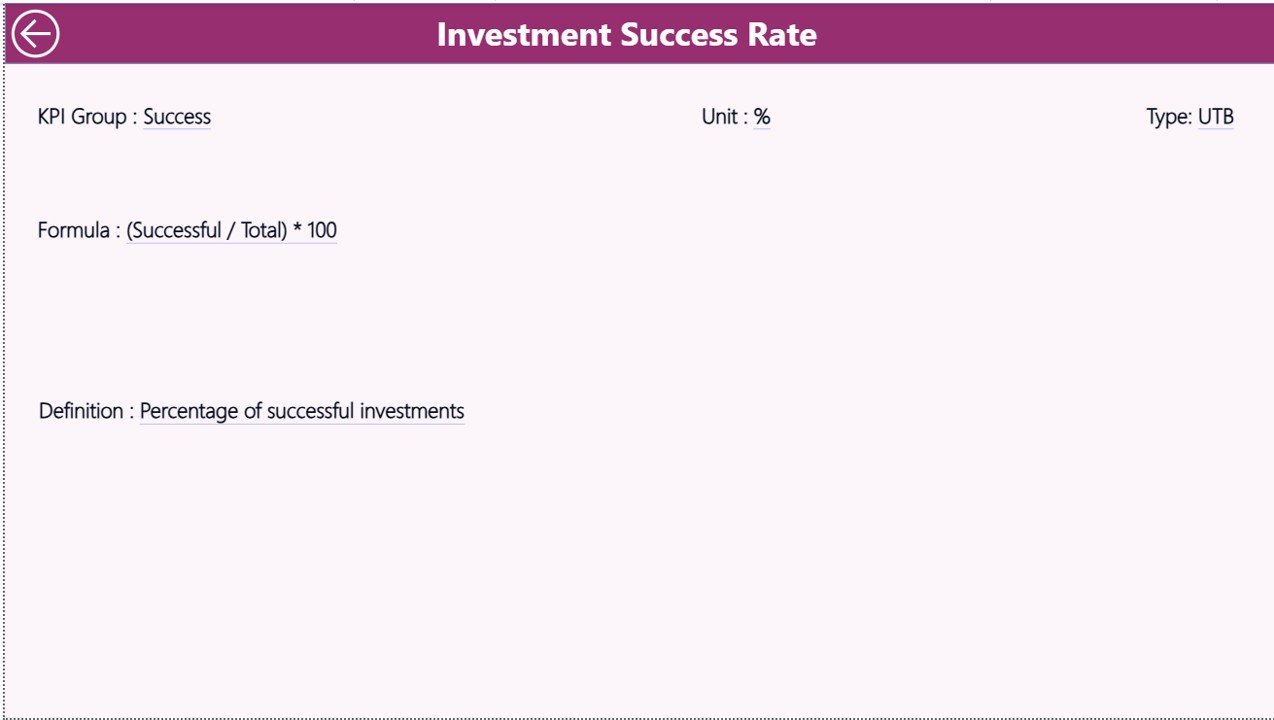
3️⃣ KPI Definition Page
The KPI Definition Page works as a drill-through information page.
From the Summary Page, users can drill through to view:
-
KPI formula
-
KPI definition
-
KPI group
-
KPI unit
-
KPI type
This ensures every KPI has clear documentation and understanding.
⚙️ How to Use the Business Angel Networks KPI Dashboard in Power BI
Using this dashboard is extremely simple.
Follow these steps:
1️⃣ Enter KPI data in the Excel file
Update actual values, targets, and KPI definitions.
2️⃣ Refresh the Power BI file
Click refresh to update the entire dashboard.
3️⃣ Use filters and slicers
Analyze KPIs by month or category.
4️⃣ Monitor performance indicators
Identify whether KPIs meet targets.
5️⃣ Analyze trends and performance gaps
Use the KPI Trend page to monitor improvements or declines.
Within minutes, you can transform raw investment data into clear and actionable insights.
👨💼 Who Can Benefit from This Business Angel Networks KPI Dashboard in Power BI
This dashboard is ideal for professionals working within the startup investment ecosystem.
👨💼 Angel Network Managers
Monitor investment performance and manage startup portfolios.
📊 Startup Portfolio Managers
Track startup growth, funding progress, and investment milestones.
💰 Angel Investors
Evaluate portfolio performance and funding success rates.
📈 Financial Analysts
Identify trends, opportunities, and potential investment risks.
🚀 Startup Ecosystem Organizations
Improve transparency and performance monitoring across multiple investments.
Why This Dashboard Is a Must-Have
✔ Centralized KPI monitoring
✔ Clear performance visualization
✔ Faster decision-making
✔ Improved transparency for investors
✔ Efficient portfolio performance tracking
This dashboard helps organizations turn complex investment data into powerful strategic insights.
Click here to read the Detailed blog post
Watch the step-by-step video tutorial: