Chambers of Commerce play a vital role in supporting local businesses, strengthening economic development, and creating networking opportunities for entrepreneurs and organizations. These institutions manage various activities such as membership programs, business events, partnerships, training initiatives, and financial operations. Because chambers handle multiple responsibilities simultaneously, tracking operational performance becomes extremely important.
However, monitoring performance manually using scattered spreadsheets can quickly become overwhelming. Chamber management teams must track membership growth, financial performance, event participation, engagement metrics, and operational efficiency. Without a structured performance monitoring system, it becomes difficult to evaluate progress, measure success, and make strategic decisions.
This is where the Chamber of Commerce KPI Dashboard in Excel becomes an incredibly valuable tool.
The Chamber of Commerce KPI Dashboard in Excel is a ready-to-use Excel template designed to help chambers and outsourced accounting teams track, analyze, and improve key performance indicators (KPIs) efficiently. This interactive dashboard transforms complex operational data into easy-to-understand visual insights using Excel charts, conditional formatting indicators, and dynamic filters.
Instead of manually reviewing multiple reports, decision-makers can monitor all important metrics from one centralized dashboard. The template allows organizations to track Month-to-Date (MTD), Year-to-Date (YTD), and Previous Year performance, enabling clear comparisons and better performance evaluation.
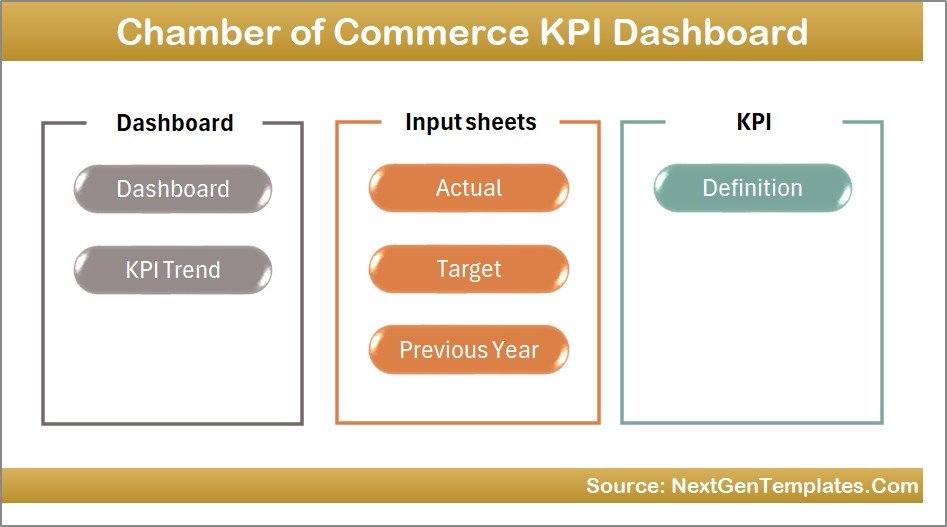
This dashboard includes seven well-structured worksheets that support data input, KPI definitions, and trend analysis. With a simple dropdown selection for months, users can instantly refresh all dashboard figures and analyze performance for any specific time period.
Because the dashboard combines automated calculations with visual indicators, chamber management teams can quickly identify performance gaps, monitor growth trends, and improve decision-making.
Whether you are managing membership programs, financial performance, event participation, or operational KPIs, this dashboard provides a powerful analytics system to keep your chamber’s performance on track.
By using this Excel dashboard, organizations gain better visibility into their operations, improve reporting efficiency, and ensure that key performance indicators remain aligned with business goals.
🚀 Key Feature of Chamber of Commerce KPI Dashboard in Excel
📊 Interactive KPI Performance Dashboard
Track chamber performance metrics through visual charts, KPI indicators, and dynamic Excel calculations.
📅 Dynamic Month Selection
Select any month from the dropdown to instantly update all KPI figures across the dashboard.
📈 MTD & YTD Performance Monitoring
Compare Month-to-Date and Year-to-Date performance against targets and previous year data.
🎯 Target vs Actual Performance Tracking
Visual indicators clearly show whether KPIs meet or miss performance targets.
📊 Conditional Formatting Indicators
Up and down arrows highlight performance improvements or declines.
📉 KPI Trend Analysis Charts
Analyze historical KPI performance using dynamic trend charts.
📂 Seven Organized Worksheets
The template includes structured sheets for dashboard visualization, data inputs, and KPI definitions.
🧾 Simple Data Input Structure
Separate sheets allow easy entry of actual numbers, target values, and previous year data.
⚙️ Fully Customizable KPI Framework
Organizations can modify KPI definitions, formulas, and targets based on their operational needs.
🚀 User-Friendly Excel Interface
Navigation buttons allow users to quickly move between sheets and analyze information efficiently.
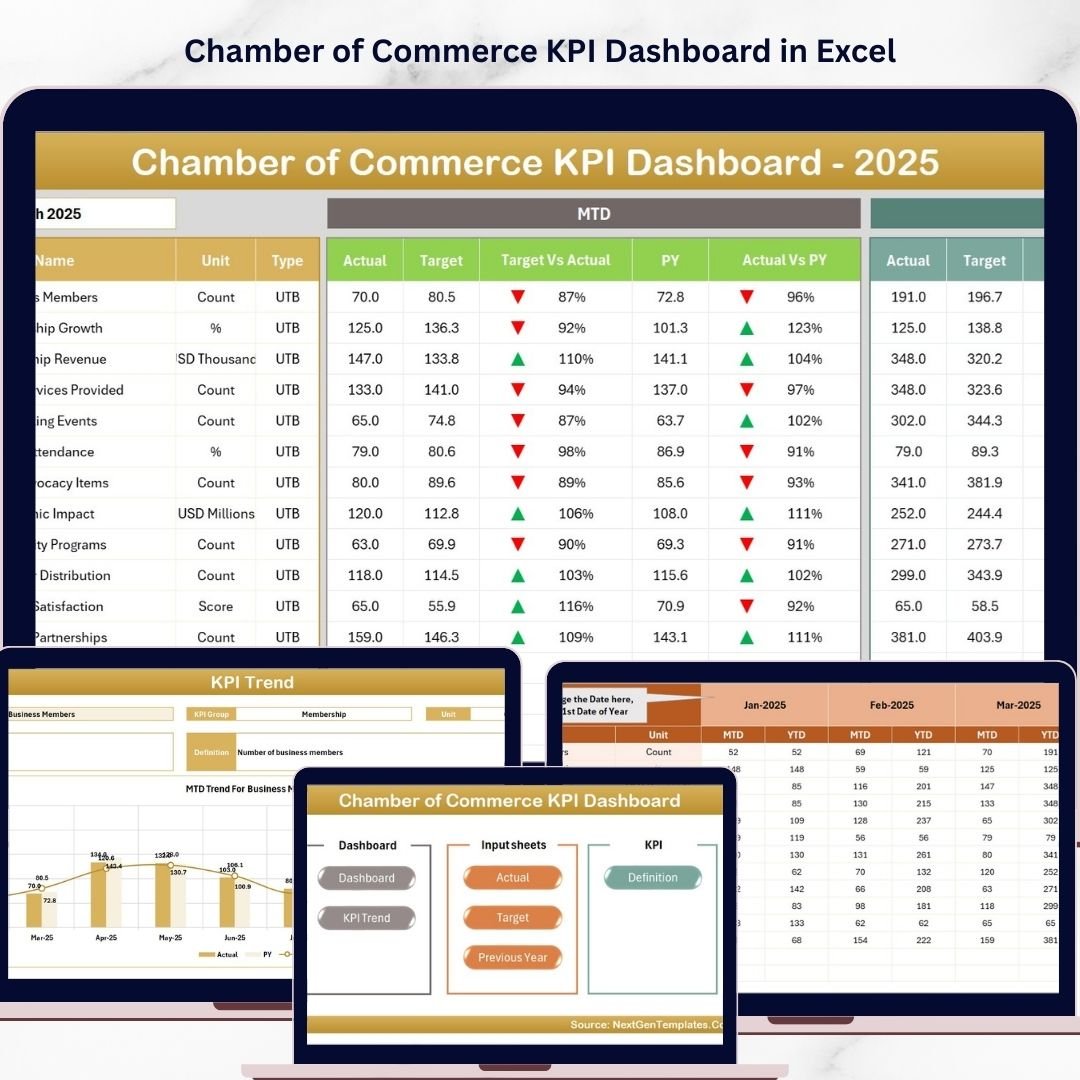
📊 What’s Inside the Chamber of Commerce KPI Dashboard in Excel
The dashboard includes seven structured worksheets that organize data management, KPI tracking, and visualization.
🏠 Home Sheet – Dashboard Navigation Center
The Home Sheet acts as the main navigation page of the workbook. It includes six clickable buttons that allow users to quickly jump to the relevant sheets.
This structure improves usability and makes the dashboard easy to navigate.
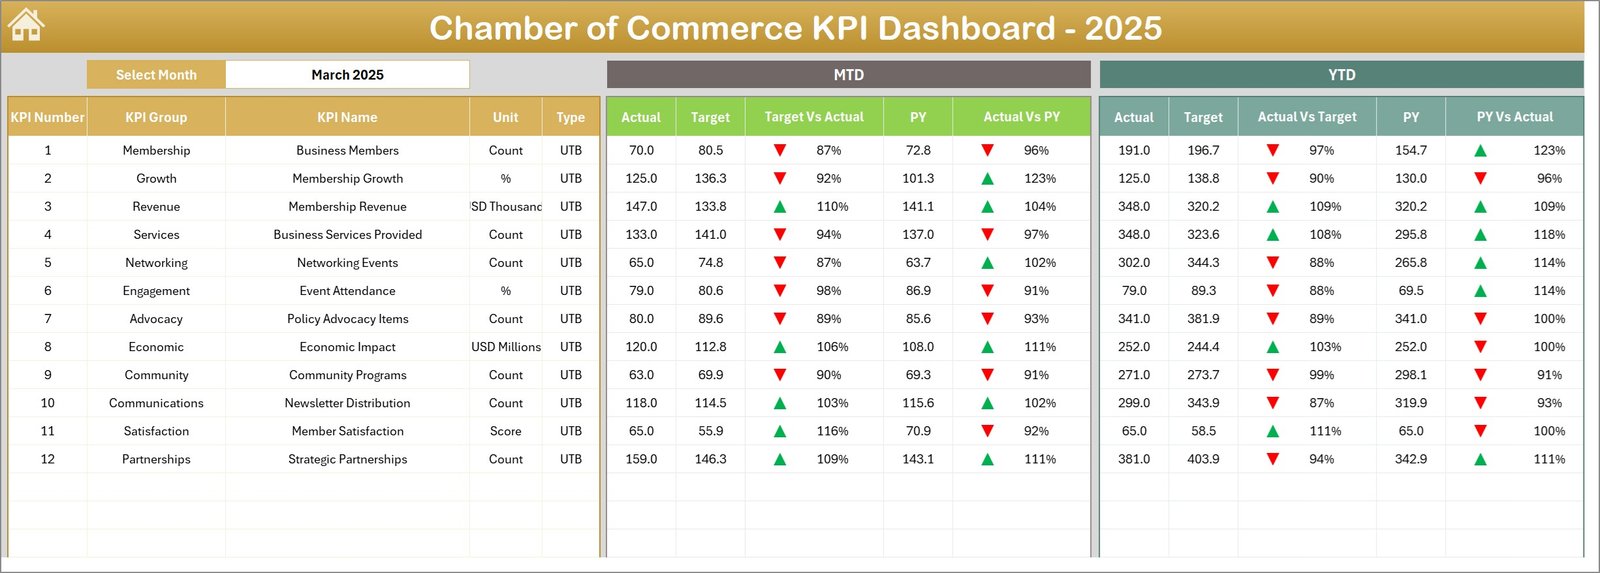
📊 Dashboard Sheet – KPI Performance Overview
This sheet is the main analytics dashboard where all KPIs are summarized.
Users can select a month from the dropdown in cell D3, which instantly updates the entire dashboard.
The dashboard displays:
• MTD Actual, Target, and Previous Year values
• YTD Actual, Target, and Previous Year values
• Target vs Actual performance indicators
• Previous Year vs Current Year comparisons
Conditional formatting arrows highlight whether KPIs are improving or declining.
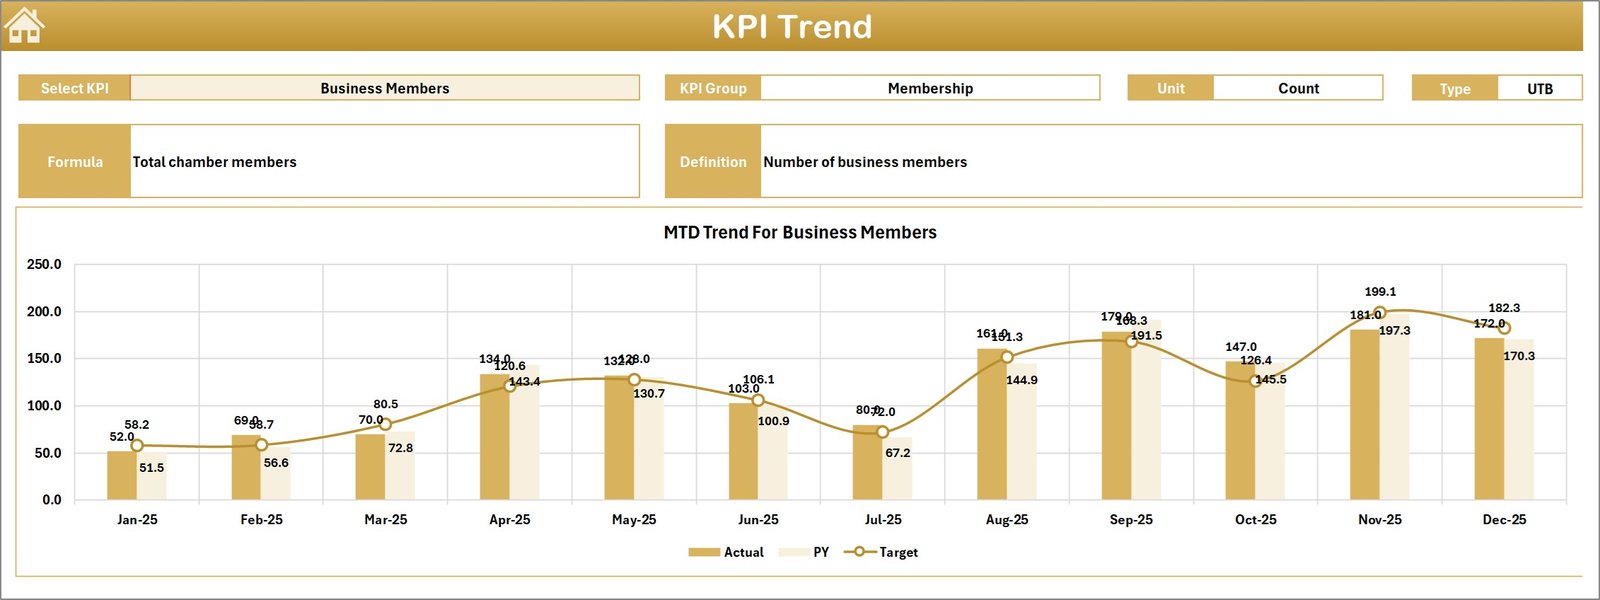
📈 KPI Trend Sheet – Detailed KPI Analysis
This sheet focuses on analyzing individual KPI performance over time.
Users can select any KPI from the dropdown located in cell C3.
The dashboard then displays detailed KPI information including:
• KPI Group
• Unit of measurement
• KPI type (LTB – Lower the Better / UTB – Upper the Better)
• KPI formula
• KPI definition
Additionally, trend charts visualize Actual, Target, and Previous Year performance for both MTD and YTD metrics.
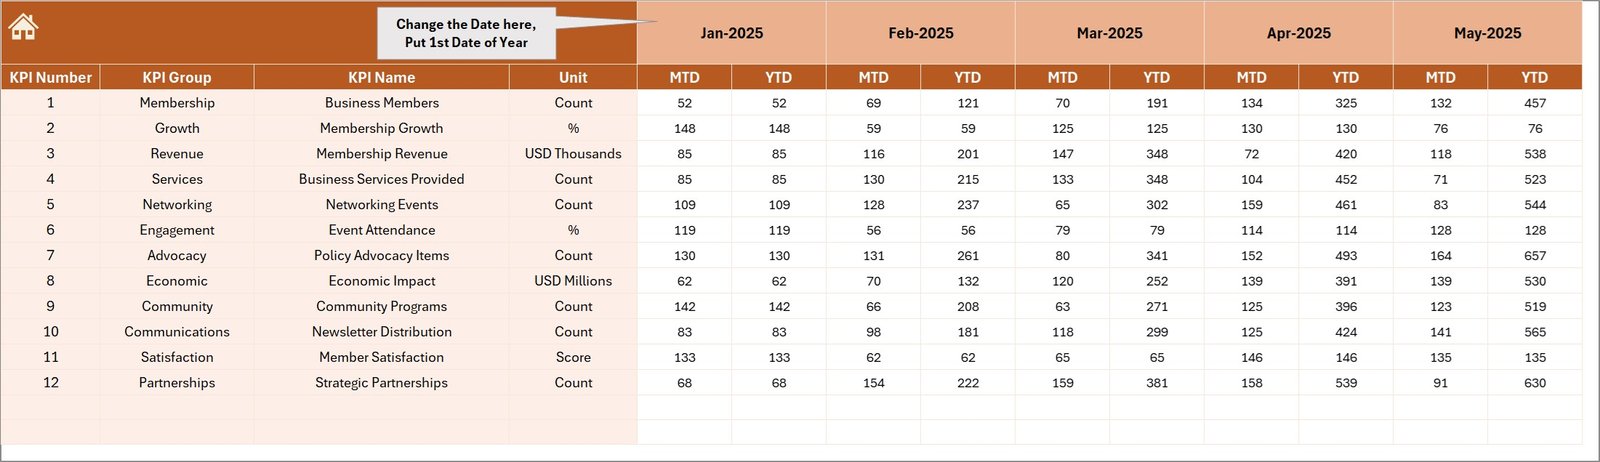
📥 Actual Numbers Input Sheet
This sheet is used to enter actual performance numbers for each KPI.
Users can enter:
• MTD Actual values
• YTD Actual values
The starting month can be changed in cell E1, allowing flexibility for different fiscal periods.
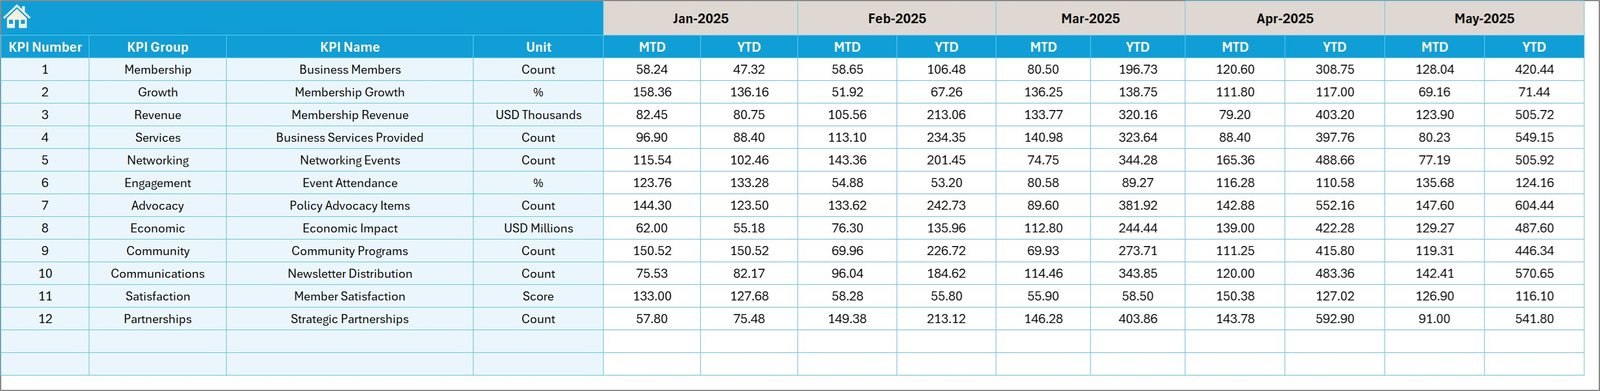
🎯 Target Numbers Input Sheet
This sheet stores KPI target values.
Users enter target numbers for both MTD and YTD periods, enabling the dashboard to measure actual performance against planned goals.
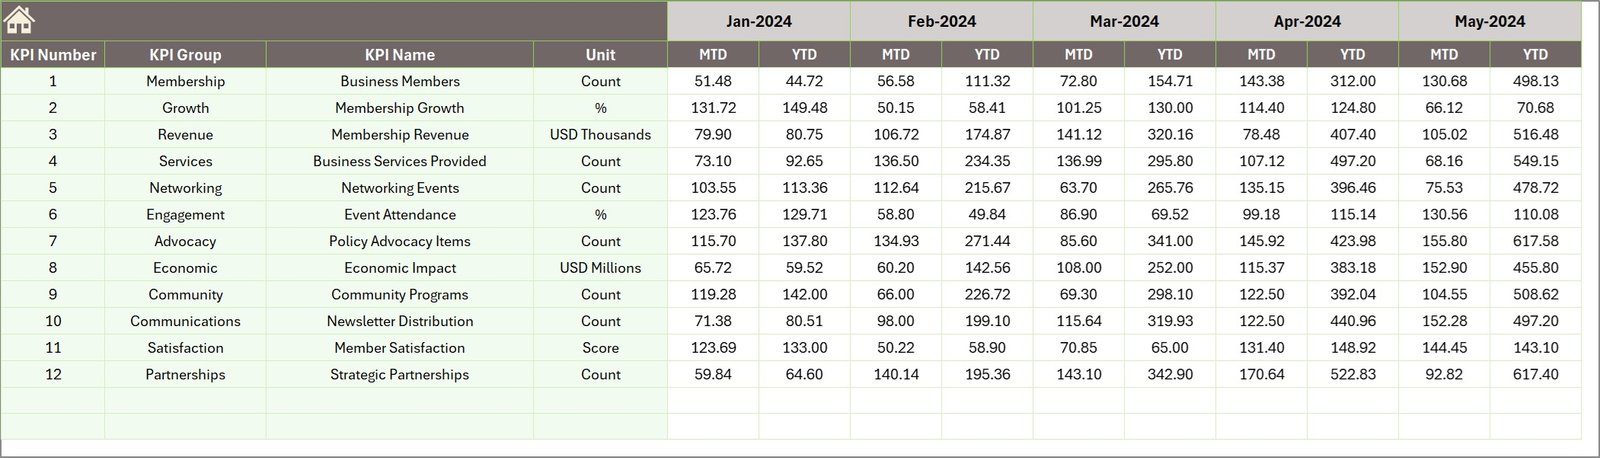
📅 Previous Year Numbers Sheet
To provide historical comparisons, this sheet stores the previous year’s KPI values.
This data allows users to analyze year-over-year performance improvements.
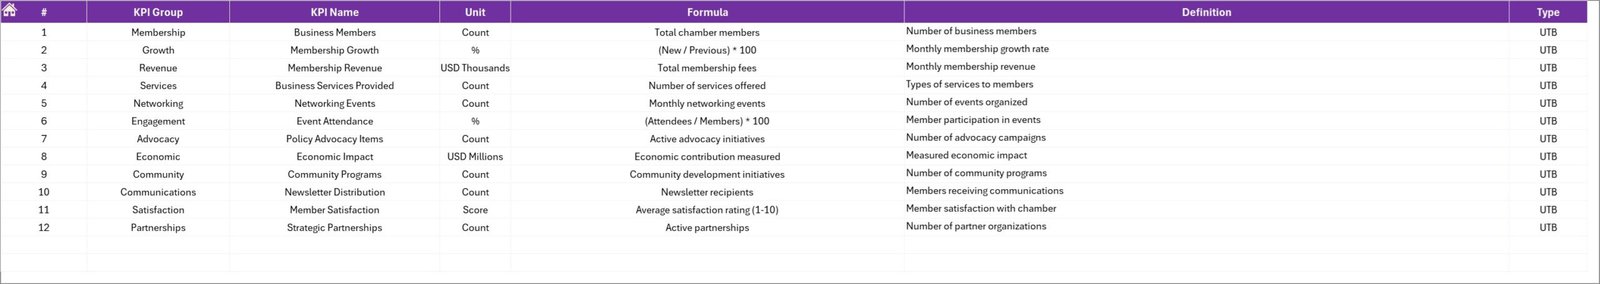
📘 KPI Definition Sheet
This sheet acts as the foundation of the entire dashboard.
It contains key KPI metadata including:
• KPI Name
• KPI Group
• Unit of measurement
• Formula used for calculation
• KPI definition
• KPI type (LTB or UTB)
This ensures clarity and alignment across all stakeholders.
⚙️ How to Use the Chamber of Commerce KPI Dashboard in Excel
Using the dashboard is simple and efficient.
1️⃣ Enter KPI definitions in the KPI Definition Sheet.
2️⃣ Input target values in the Target Numbers Sheet.
3️⃣ Enter actual KPI numbers in the Actual Numbers Sheet.
4️⃣ Add previous year data for historical comparison.
5️⃣ Select a month in the Dashboard sheet to analyze performance.
Within seconds, the dashboard automatically updates all visual insights.
👥 Who Can Benefit from This Chamber of Commerce KPI Dashboard
This dashboard is useful for many professionals involved in chamber management and business analytics.
🏢 Chamber of Commerce Management Teams
📊 Outsourced Accounting Firms
📈 Business Development Managers
👥 Membership Coordinators
🎓 Business Analysts & Consultants
🏛 Economic Development Organizations
Organizations using this dashboard gain clear visibility into operational performance and stronger data-driven decision-making capabi
Chambers of Commerce play a vital role in supporting local businesses, strengthening economic development, and creating networking opportunities for entrepreneurs and organizations. These institutions manage various activities such as membership programs, business events, partnerships, training initiatives, and financial operations. Because chambers handle multiple responsibilities simultaneously, tracking operational performance becomes extremely important.
However, monitoring performance manually using scattered spreadsheets can quickly become overwhelming. Chamber management teams must track membership growth, financial performance, event participation, engagement metrics, and operational efficiency. Without a structured performance monitoring system, it becomes difficult to evaluate progress, measure success, and make strategic decisions.
This is where the Chamber of Commerce KPI Dashboard in Excel becomes an incredibly valuable tool.
The Chamber of Commerce KPI Dashboard in Excel is a ready-to-use Excel template designed to help chambers and outsourced accounting teams track, analyze, and improve key performance indicators (KPIs) efficiently. This interactive dashboard transforms complex operational data into easy-to-understand visual insights using Excel charts, conditional formatting indicators, and dynamic filters.
Instead of manually reviewing multiple reports, decision-makers can monitor all important metrics from one centralized dashboard. The template allows organizations to track Month-to-Date (MTD), Year-to-Date (YTD), and Previous Year performance, enabling clear comparisons and better performance evaluation.
This dashboard includes seven well-structured worksheets that support data input, KPI definitions, and trend analysis. With a simple dropdown selection for months, users can instantly refresh all dashboard figures and analyze performance for any specific time period.
Because the dashboard combines automated calculations with visual indicators, chamber management teams can quickly identify performance gaps, monitor growth trends, and improve decision-making.
Whether you are managing membership programs, financial performance, event participation, or operational KPIs, this dashboard provides a powerful analytics system to keep your chamber’s performance on track.
By using this Excel dashboard, organizations gain better visibility into their operations, improve reporting efficiency, and ensure that key performance indicators remain aligned with business goals.
🚀 Key Feature of Chamber of Commerce KPI Dashboard in Excel
📊 Interactive KPI Performance Dashboard
Track chamber performance metrics through visual charts, KPI indicators, and dynamic Excel calculations.
📅 Dynamic Month Selection
Select any month from the dropdown to instantly update all KPI figures across the dashboard.
📈 MTD & YTD Performance Monitoring
Compare Month-to-Date and Year-to-Date performance against targets and previous year data.
🎯 Target vs Actual Performance Tracking
Visual indicators clearly show whether KPIs meet or miss performance targets.
📊 Conditional Formatting Indicators
Up and down arrows highlight performance improvements or declines.
📉 KPI Trend Analysis Charts
Analyze historical KPI performance using dynamic trend charts.
📂 Seven Organized Worksheets
The template includes structured sheets for dashboard visualization, data inputs, and KPI definitions.
🧾 Simple Data Input Structure
Separate sheets allow easy entry of actual numbers, target values, and previous year data.
⚙️ Fully Customizable KPI Framework
Organizations can modify KPI definitions, formulas, and targets based on their operational needs.
🚀 User-Friendly Excel Interface
Navigation buttons allow users to quickly move between sheets and analyze information efficiently.
📊 What’s Inside the Chamber of Commerce KPI Dashboard in Excel
The dashboard includes seven structured worksheets that organize data management, KPI tracking, and visualization.
🏠 Home Sheet – Dashboard Navigation Center
The Home Sheet acts as the main navigation page of the workbook. It includes six clickable buttons that allow users to quickly jump to the relevant sheets.
This structure improves usability and makes the dashboard easy to navigate.
📊 Dashboard Sheet – KPI Performance Overview
This sheet is the main analytics dashboard where all KPIs are summarized.
Users can select a month from the dropdown in cell D3, which instantly updates the entire dashboard.
The dashboard displays:
• MTD Actual, Target, and Previous Year values
• YTD Actual, Target, and Previous Year values
• Target vs Actual performance indicators
• Previous Year vs Current Year comparisons
Conditional formatting arrows highlight whether KPIs are improving or declining.
📈 KPI Trend Sheet – Detailed KPI Analysis
This sheet focuses on analyzing individual KPI performance over time.
Users can select any KPI from the dropdown located in cell C3.
The dashboard then displays detailed KPI information including:
• KPI Group
• Unit of measurement
• KPI type (LTB – Lower the Better / UTB – Upper the Better)
• KPI formula
• KPI definition
Additionally, trend charts visualize Actual, Target, and Previous Year performance for both MTD and YTD metrics.
📥 Actual Numbers Input Sheet
This sheet is used to enter actual performance numbers for each KPI.
Users can enter:
• MTD Actual values
• YTD Actual values
The starting month can be changed in cell E1, allowing flexibility for different fiscal periods.
🎯 Target Numbers Input Sheet
This sheet stores KPI target values.
Users enter target numbers for both MTD and YTD periods, enabling the dashboard to measure actual performance against planned goals.
📅 Previous Year Numbers Sheet
To provide historical comparisons, this sheet stores the previous year’s KPI values.
This data allows users to analyze year-over-year performance improvements.
📘 KPI Definition Sheet
This sheet acts as the foundation of the entire dashboard.
It contains key KPI metadata including:
• KPI Name
• KPI Group
• Unit of measurement
• Formula used for calculation
• KPI definition
• KPI type (LTB or UTB)
This ensures clarity and alignment across all stakeholders.
⚙️ How to Use the Chamber of Commerce KPI Dashboard in Excel
Using the dashboard is simple and efficient.
1️⃣ Enter KPI definitions in the KPI Definition Sheet.
2️⃣ Input target values in the Target Numbers Sheet.
3️⃣ Enter actual KPI numbers in the Actual Numbers Sheet.
4️⃣ Add previous year data for historical comparison.
5️⃣ Select a month in the Dashboard sheet to analyze performance.
Within seconds, the dashboard automatically updates all visual insights.
👥 Who Can Benefit from This Chamber of Commerce KPI Dashboard
This dashboard is useful for many professionals involved in chamber management and business analytics.
🏢 Chamber of Commerce Management Teams
📊 Outsourced Accounting Firms
📈 Business Development Managers
👥 Membership Coordinators
🎓 Business Analysts & Consultants
🏛 Economic Development Organizations
Organizations using this dashboard gain clear visibility into operational performance and stronger data-driven decision-making capabilities.
### Click hare to read the Detailed blog post
Visit our YouTube channel to learn step-by-step video tutorials
https://youtube.com/@PKAnExcelExpert