The Airbnb-style Rentals Dashboard has expanded dramatically in recent years. Platforms such as Airbnb, Vrbo, and Booking.com allow property owners to rent apartments, vacation homes, and shared spaces to travelers worldwide. As a result, hosts and property managers handle large volumes of booking data, including reservations, guest ratings, service fees, property performance, and revenue details.
However, managing this information using scattered spreadsheets can make it difficult to understand business performance clearly. Rental businesses must monitor booking trends, evaluate host productivity, track revenue growth, and analyze seasonal demand patterns. Without a centralized analytics solution, decision-makers often struggle to gain actionable insights from their data.
This is where the Airbnb-style Rentals Dashboard in Power BI becomes extremely valuable.
The Airbnb-style Rentals Dashboard in Power BI is a ready-to-use interactive analytics solution designed to help property managers and rental businesses monitor booking performance, analyze revenue trends, evaluate host productivity, and track property profitability. By leveraging Power BI’s powerful data visualization capabilities, this dashboard converts complex booking datasets into clear visual insights through KPI cards, charts, and dynamic slicers.
Instead of manually reviewing large reports, managers can analyze thousands of booking records in one centralized dashboard. With interactive visuals and automated calculations, decision-makers can instantly identify profitable cities, high-performing hosts, and seasonal booking patterns.
Whether you manage Airbnb properties, vacation rentals, serviced apartments, or short-term rental portfolios, this dashboard provides a comprehensive system to monitor rental performance and make data-driven decisions.
By transforming raw booking data into meaningful visual analytics, this dashboard helps rental businesses improve pricing strategies, optimize property performance, and maximize profitability.
🚀 Key Feature of Airbnb-style Rentals Dashboard in Power BI
📊 Interactive Rental Analytics Dashboard
Monitor booking performance, revenue trends, and property analytics through dynamic Power BI visualizations.
📅 Advanced Filtering with Slicers
Filter data instantly by city, host type, property type, booking status, or month.
📈 Booking Performance Monitoring
Track reservation trends, booking status distribution, and host productivity.
💰 Revenue Analysis and Profit Insights
Analyze rental income across cities, host types, and property categories.
🏠 Host and Property Performance Evaluation
Identify top-performing hosts and the most profitable property types.
⭐ Guest Rating Analysis
Evaluate host performance using guest feedback and ratings.
📊 Dynamic Visual Charts
Power BI charts update automatically when new data is refreshed.
🌍 City-wise Revenue Monitoring
Compare revenue performance across different locations.
📅 Monthly Rental Trend Analysis
Track seasonal booking trends and revenue fluctuations.
🔗 Flexible Data Integration
Connect the dashboard with Excel, databases, or other data sources for continuous updates.
📊 What’s Inside the Airbnb-style Rentals Dashboard in Power BI
This dashboard contains five analytical pages designed to provide a complete overview of short-term rental performance.
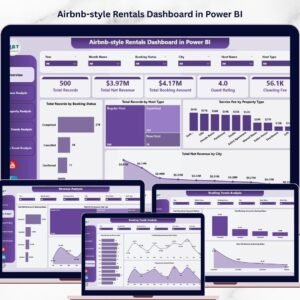
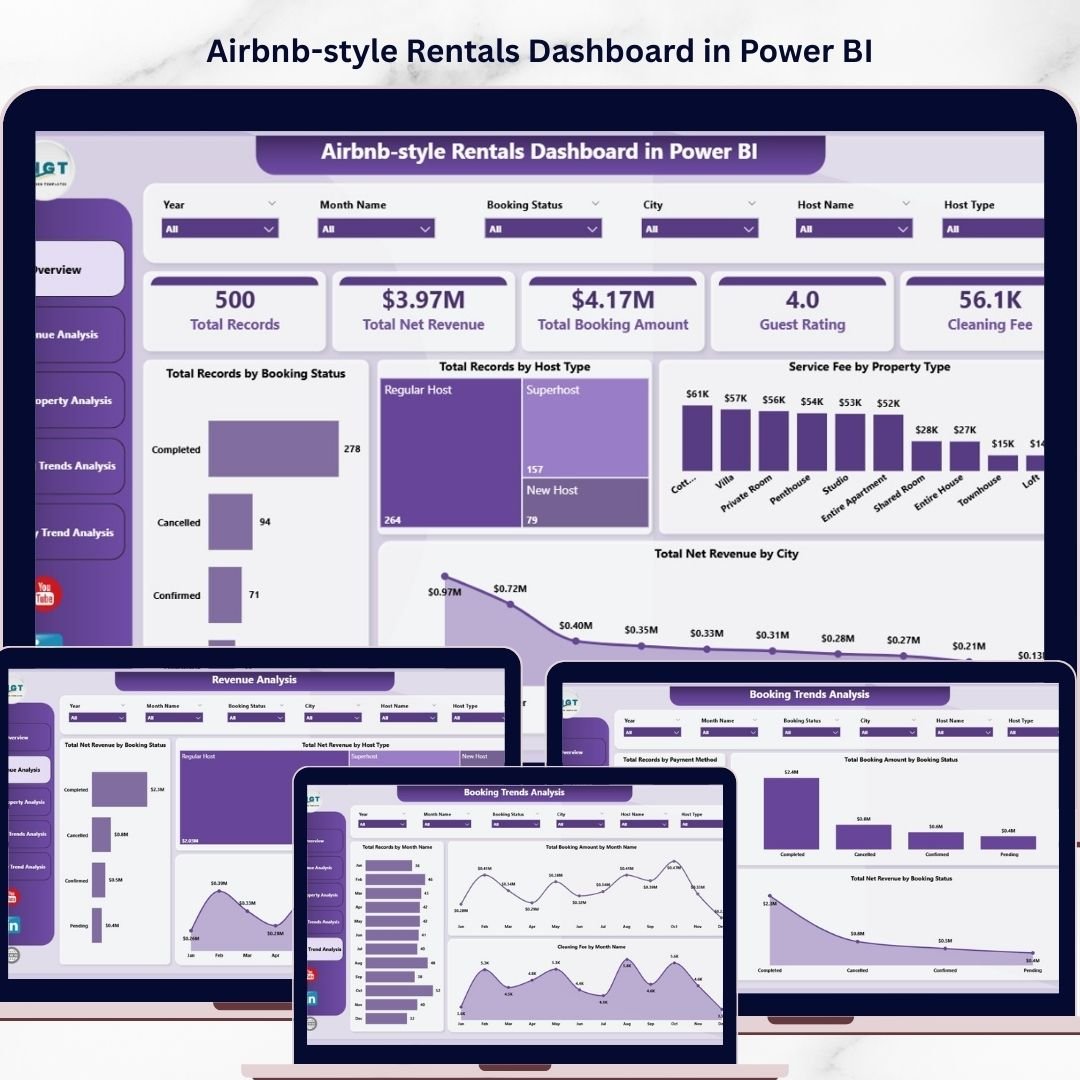
🏠 Overview Page – Rental Business Snapshot
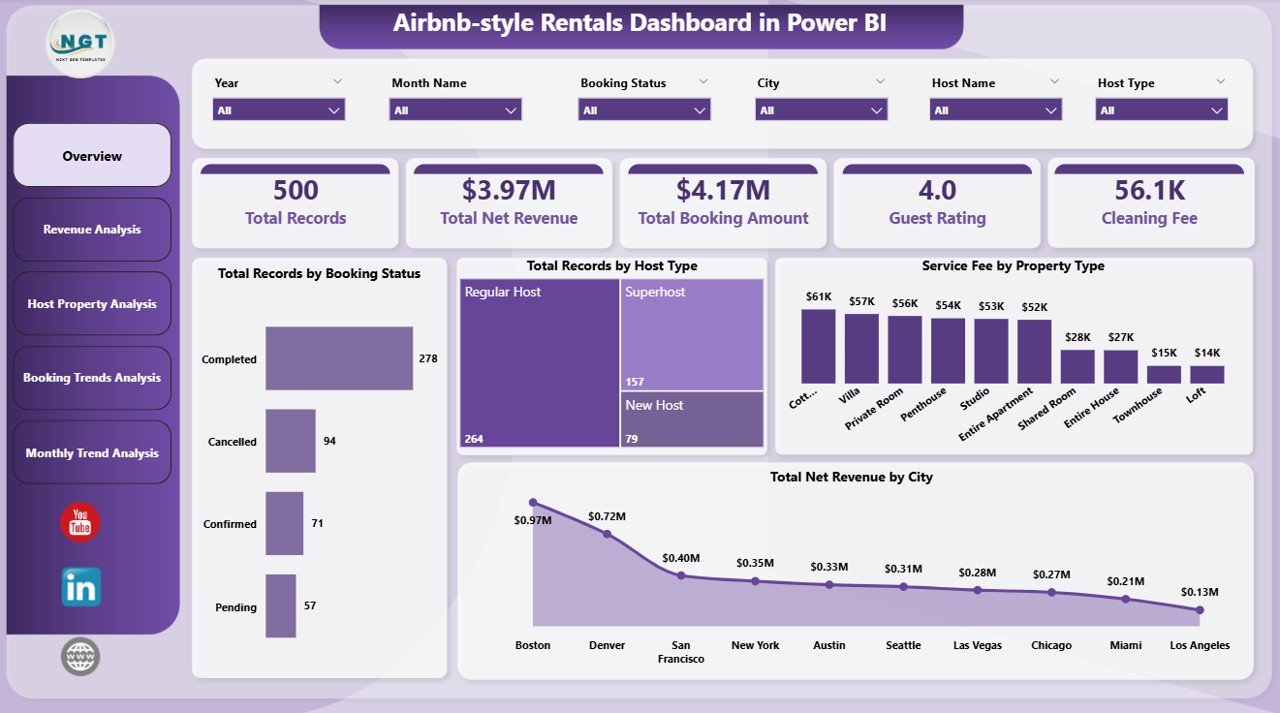
The Overview Page acts as the main dashboard and provides a quick summary of key rental metrics.
Important KPI indicators include:
• Total Records by Booking Status
• Total Records by Host Type
• Service Fee by Property Type
• Total Net Revenue by City
Visual charts help managers quickly understand booking distribution, host performance, service fee breakdown, and revenue distribution across cities.
Because these visuals update dynamically with slicers, users can analyze insights instantly.
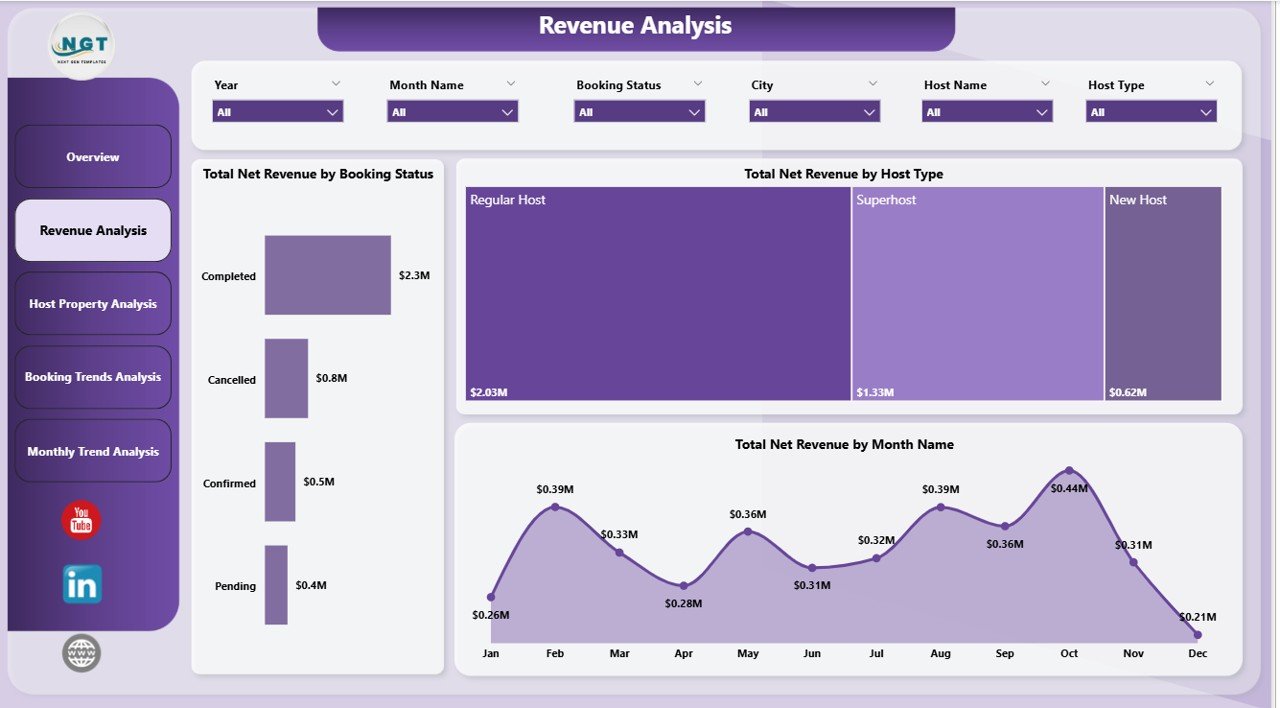
💰 Revenue Analysis Page
Revenue is one of the most important metrics for rental businesses. This page focuses on rental income patterns and profitability.
Charts included on this page:
• Total Net Revenue by Booking Status
• Total Net Revenue by Host Type
• Total Net Revenue by Month Name
This analysis helps property managers understand which booking categories generate the highest revenue and identify seasonal revenue trends.
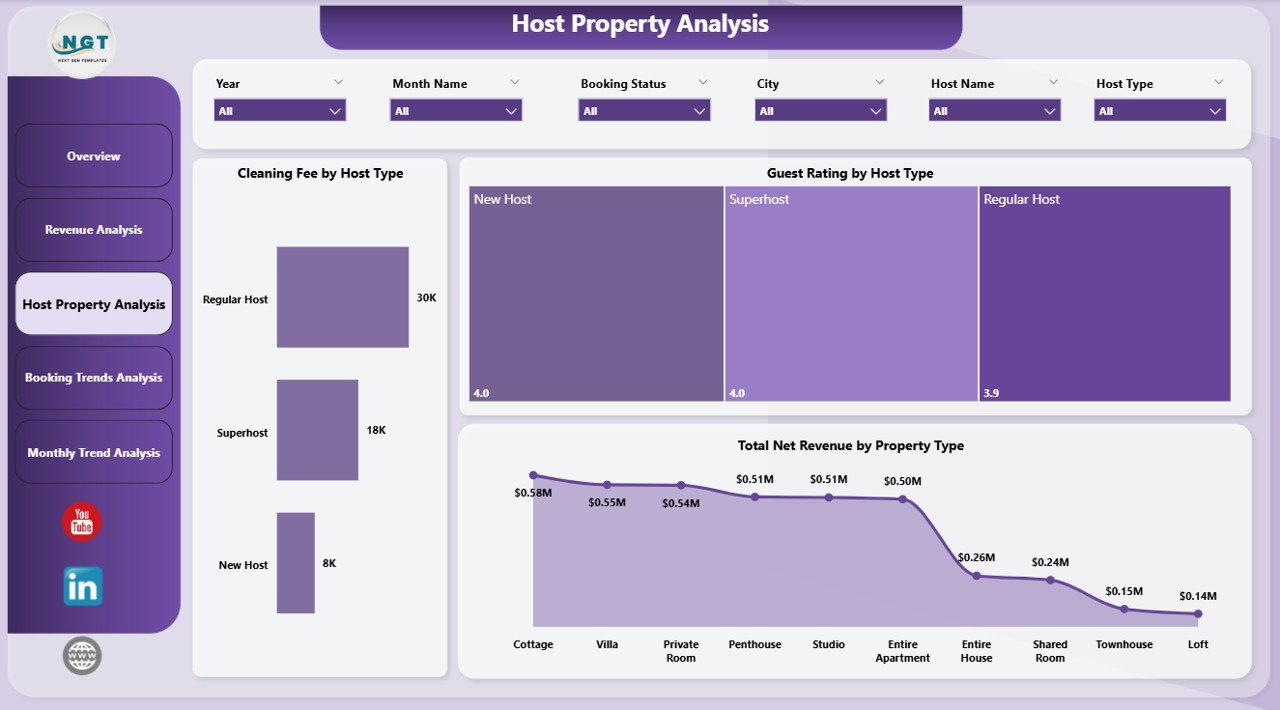
🏢 Host Property Analysis Page
Hosts and property types significantly influence rental performance. This page evaluates both host productivity and property performance.
Charts included:
• Total Net Revenue by Host Type
• Guest Rating by Host Type
• Total Net Revenue by Property Type
These insights help managers identify top-performing hosts and determine which property categories attract the highest revenue and guest satisfaction.
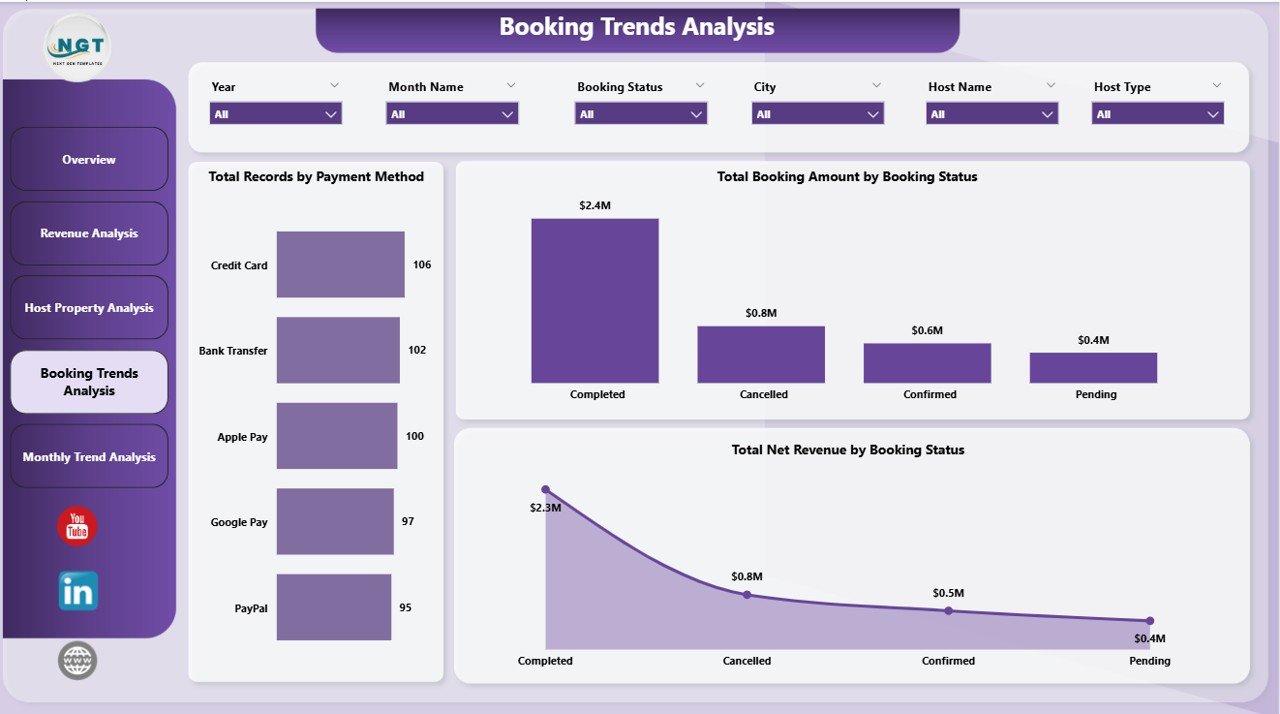
📊 Booking Trends Analysis Page
Understanding booking patterns helps rental businesses optimize marketing strategies and reduce cancellations.
Charts included:
• Total Net Revenue by Payment Method
• Total Booking Amount by Booking Status
• Total Net Revenue by Booking Status
These insights reveal preferred payment methods, cancellation patterns, and revenue contribution from completed bookings.
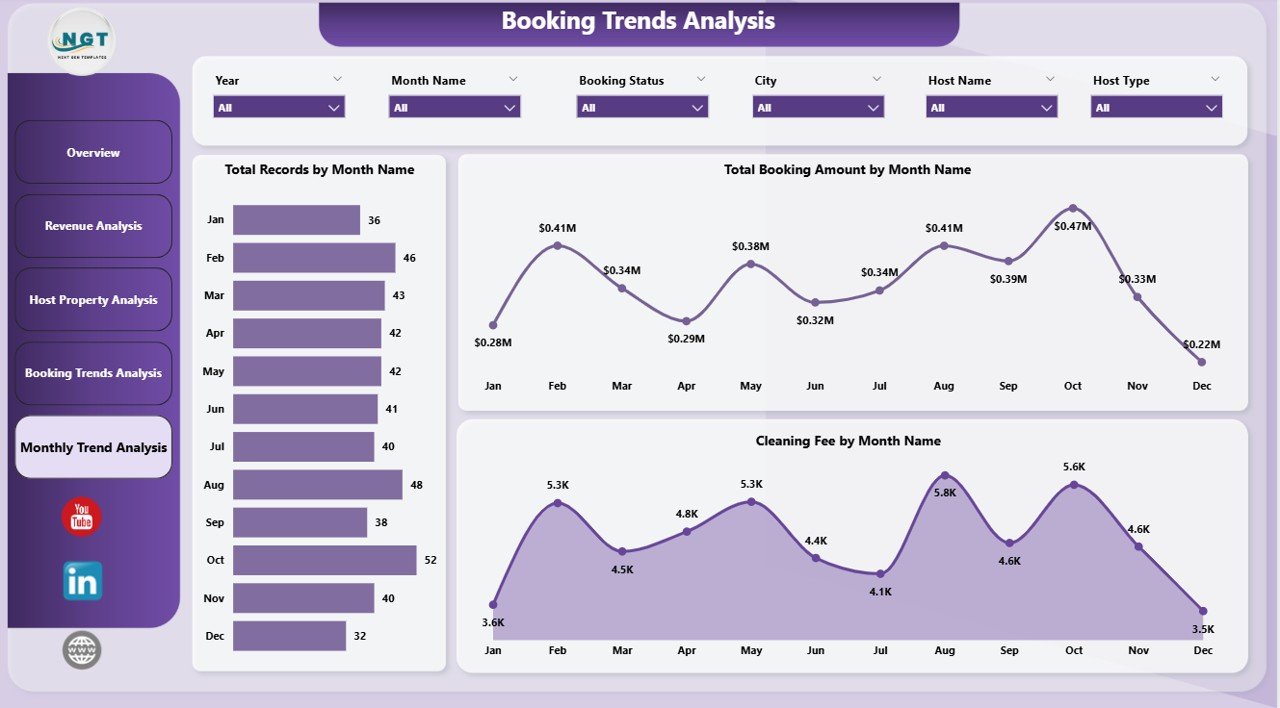
📅 Month Analysis Page
Seasonal demand plays a major role in the rental industry. The Month Analysis page focuses on time-based trends.
Charts included:
• Total Net Revenue by Month
• Total Booking Amount by Month
• Cleaning Fee by Month
These insights help property managers identify peak travel seasons and plan pricing strategies accordingly.
⚙️ How to Use the Airbnb-style Rentals Dashboard in Power BI
Using this dashboard is simple and efficient.
1️⃣ Import booking and property datasets into Power BI.
2️⃣ Ensure data includes fields such as city, property type, host type, booking status, revenue, and ratings.
3️⃣ Use slicers to filter data dynamically.
4️⃣ Analyze rental insights across different analytical pages.
5️⃣ Refresh the dataset regularly to keep insights up-to-date.
Within minutes, rental businesses can convert raw booking data into meaningful analytics.
👨💼 Who Can Benefit from This Airbnb-style Rentals Dashboard in Power BI
This dashboard is ideal for professionals involved in short-term rental operations.
🏠 Airbnb Hosts – Track booking trends and revenue performance.
🏢 Property Managers – Analyze rental portfolios across multiple cities.
📊 Rental Agencies – Monitor host productivity and property profitability.
📈 Hospitality Analysts – Study booking behavior and market demand.
💼 Vacation Rental Businesses – Optimize pricing and operational strategies.
🎓 Business Analysts & Students – Learn short-term rental analytics and Power BI reporting.
Organizations using this dashboard gain better business visibility, improved revenue monitoring, and faster decision-making capabilities.
Click hare to read the Detailed blog post
Visit our YouTube channel to learn step-by-step video tutorials
https://youtube.com/@PKAnExcelExpert