
Managing virtual office services and outsourced accounting operations requires continuous monitoring of performance indicators. Businesses providing virtual office solutions must track service efficiency, operational costs, client satisfaction, billing performance, and service delivery metrics. However, when companies rely on scattered spreadsheets or manual reporting, analyzing performance becomes time-consuming and error-prone.
Decision-makers need a centralized system that helps them monitor KPIs clearly, compare results against targets, and identify trends quickly. This is where the Virtual Office Services KPI Dashboard in Excel becomes extremely valuable.
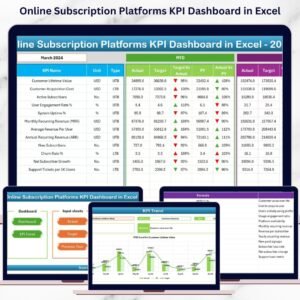
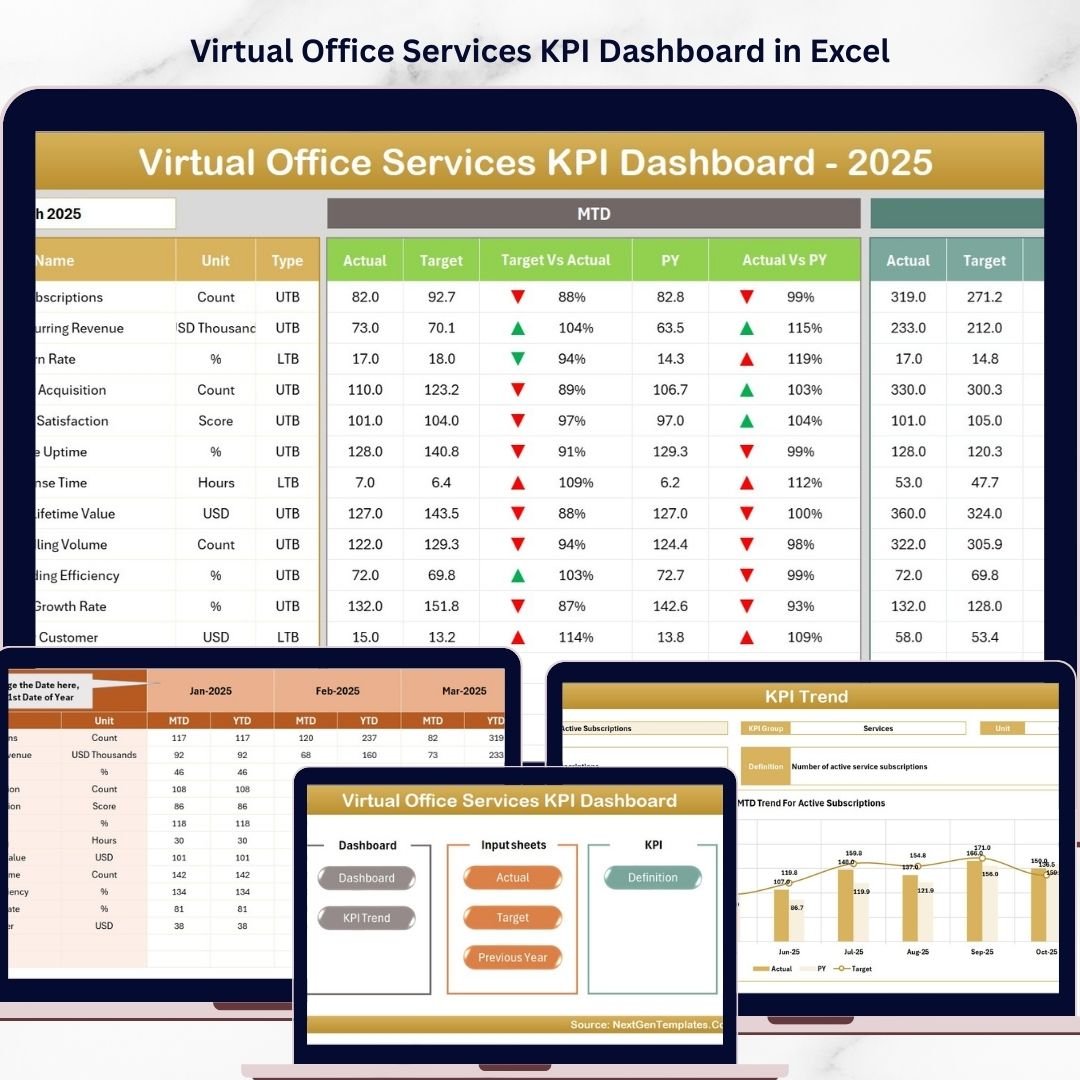
The Virtual Office Services KPI Dashboard in Excel is a ready-to-use analytical template designed to help businesses monitor outsourced accounting and virtual office service performance effectively. The dashboard transforms complex data into easy-to-understand visual insights through KPI cards, trend charts, and automated comparisons.
Instead of compiling multiple reports manually, this dashboard consolidates KPI tracking into a single structured interface. With dynamic month selection, automated calculations, and visual indicators, organizations can instantly evaluate performance and identify areas for improvement.
Whether you manage virtual office services, outsourced accounting operations, remote business services, or financial service teams, this Excel dashboard provides a practical solution to monitor operational performance and improve decision-making.
By converting raw data into meaningful KPI insights, organizations gain greater transparency, improve service quality, and enhance operational efficiency.
🚀 Key Feature of Virtual Office Services KPI Dashboard in Excel
📊 Interactive KPI Monitoring Dashboard

Track all virtual office service KPIs in one structured dashboard with dynamic visualizations and automated calculations.
📅 Dynamic Month Selection
Choose any month from the drop-down menu and instantly update the entire dashboard to view that period’s performance.
📈 MTD and YTD KPI Tracking
Monitor Month-To-Date (MTD) and Year-To-Date (YTD) performance indicators for comprehensive KPI evaluation.
🎯 Target vs Actual Performance Comparison
Quickly identify performance gaps by comparing actual results with predefined targets.
📉 Previous Year Comparison
Evaluate year-over-year growth and performance trends using historical KPI data.
🔺 Visual Performance Indicators
Conditional formatting arrows highlight whether KPIs are improving or declining.
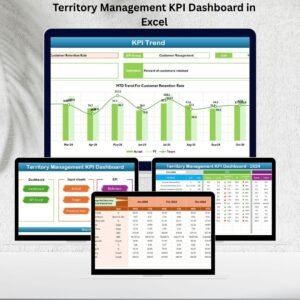
📊 KPI Trend Analysis Charts
Interactive trend charts help analyze KPI performance across months.
📘 Detailed KPI Definitions and Formulas
Each KPI includes definitions, formulas, measurement units, and KPI types for better understanding.
⚡ User-Friendly Navigation System
Quick navigation buttons allow users to move between sheets easily.
📁 Organized Data Input Structure
Separate sheets for Actual, Target, and Previous Year data simplify KPI updates.
📊 What’s Inside the Virtual Office Services KPI Dashboard in Excel
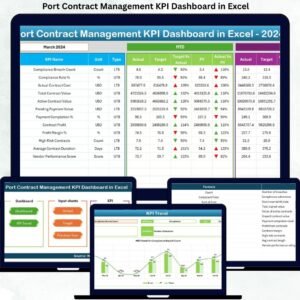
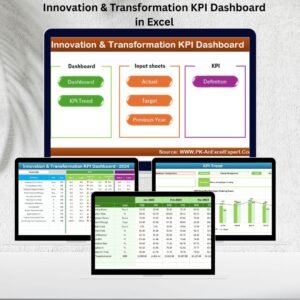
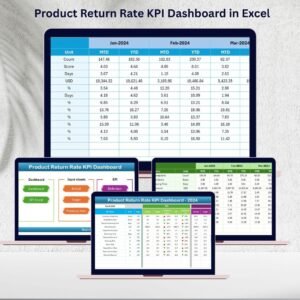
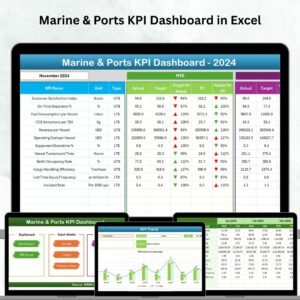
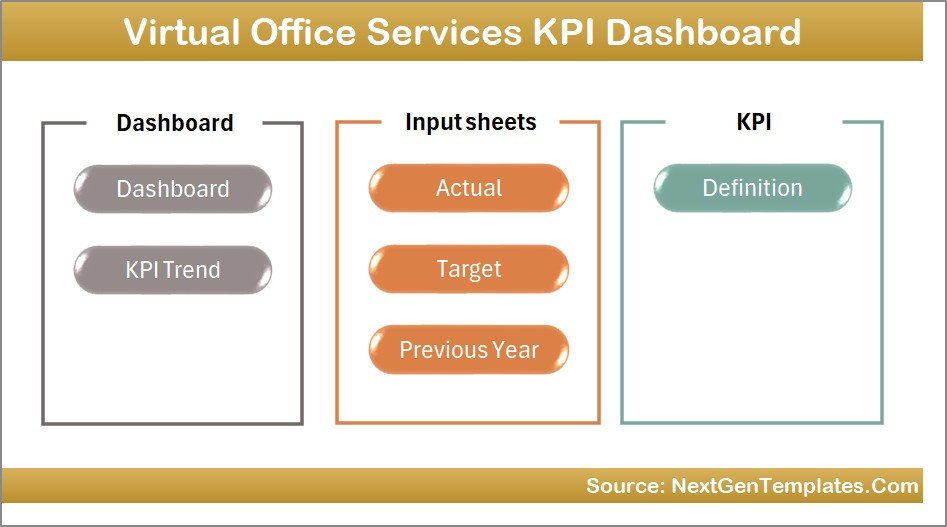
This Excel dashboard contains seven structured worksheets designed to provide a complete KPI monitoring system.
🏠 Home Sheet – Dashboard Navigation Hub
The Home sheet acts as the index page of the dashboard. It contains navigation buttons that allow users to quickly move to different worksheets within the dashboard.
This feature makes navigation smooth and improves the user experience.
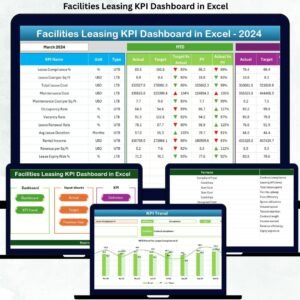
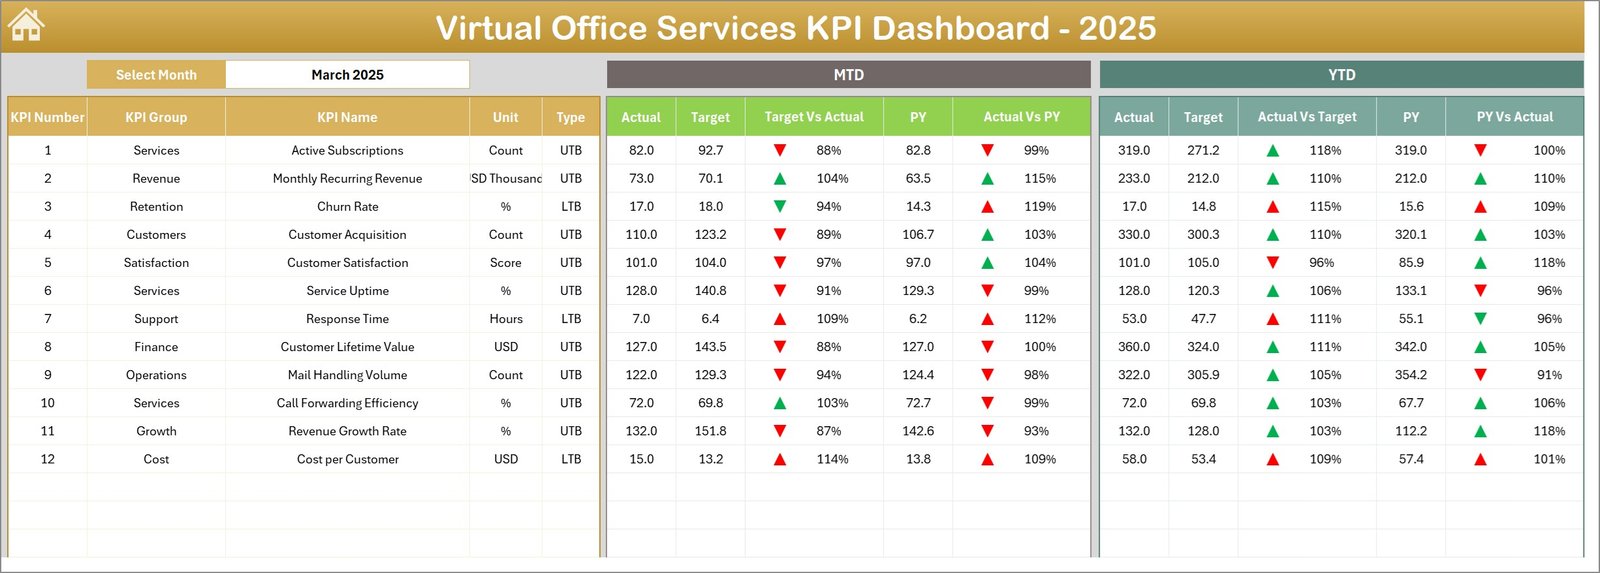
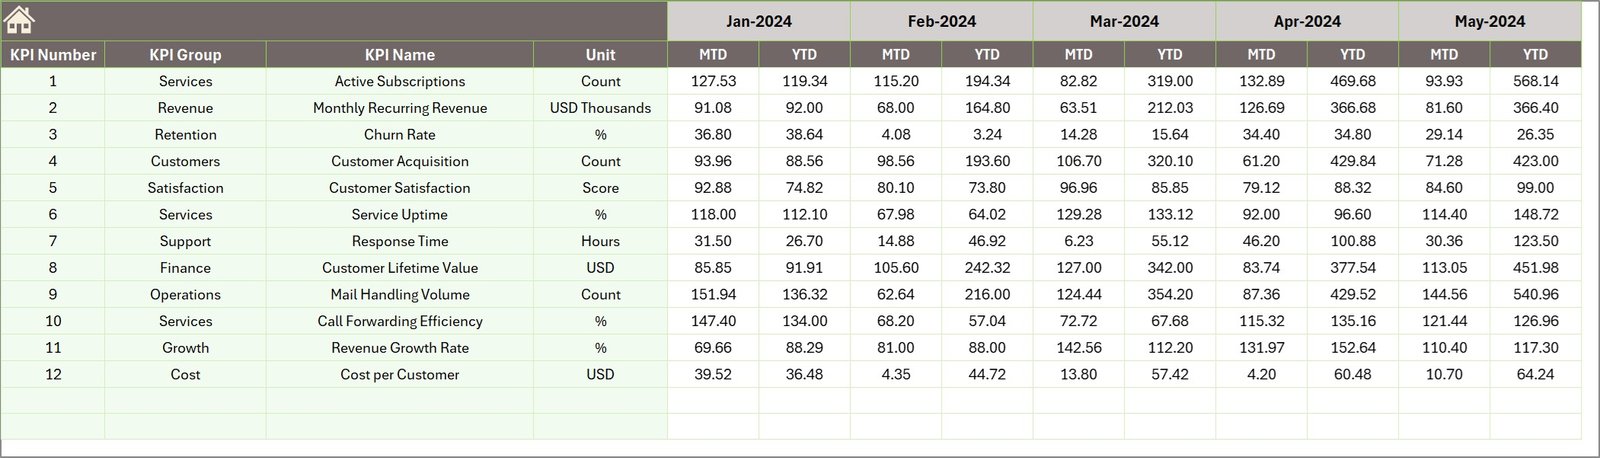
📊 Dashboard Sheet – Main KPI Performance Overview
This is the core page of the dashboard where all key performance indicators are displayed.
Users can select a month from the drop-down located in cell D3, which automatically updates the entire dashboard.
The dashboard displays:
• MTD Actual, Target, and Previous Year values
• Target vs Actual comparisons with visual arrows
• Previous Year vs Actual comparisons
• YTD Actual, Target, and Previous Year metrics
This page provides a quick snapshot of business performance.
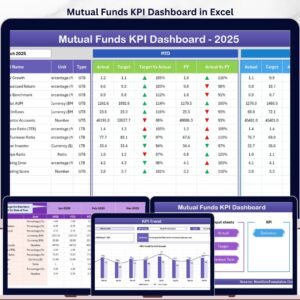
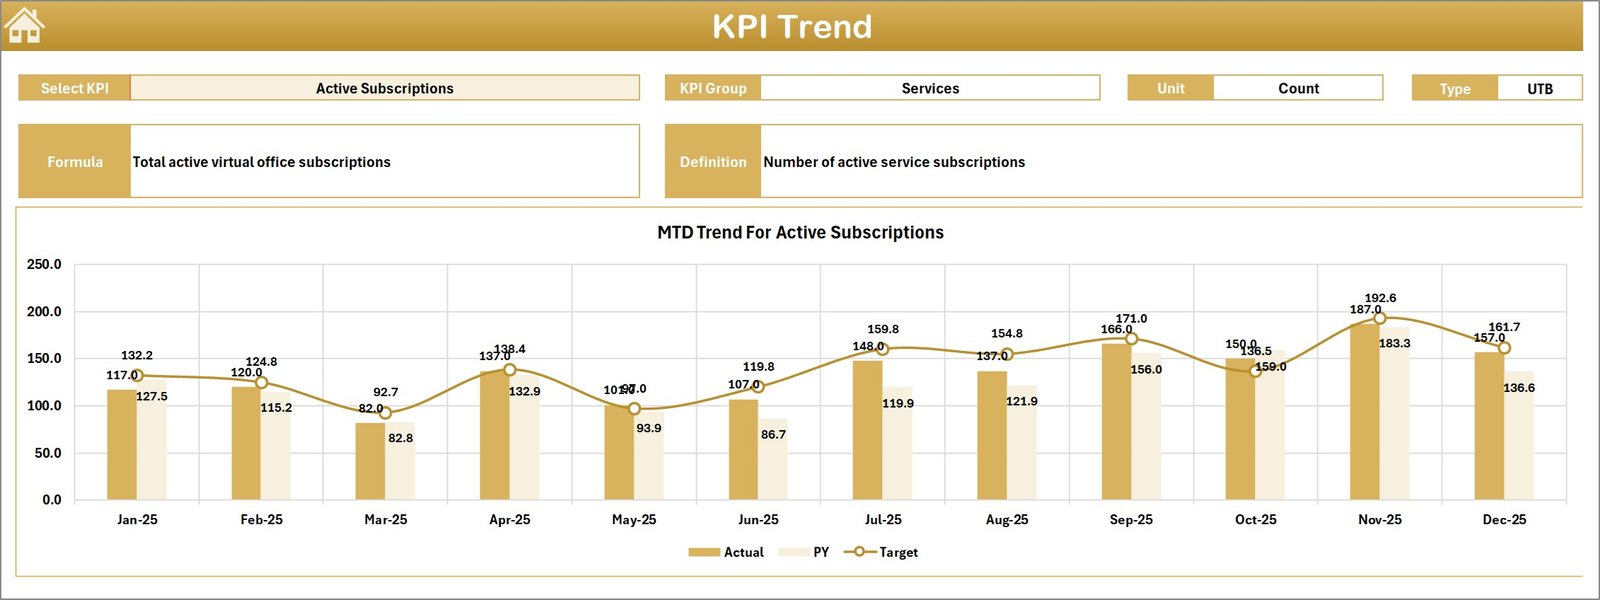
📈 KPI Trend Sheet – Performance Trend Analysis
This sheet allows users to select a specific KPI using a drop-down in cell C3.
Once selected, the dashboard displays:
• KPI Group
• Unit of Measurement
• KPI Type (Lower the Better or Upper the Better)
• KPI Formula
• KPI Definition
Additionally, MTD and YTD trend charts illustrate performance trends for Actual, Target, and Previous Year values.
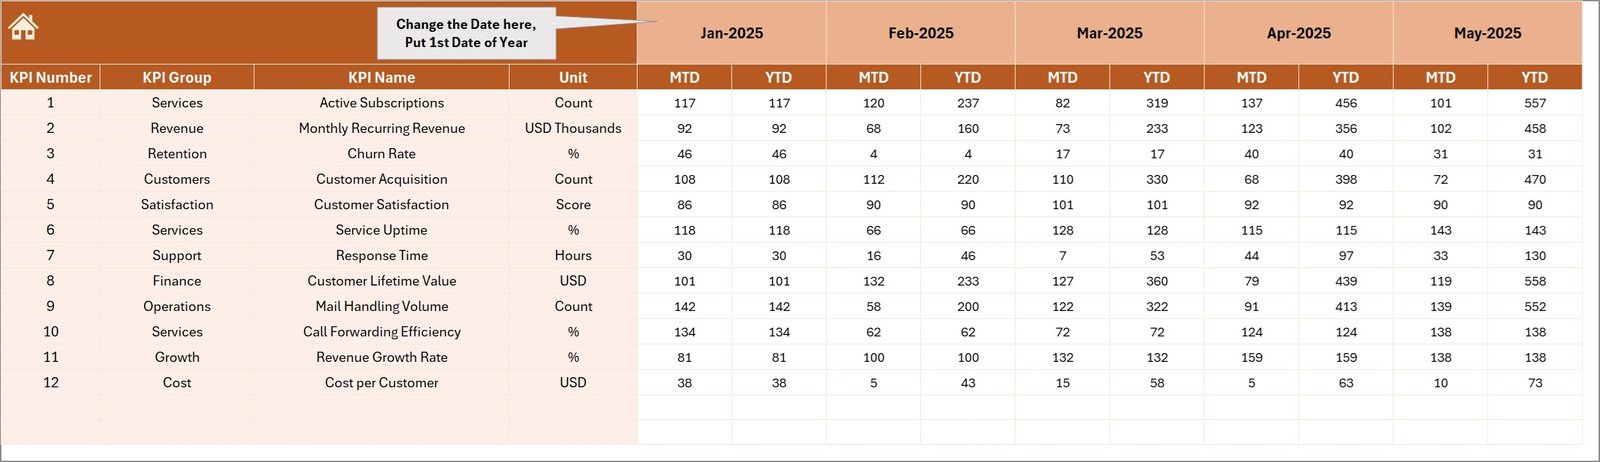
📥 Actual Numbers Input Sheet
This sheet allows users to enter actual KPI values for both MTD and YTD periods.
Users can also adjust the reporting month starting from the value in cell E1.
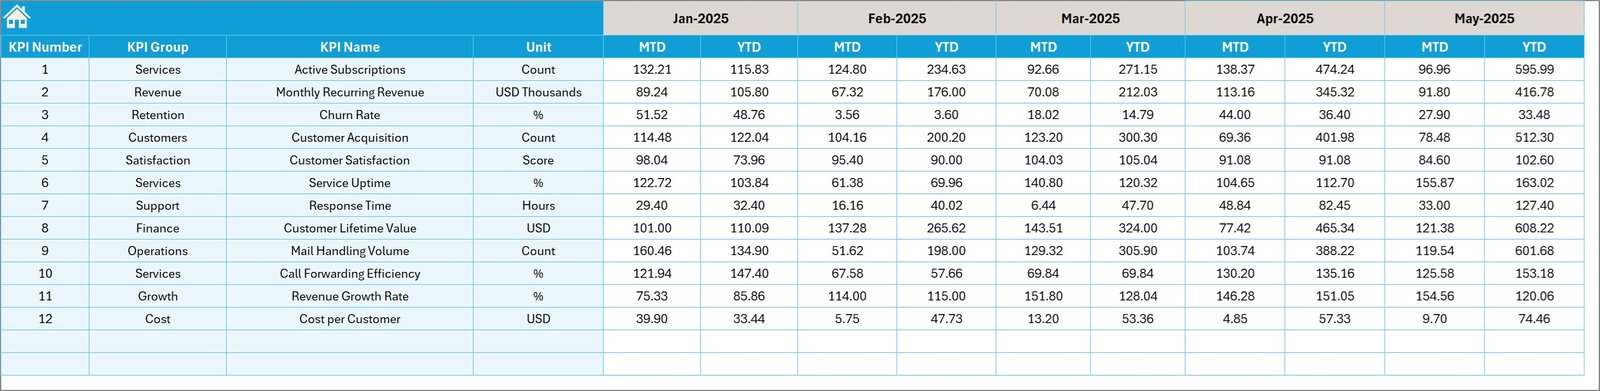
🎯 Target Number Input Sheet
In this sheet, users enter the KPI targets for each period.
These targets serve as benchmarks against which actual performance is evaluated.
📊 Previous Year Number Sheet
This worksheet stores historical KPI data from the previous year.
This information helps the dashboard generate year-over-year comparisons.
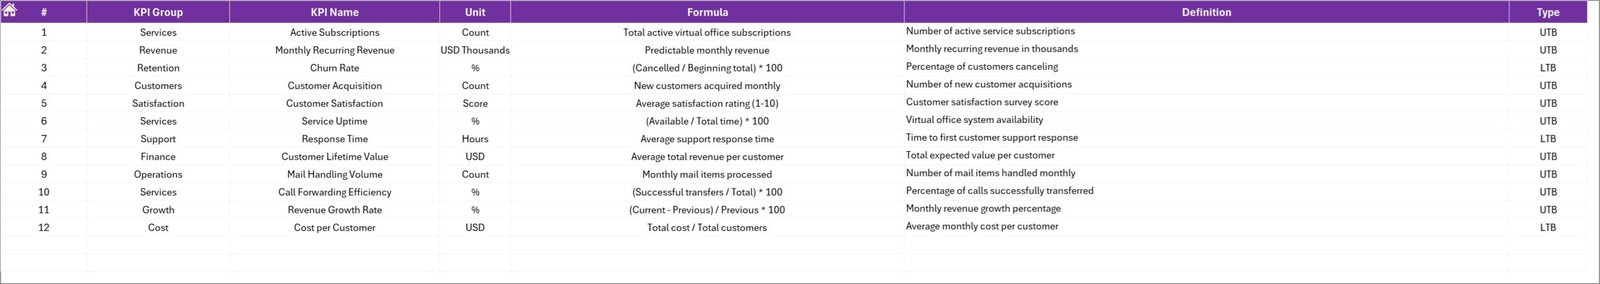
📘 KPI Definition Sheet
This sheet contains detailed information about each KPI, including:
• KPI Name
• KPI Group
• Measurement Unit
• Formula
• KPI Definition
• KPI Type (UTB – Upper The Better or LTB – Lower The Better)
This sheet acts as the foundation of the KPI system.
⚙️ How to Use the Virtual Office Services KPI Dashboard in Excel
Using the dashboard is simple and does not require advanced Excel skills.
1️⃣ Enter KPI definitions in the KPI Definition Sheet.
2️⃣ Input target KPI values in the Target sheet.
3️⃣ Add previous year KPI data for comparisons.
4️⃣ Enter actual KPI numbers regularly in the Actual sheet.
5️⃣ Select the desired month in the dashboard to analyze performance automatically.
Within minutes, organizations can convert raw data into powerful performance insights.
👨💼 Who Can Benefit from This Virtual Office Services KPI Dashboard in Excel
This dashboard is ideal for professionals managing virtual office operations and outsourced accounting services.
🏢 Virtual Office Service Providers – Monitor operational efficiency and service performance.
📊 Outsourced Accounting Firms – Track client KPIs and financial service metrics.
💼 Business Process Outsourcing Companies – Evaluate operational performance across service teams.
📈 Operations Managers – Monitor service delivery and performance indicators.
👨💻 Consultants & Business Analysts – Provide data-driven insights to clients.
🎓 Finance & Management Students – Learn KPI monitoring and business performance analysis.
Organizations using this dashboard gain better performance visibility, improved operational control, and faster decision-making capabilities.
Click hare to read the Detailed blog post
Visit our YouTube channel to learn step-by-step video tutorials
https://youtube.com/@PKAnExcelExpert