Managing performance in Shared Services Centers requires continuous monitoring of service quality, operational efficiency, and KPI performance. Organizations that rely on shared services for finance, HR, procurement, IT support, and administrative functions must ensure that their teams consistently meet performance targets while maintaining high service standards.
However, many organizations struggle with scattered reports, complex spreadsheets, and manual KPI tracking. As a result, managers often find it difficult to evaluate performance trends, identify service bottlenecks, and take timely corrective actions.
This is exactly where the Shared Services Centers KPI Dashboard in Power BI becomes extremely valuable.
The Shared Services Centers KPI Dashboard in Power BI is a powerful and ready-to-use analytics solution designed to help organizations track service performance, monitor KPI achievement, and analyze operational efficiency across different departments and KPI groups. The dashboard converts raw KPI data stored in Excel into visually engaging and interactive Power BI reports.
By using this dashboard, decision-makers can instantly identify which KPIs are meeting targets, which ones require improvement, and how performance trends change over time.
Whether you manage finance shared services, HR support centers, IT help desks, or procurement operations, this dashboard provides the clarity and insights required to make faster and smarter business decisions.
🚀 Key Feature of Shared Services Centers KPI Dashboard in Power BI
📊 Interactive KPI Monitoring
Track all critical shared service KPIs in a single Power BI dashboard with interactive slicers and filters.
📅 Month and KPI Group Filters
Easily analyze performance by selecting specific months and KPI categories.
📈 Target vs Actual Performance Tracking
Compare actual KPI performance against predefined targets to evaluate service efficiency.
📉 MTD Target Achievement Analysis
Instantly see which KPIs have met or missed their Month-to-Date targets.
📋 Comprehensive KPI Table View
View detailed KPI data including KPI name, group, unit, and performance values.
⚡ Automated Data Visualization
Transform raw Excel data into meaningful insights using dynamic Power BI visuals.
🔍 Performance Transparency
Quickly identify underperforming KPIs and take corrective actions.
📊 Decision-Making Support
Empower managers with actionable insights for operational improvements.
📦 What’s Inside the Shared Services Centers KPI Dashboard in Power BI
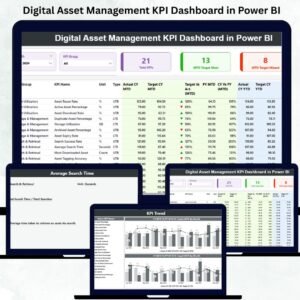
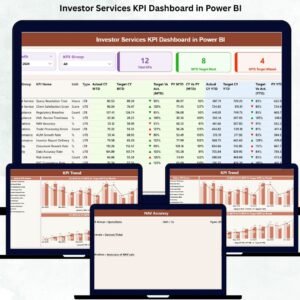
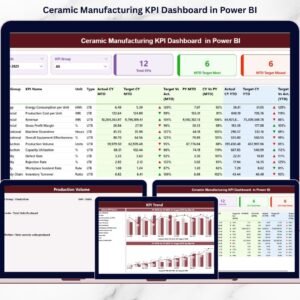
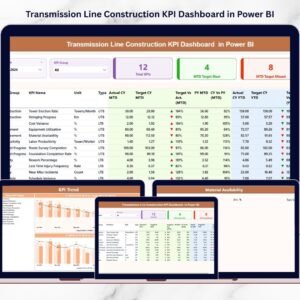
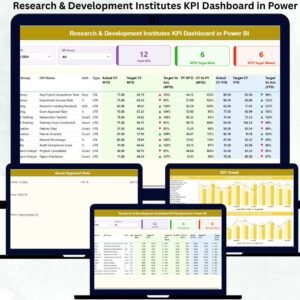
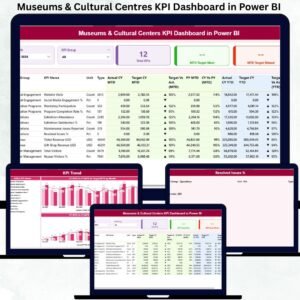
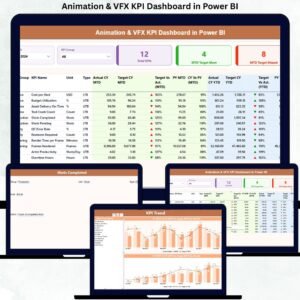
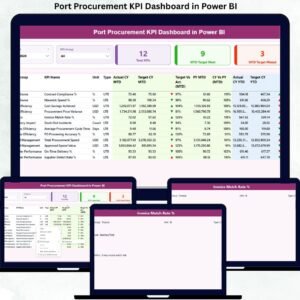
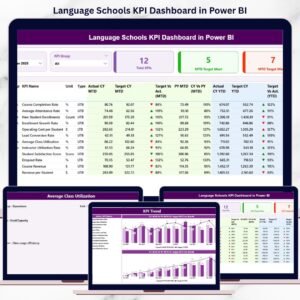
This ready-to-use Power BI template includes 3 powerful analytical pages designed to provide comprehensive KPI monitoring.
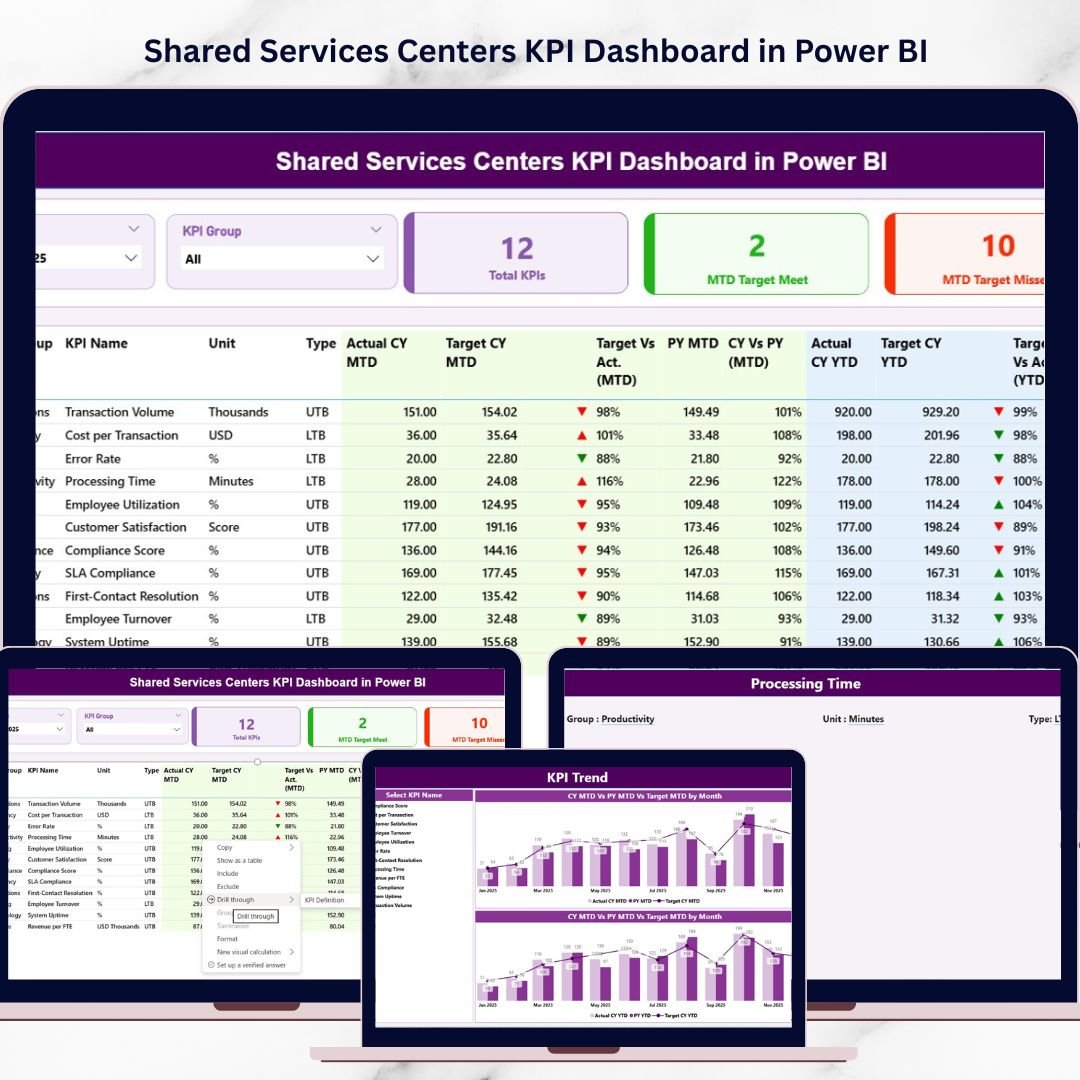
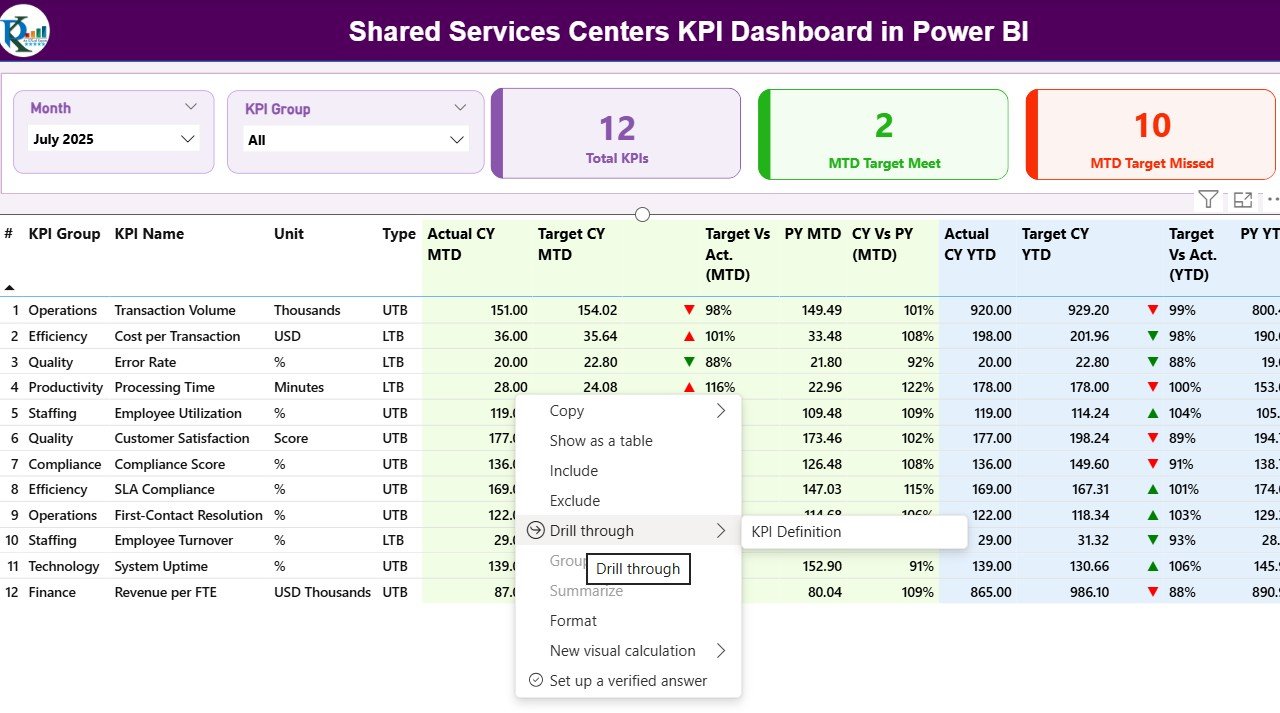
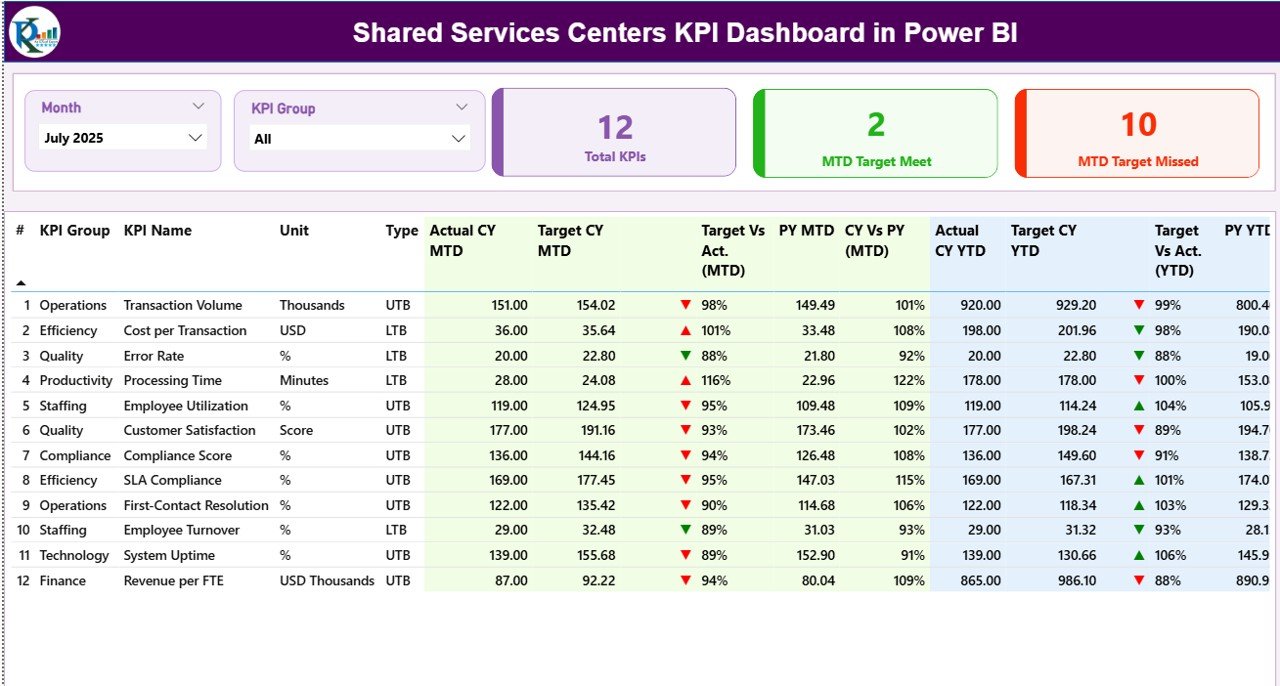
1️⃣ Summary Page
This is the main dashboard page where users can monitor overall KPI performance.
Key highlights include:
• Month Slicer for selecting the reporting period
• KPI Group Filter to analyze performance by category
• Total KPI Count Card showing the number of KPIs tracked
• MTD Target Meet Card indicating KPIs that achieved targets
• MTD Target Missed Card highlighting KPIs below target
Below the KPI cards, a detailed KPI table displays important metrics such as:
-
KPI Number
-
KPI Group
-
KPI Name
-
Unit of Measurement
-
KPI Type (LTB or UTB)
-
Actual CY MTD
-
Target CY MTD
This allows managers to quickly evaluate KPI performance across the organization.
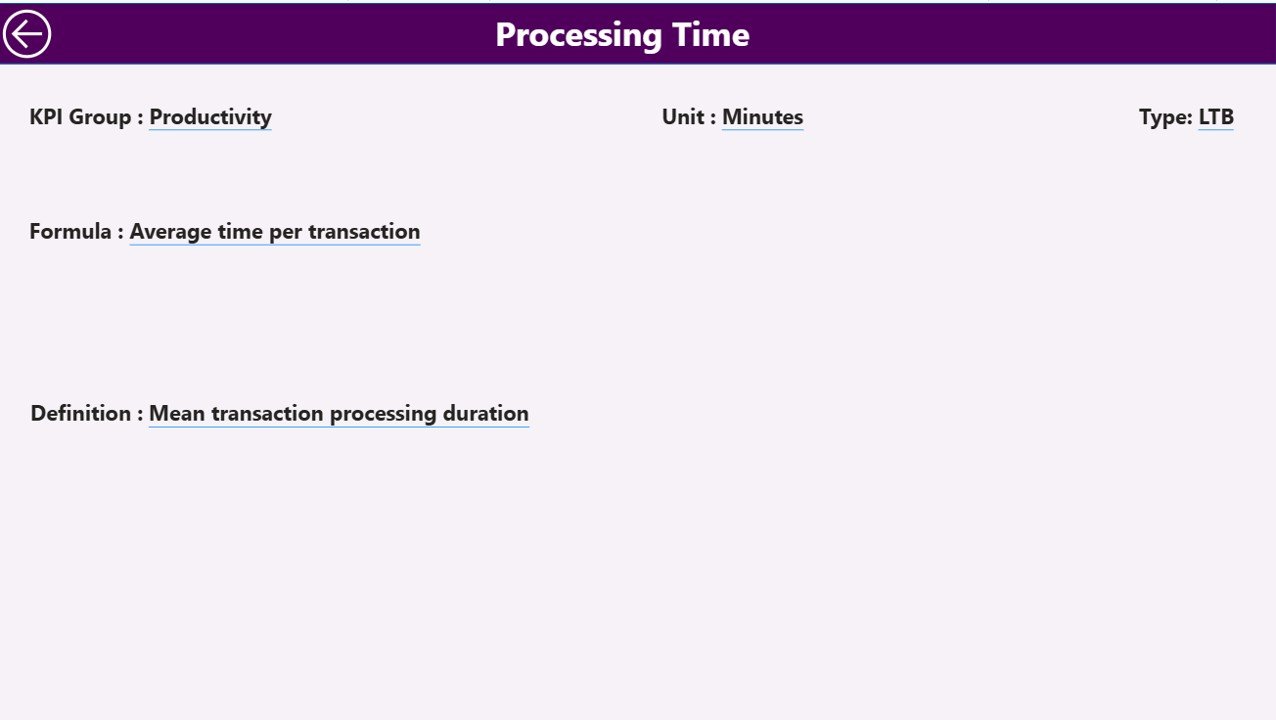
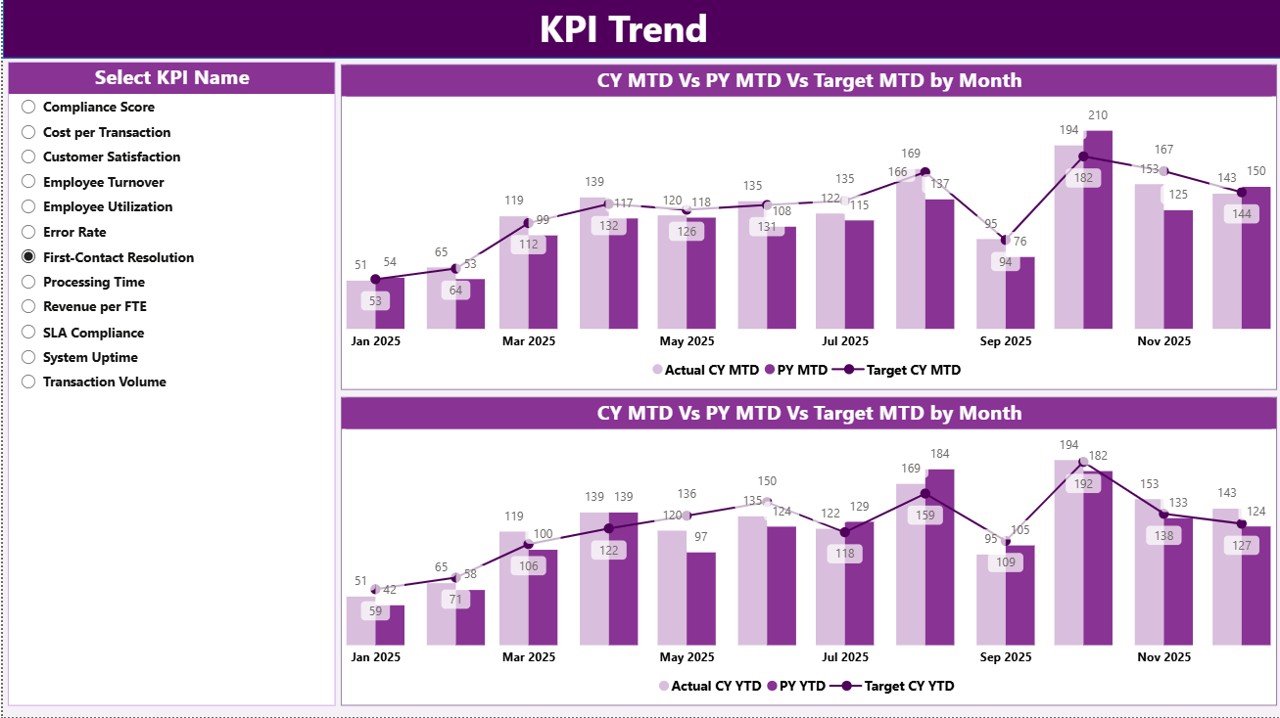
2️⃣ KPI Trend Analysis Page
This page focuses on analyzing how KPI performance changes over time.
Users can select specific KPIs and track their performance trends across multiple months. This helps identify patterns, performance fluctuations, and improvement opportunities.
3️⃣ KPI Group Performance Page
This page provides insights into KPI performance by category or department.
Managers can evaluate which service groups are performing well and which require attention. This helps leadership prioritize improvement initiatives.
⚙️ How to Use the Shared Services Centers KPI Dashboard in Power BI
Using this dashboard is extremely simple and does not require advanced Power BI skills.
Step 1: Enter or update KPI data in the provided Excel data source.
Step 2: Open the Power BI file and refresh the dataset.
Step 3: Use the Month and KPI Group slicers to filter the data.
Step 4: Analyze KPI performance using the summary cards, tables, and charts.
Within seconds, you can generate professional KPI reports and performance insights.
👨💼 Who Can Benefit from This Shared Services Centers KPI Dashboard in Power BI
This dashboard is ideal for organizations that operate shared service functions and need a structured KPI monitoring system.
It is especially useful for:
🏢 Shared Services Managers – Monitor operational performance across departments.
📊 Business Analysts – Analyze service performance trends and identify improvement opportunities.
💼 Operations Leaders – Track efficiency metrics and improve service delivery.
🏦 Finance Shared Services Teams – Monitor financial process performance and efficiency.
🧑💻 IT Service Centers – Track help desk KPIs and service response performance.
🏭 Enterprise Organizations – Manage centralized service functions more effectively.
If your organization relies on shared service operations, this dashboard can dramatically improve performance visibility and decision-making.
Click here to read the Detailed blog post
Watch the step-by-step video tutorial: