Pipeline infrastructure projects require accurate monitoring, strong operational control, and data-driven decision-making. However, many organizations still depend on scattered spreadsheets and manual reports. As a result, managers struggle to evaluate operational performance, identify risks early, and track critical performance indicators.
That’s exactly where the Pipeline Infrastructure KPI Dashboard in Power BI becomes a powerful analytics solution.
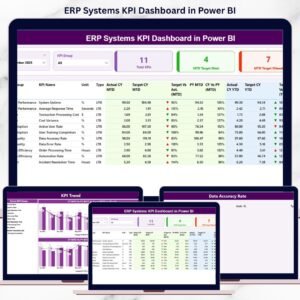
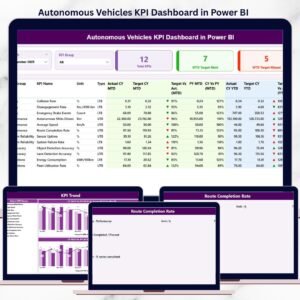
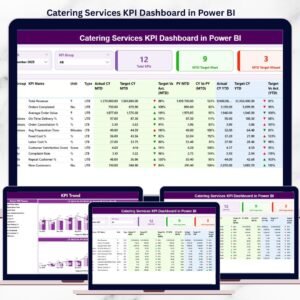
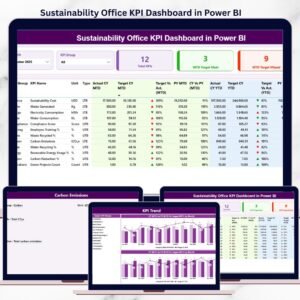
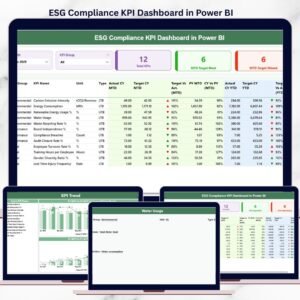
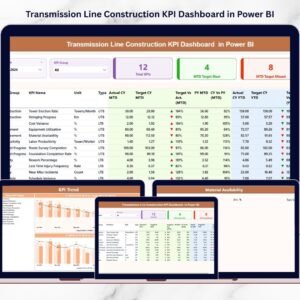
This ready-to-use Power BI dashboard helps organizations monitor pipeline operations, construction performance, maintenance activities, and safety metrics through interactive charts, KPI indicators, and trend analysis.
Instead of reviewing multiple reports, managers can analyze pipeline infrastructure KPIs from one centralized dashboard.
The dashboard connects Excel as the data source and Power BI as the visual analytics platform, allowing teams to update operational data easily and instantly view insights.
Whether you manage pipeline construction, maintenance operations, or infrastructure performance, this dashboard helps you track targets, analyze trends, and make smarter operational decisions.
🚀 Key Feature of Pipeline Infrastructure KPI Dashboard in Power BI
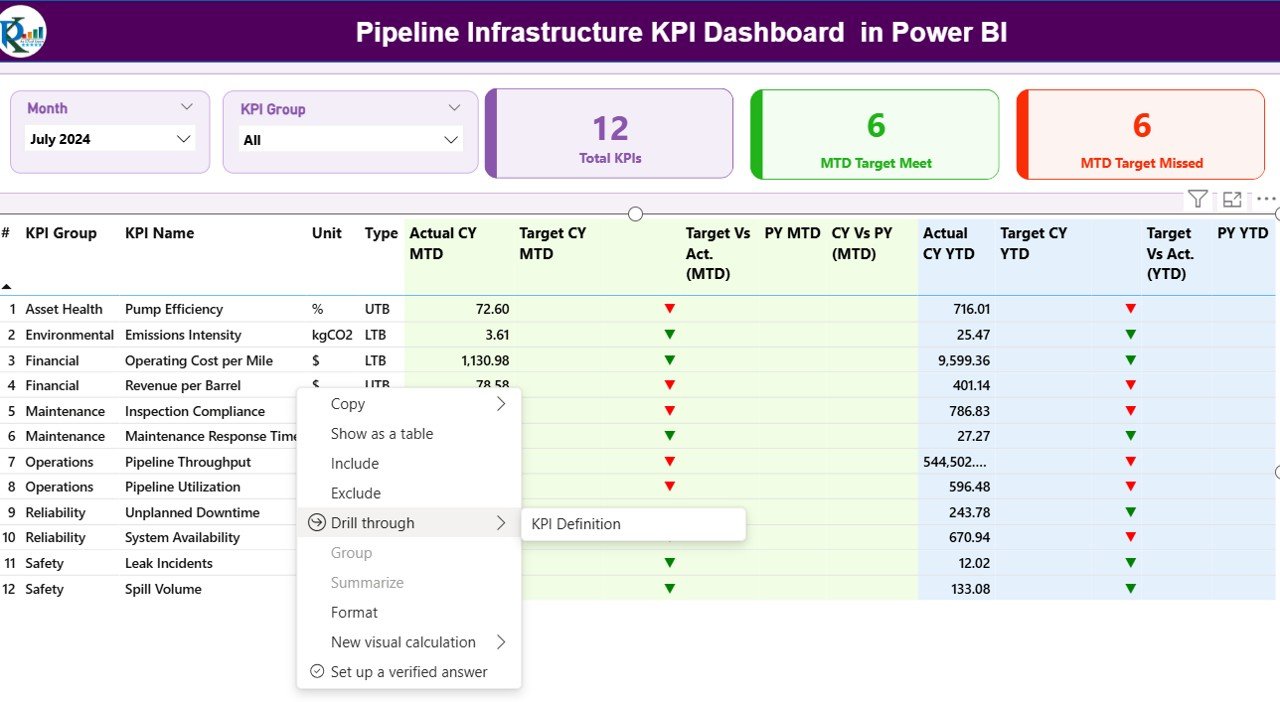
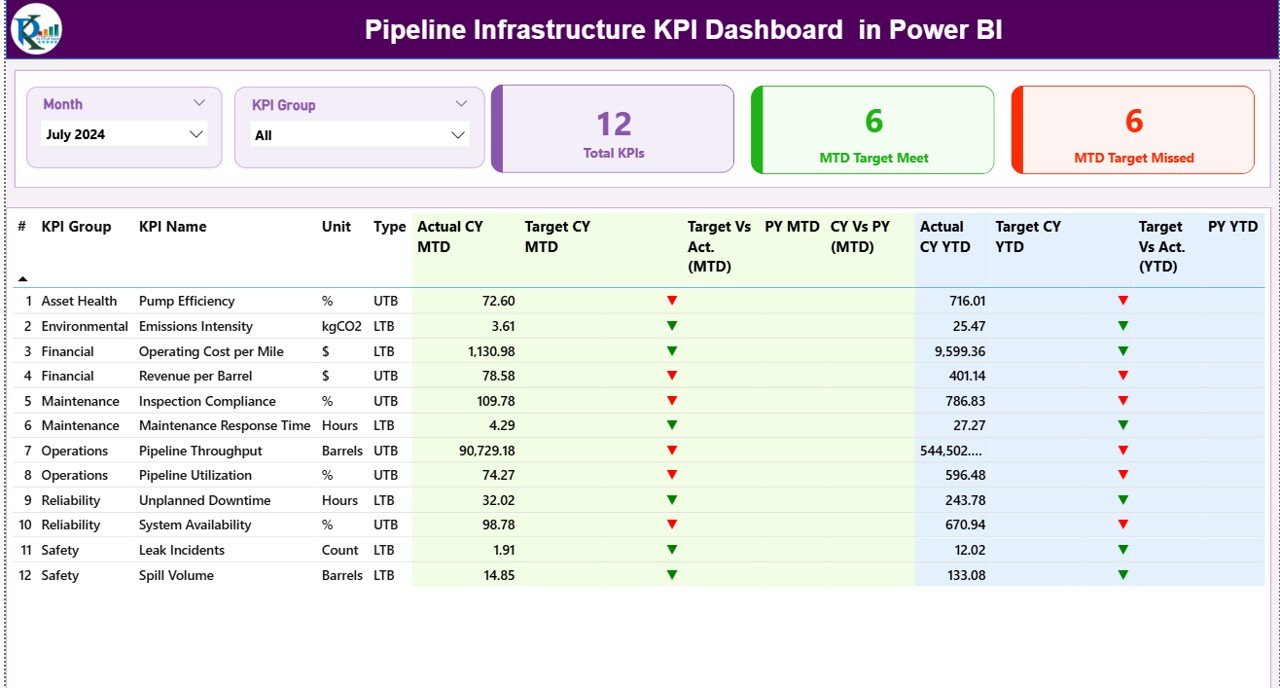
📊 Interactive KPI Summary Dashboard
Monitor all pipeline KPIs in a centralized interface with dynamic visuals and performance indicators.
📅 Month and KPI Group Filters
Instantly filter performance metrics by month and KPI category for deeper analysis.
📈 MTD and YTD Performance Monitoring
Track Month-to-Date and Year-to-Date performance against targets and previous year data.
🎯 Target vs Actual Performance Comparison
Quickly evaluate KPI performance with automated calculations and visual indicators.
📉 Visual Status Indicators
Green and red arrows highlight whether KPIs meet or miss their targets.
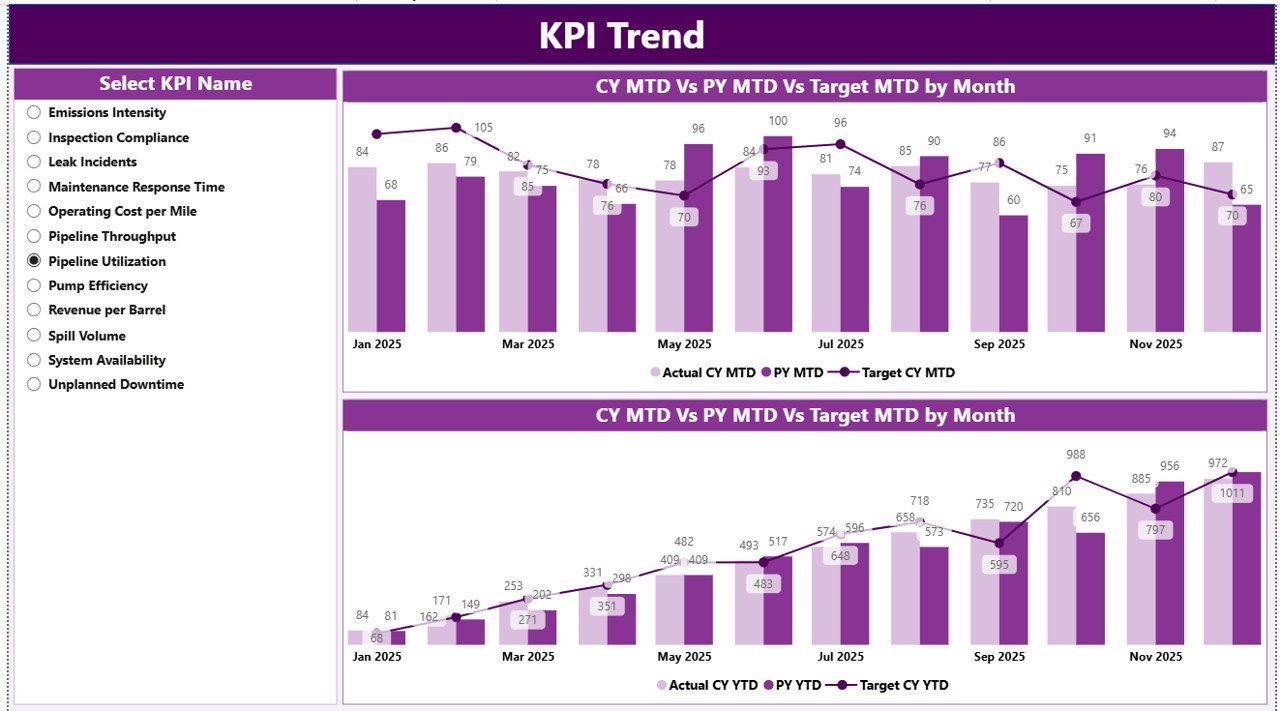
📊 KPI Trend Analysis Page
Analyze historical performance trends through dynamic combo charts.
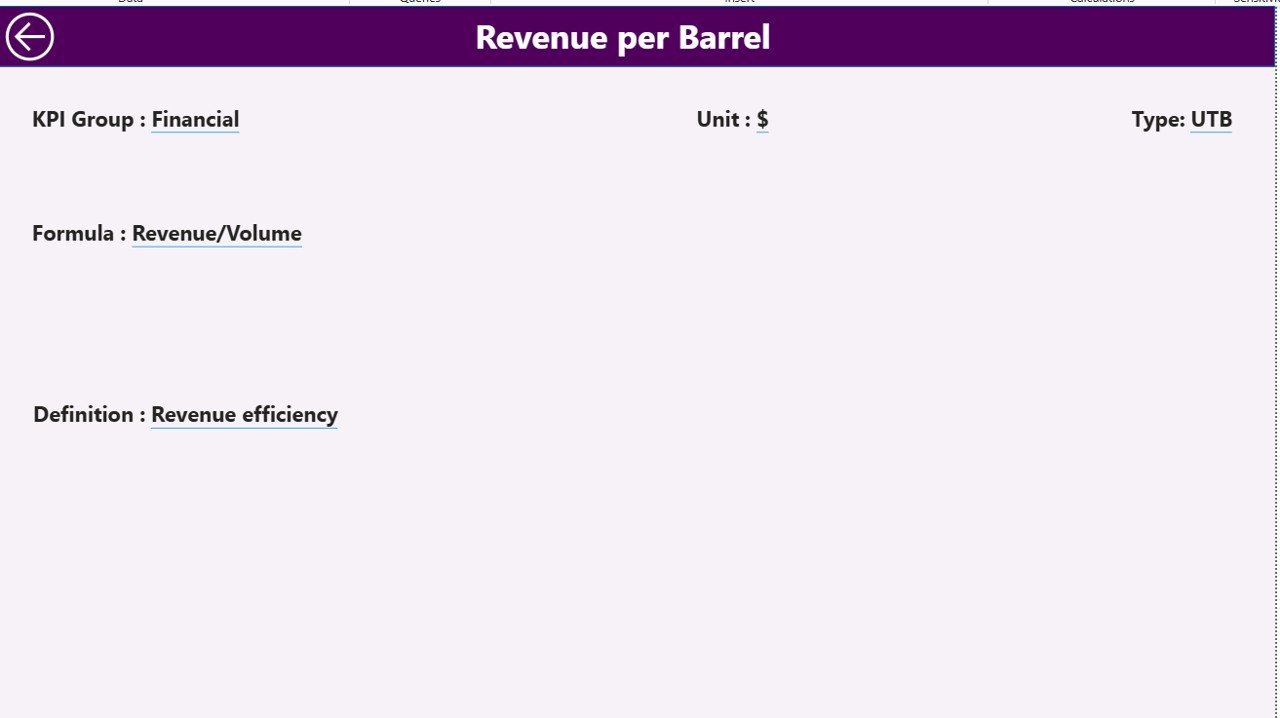
🔎 Drill-Through KPI Definition Page
Understand KPI formulas, definitions, and performance logic in detail.
📂 Excel Integrated Data Source
Update operational data easily in Excel and refresh the dashboard instantly in Power BI.
⚡ Real-Time Insights for Decision Making
Identify operational issues quickly and take corrective actions faster.
📊 Professional Power BI Visualization
Transform raw pipeline data into clear insights using interactive visuals and charts.
📦 What’s Inside the Pipeline Infrastructure KPI Dashboard in Power BI
This digital product includes a fully designed Power BI dashboard file with structured Excel data sources.
The package contains:
-
Power BI Dashboard File (.pbix)
-
Excel Data Source File
-
KPI Definition Table
-
Input_Actual Data Sheet
-
Input_Target Data Sheet
-
Summary Dashboard Page
-
KPI Trend Analysis Page
-
KPI Definition Drill-Through Page
The Excel file acts as the data input layer, where users simply enter KPI values. Once updated, Power BI refreshes the dashboard automatically.
This structure ensures that users can manage KPI data easily without modifying the dashboard design.
⚙️ How to Use the Pipeline Infrastructure KPI Dashboard in Power BI
Using this dashboard is simple and requires no advanced Power BI expertise.
Follow these steps:
1️⃣ Open the Excel data source file.
2️⃣ Enter KPI data in the Input_Actual sheet.
3️⃣ Update target values in the Input_Target sheet.
4️⃣ Maintain KPI definitions in the KPI Definition sheet.
5️⃣ Refresh the Power BI dashboard.
6️⃣ Use slicers to filter data by Month or KPI Group.
7️⃣ Analyze KPI performance through the Summary dashboard and Trend charts.
Within seconds, you can monitor pipeline infrastructure performance, evaluate KPI trends, and detect operational issues.
👨💼 Who Can Benefit from This Pipeline Infrastructure KPI Dashboard
This dashboard is designed for professionals who manage pipeline infrastructure operations and analytics.
It is ideal for:
🏗 Pipeline Project Managers – Monitor construction progress and operational performance.
⚙ Infrastructure Engineers – Track maintenance activities and operational KPIs.
📊 Data Analysts – Analyze KPI trends and performance insights.
🏢 Infrastructure Companies – Improve operational transparency and efficiency.
👨💼 Executive Leadership Teams – Monitor project performance and make strategic decisions.
📉 Operations Teams – Identify performance gaps and improve efficiency.
If your organization works with pipeline construction, maintenance, or infrastructure management, this dashboard provides valuable performance insights in a single interface.
Click here to read the Detailed blog post
Watch the step-by-step video tutorial: