Private equity firms operate in a highly competitive and performance-focused environment. Investors demand transparency, portfolio growth visibility, and clear insights into investment returns. However, many firms still rely on scattered spreadsheets or manually compiled reports. As a result, analyzing fund performance, portfolio efficiency, and operational metrics becomes slow and inefficient.
That’s where the Private Equity KPI Scorecard in Google Sheets becomes a powerful performance management tool 📊🚀.
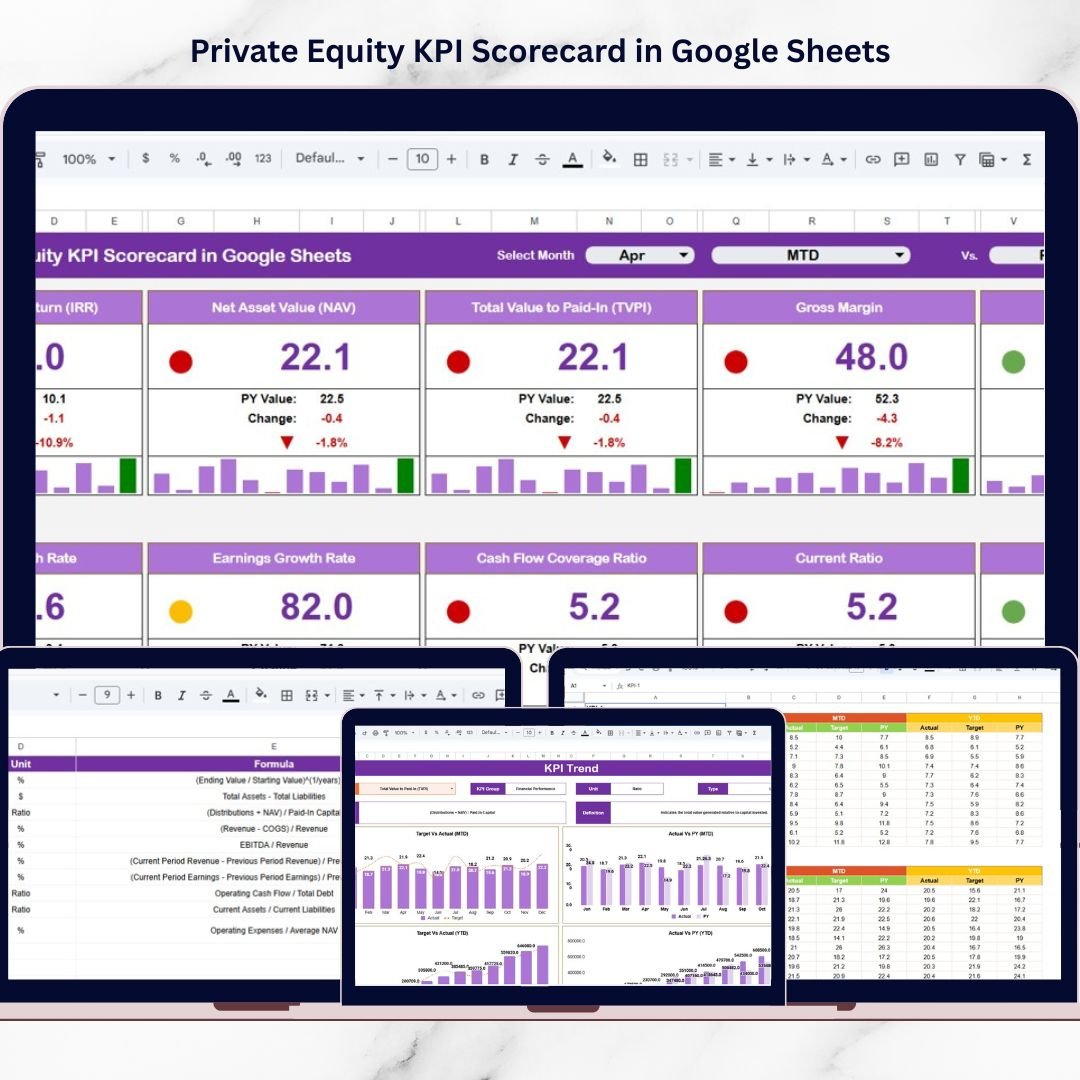
This ready-to-use scorecard transforms complex investment data into a structured and interactive reporting system. Instead of reviewing multiple reports, managers can monitor key investment KPIs, analyze performance trends, and evaluate fund performance from one centralized dashboard.
Built entirely in Google Sheets, this scorecard tracks 10 essential private equity KPIs, allowing fund managers and analysts to measure financial performance with clarity and speed.
Whether you manage a private equity fund, evaluate portfolio companies, or analyze investment returns, this KPI scorecard helps turn data into actionable insights.
🚀 Key Feature of Private Equity KPI Scorecard in Google Sheets
📊 Centralized Investment Performance Dashboard – Track all key private equity KPIs in one interactive scorecard.
📅 Month Selection Control – Choose a month from a dropdown and instantly update all KPI metrics.
📈 MTD & YTD Performance Tracking – Monitor both monthly and cumulative investment performance.
🚦 Traffic Light Performance Indicators – Visual signals (Green, Yellow, Red) highlight KPI performance levels.
📉 Up & Down KPI Movement Indicators – Arrows show percentage changes compared to previous periods.
📊 KPI Trend Analysis – Visual charts help analyze long-term performance trends.
⚙️ Automated Calculations – Google Sheets formulas update metrics automatically when data is entered.
📚 KPI Documentation System – Maintain clear definitions and formulas for each KPI.
Because of these features, investment managers can quickly identify strengths, weaknesses, and growth opportunities within their portfolios.
📦 What’s Inside the Private Equity KPI Scorecard in Google Sheets?
This scorecard includes five structured worksheets that organize KPI data and performance analysis efficiently.
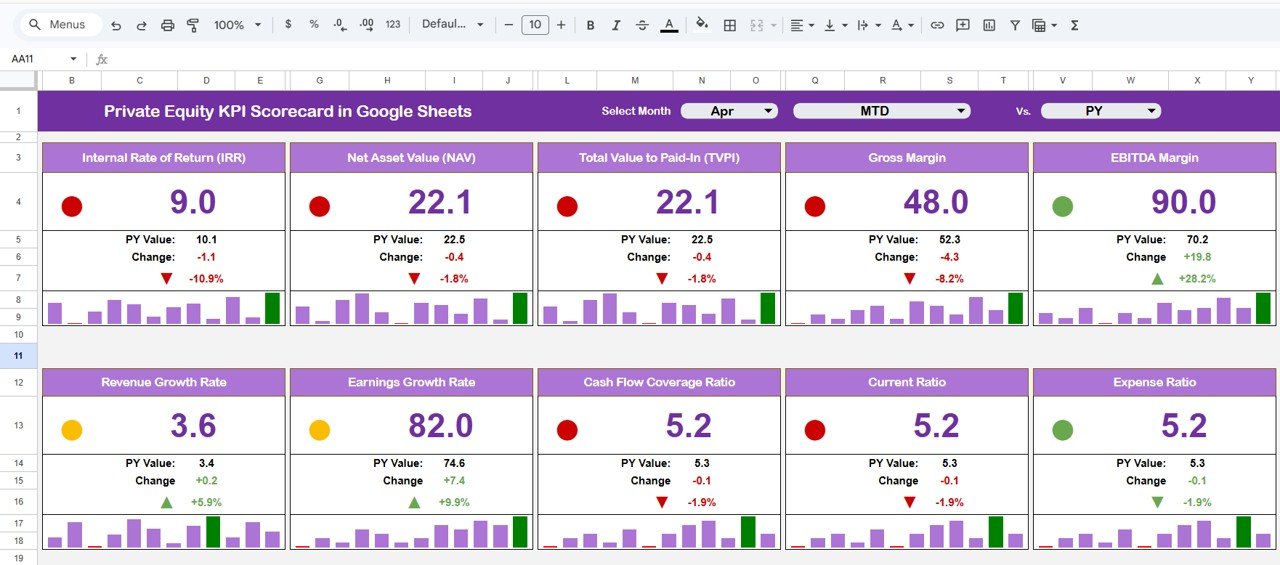
1️⃣ KPI Scorecard Dashboard – Main Performance Overview
The Scorecard Dashboard serves as the central reporting interface.
At the top of the dashboard, users can select a month from a dropdown menu. Once the month is selected, the entire scorecard updates automatically.
The dashboard displays:
• KPI Actual Value
• KPI Target Value
• KPI Previous Month Value
• Percentage Change
It also includes visual indicators such as:
🚦 Traffic Light Performance Indicators
⬆️⬇️ Up and Down Arrows Showing KPI Movement
These visual signals allow managers to quickly interpret performance levels.
2️⃣ MTD and YTD Performance Views
The scorecard supports two analytical perspectives.
MTD (Month-to-Date)
Displays KPI performance for the selected month.
YTD (Year-to-Date)
Shows cumulative KPI performance from the beginning of the year.
Users can easily switch between these views to analyze both short-term and long-term investment performance.
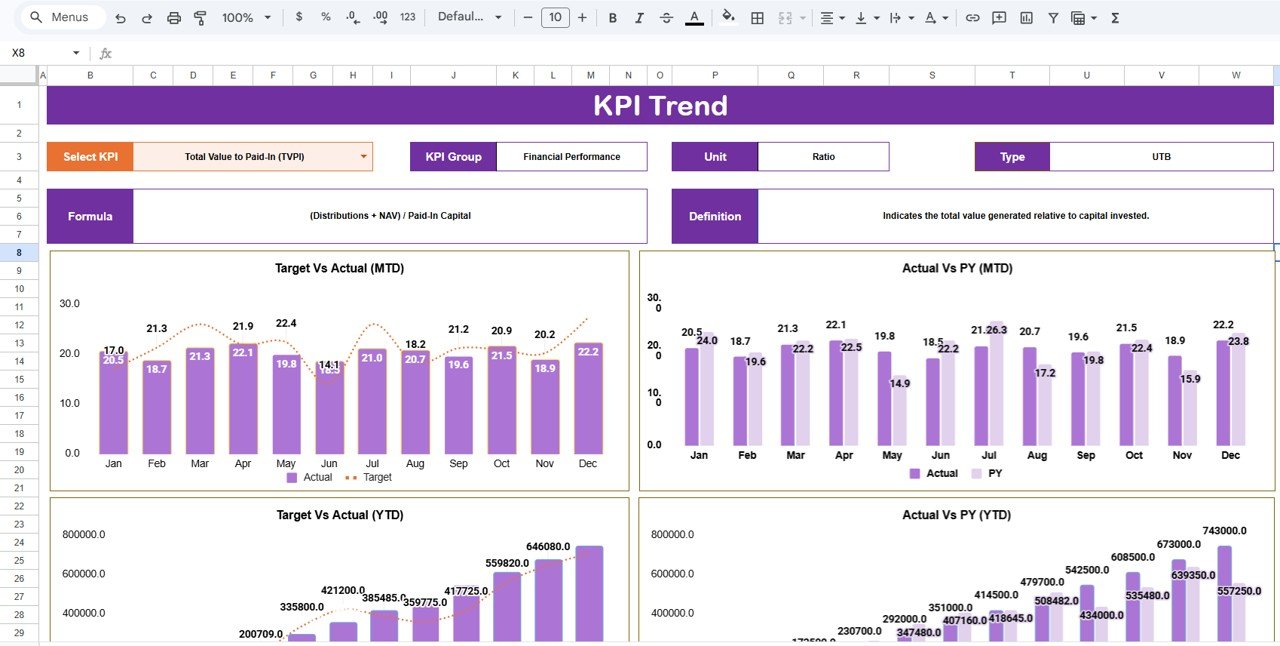
3️⃣ KPI Trend Sheet – Detailed KPI Analysis
The KPI Trend Sheet provides deeper insights into individual KPI performance.
Users can select a KPI from a dropdown in cell C3.
Once selected, the sheet displays detailed KPI information including:
• KPI Group
• Unit of Measurement
• KPI Type
• KPI Performance Type (Higher or Lower is Better)
• KPI Formula
• KPI Definition
Additionally, the sheet visualizes KPI trends over time, allowing investment managers to detect growth or decline patterns.
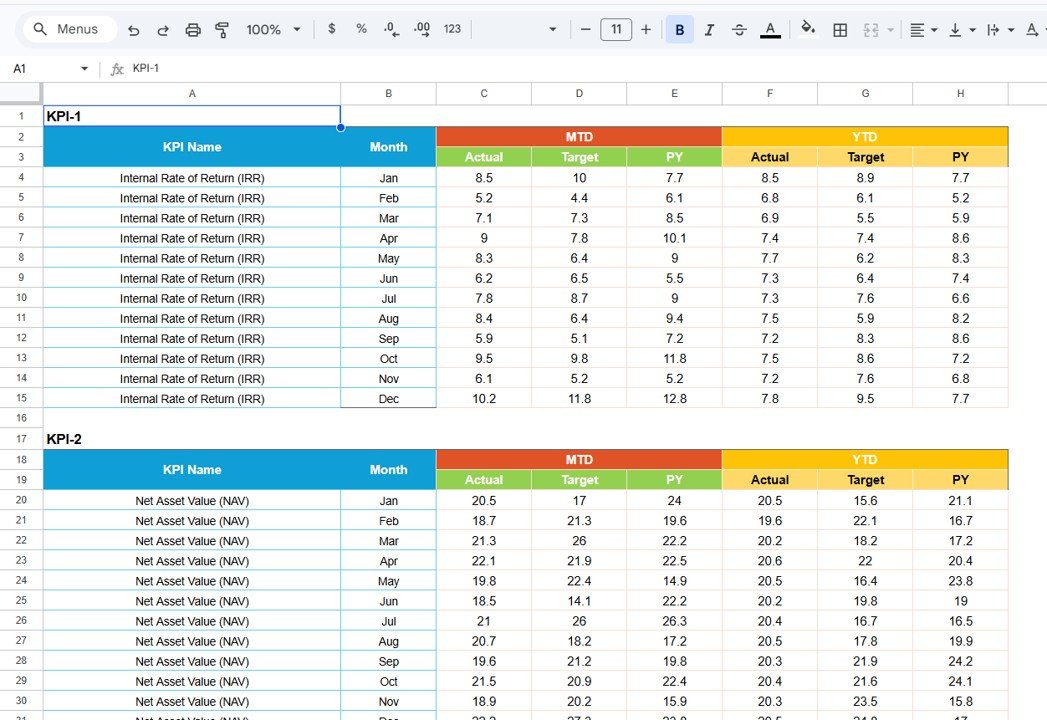
4️⃣ Data Input Sheet – Raw KPI Data Entry
The Data Input Sheet captures the raw KPI values used in the scorecard.
Users record:
• Monthly KPI performance values
• Year-to-Date KPI values
Because the dashboard references this sheet automatically, updates instantly appear in the scorecard.
This sheet serves as the primary data source for all KPI calculations.
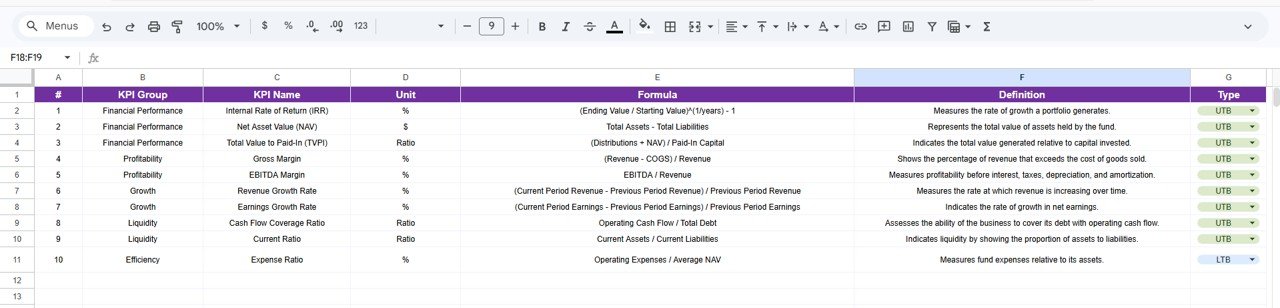
5️⃣ KPI Definition Sheet – KPI Documentation
The KPI Definition Sheet provides detailed documentation for each KPI used in the scorecard.
It contains:
• KPI Name
• KPI Group
• Unit of Measurement
• KPI Formula
• KPI Definition
This documentation ensures that every KPI remains clearly defined and consistently interpreted by all users.
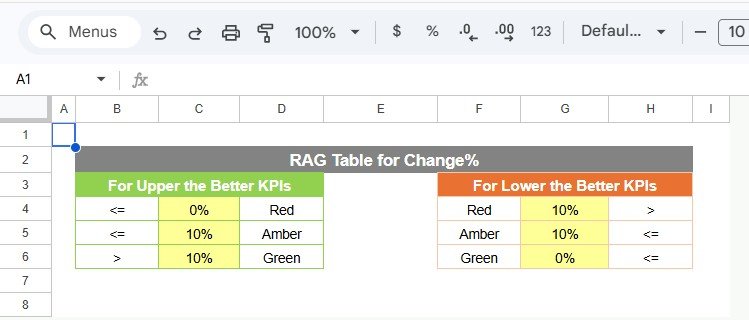
6️⃣ Color Settings Sheet – Performance Indicator Control
The Color Settings Sheet manages visual performance indicators.
It defines the thresholds for:
🚦 Traffic Light Colors
⬆️⬇️ Arrow Indicators
📊 KPI Performance Thresholds
For example:
Green → KPI meets or exceeds target
Yellow → KPI close to target
Red → KPI below acceptable performance
These visual cues help managers evaluate performance instantly.
⚙️ How to Use the Private Equity KPI Scorecard in Google Sheets
Using the scorecard is simple and efficient.
1️⃣ Enter monthly KPI values in the Data Input sheet
2️⃣ Define KPI targets and thresholds
3️⃣ Select the desired month from the dashboard dropdown
4️⃣ Analyze KPI movements using traffic lights and arrows
5️⃣ Use the KPI Trend sheet to study performance trends
Because calculations are automated, users gain insights without manual reporting.
👥 Who Can Benefit from This Private Equity KPI Scorecard?
This template is ideal for professionals involved in investment analysis and fund management.
✔ Private Equity Firms
✔ Investment Managers
✔ Financial Analysts
✔ Fund Managers
✔ Portfolio Management Teams
✔ Corporate Finance Departments
Any organization tracking investment returns, operational KPIs, or portfolio performance can benefit from this scorecard.
This scorecard answers critical investment questions such as:
• Are portfolio companies meeting performance targets?
• Which KPIs show strong growth trends?
• Which investments are underperforming?
• How does current performance compare with previous months?
With these insights, managers can make faster and more informed investment decisions.
Moreover, because the tool is built in Google Sheets, teams can collaborate easily and update data from anywhere.
If you want to strengthen investment monitoring, improve transparency, and make data-driven decisions, the Private Equity KPI Scorecard in Google Sheets offers a powerful and practical solution.
Click hare to read the Detailed blog post
Watch the step-by-step video tutorial:


