Managing a large dealer network without clear performance metrics often leads to confusion, slow decision-making, and missed growth opportunities. Sales managers frequently struggle to track dealer productivity, monitor regional performance, and evaluate whether sales targets are being achieved. When dealer data is scattered across multiple reports, it becomes difficult to identify top-performing partners or detect underperforming regions.
That’s exactly why the Dealer Network KPI Dashboard in Google Sheets becomes a powerful solution for modern sales teams 📊🚀.
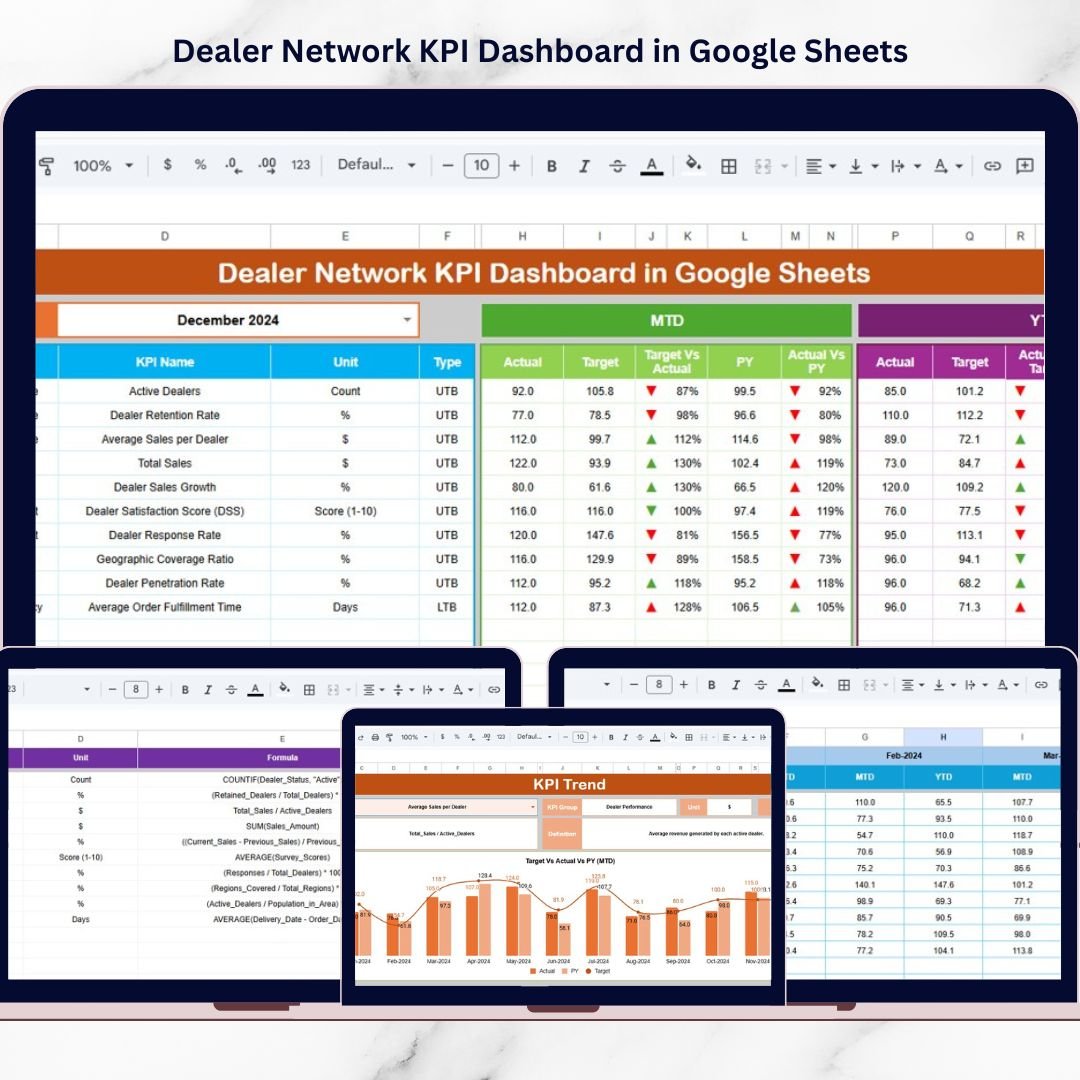
This ready-to-use dashboard converts complex dealer performance data into a centralized, easy-to-analyze reporting system. Instead of manually reviewing multiple spreadsheets, managers can instantly monitor MTD (Month-to-Date) and YTD (Year-to-Date) performance, compare Actual vs Target values, and evaluate Previous Year benchmarks.
Built completely inside Google Sheets, this dashboard provides a flexible and accessible analytics platform that sales leaders, regional managers, and business analysts can use from anywhere.
🚀 Key Feature of Dealer Network KPI Dashboard in Google Sheets
📊 Centralized KPI Monitoring – Track dealer performance metrics in one interactive dashboard.
📅 Month Selection Control – Choose any month from a dropdown and the entire dashboard updates automatically.
🎯 MTD vs Target Analysis – Compare Month-to-Date actual performance with defined targets.
📈 YTD Performance Tracking – Monitor Year-to-Date progress to evaluate long-term dealer growth.
🔄 Previous Year Comparison – Analyze year-over-year performance to detect improvements.
📉 Conditional Performance Indicators – Visual arrows highlight whether performance is improving or declining.
📊 KPI Trend Visualization – Identify growth patterns across months using dynamic charts.
⚙️ Automated Calculations – Google Sheets formulas update metrics instantly when new data is entered.
Because of these features, sales managers gain instant clarity about dealer performance.
📦 What’s Inside the Dealer Network KPI Dashboard in Google Sheets?
This dashboard includes six structured worksheets designed to organize dealer data and KPI analysis efficiently.
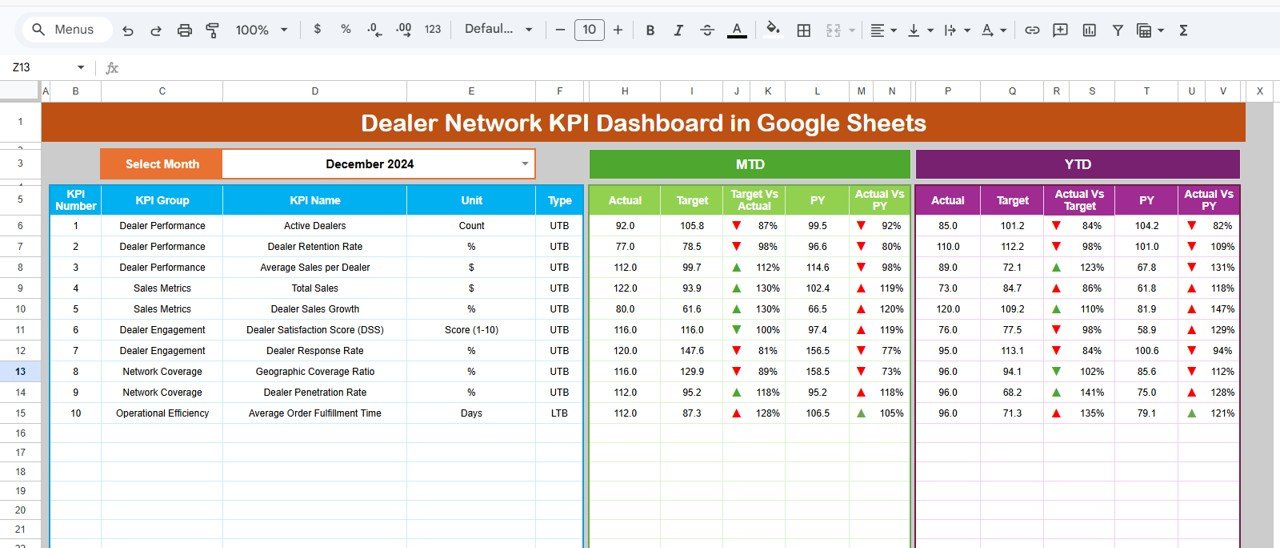
1️⃣ Dashboard Sheet – Main KPI Overview
The Dashboard sheet serves as the central reporting interface.
Managers can instantly view all important KPIs in one place.
Month Selection
In cell D3, users can select the desired month using a dropdown menu.
Once selected, the dashboard automatically refreshes all performance metrics.
Metrics Displayed
The dashboard displays:
• MTD Actual
• MTD Target
• MTD Previous Year
It also calculates:
• Target vs Actual comparison
• Previous Year vs Actual comparison
Conditional formatting arrows visually indicate whether performance is improving or declining.
The dashboard also tracks:
• YTD Actual
• YTD Target
• YTD Previous Year
These insights allow sales leaders to evaluate long-term dealer performance trends.
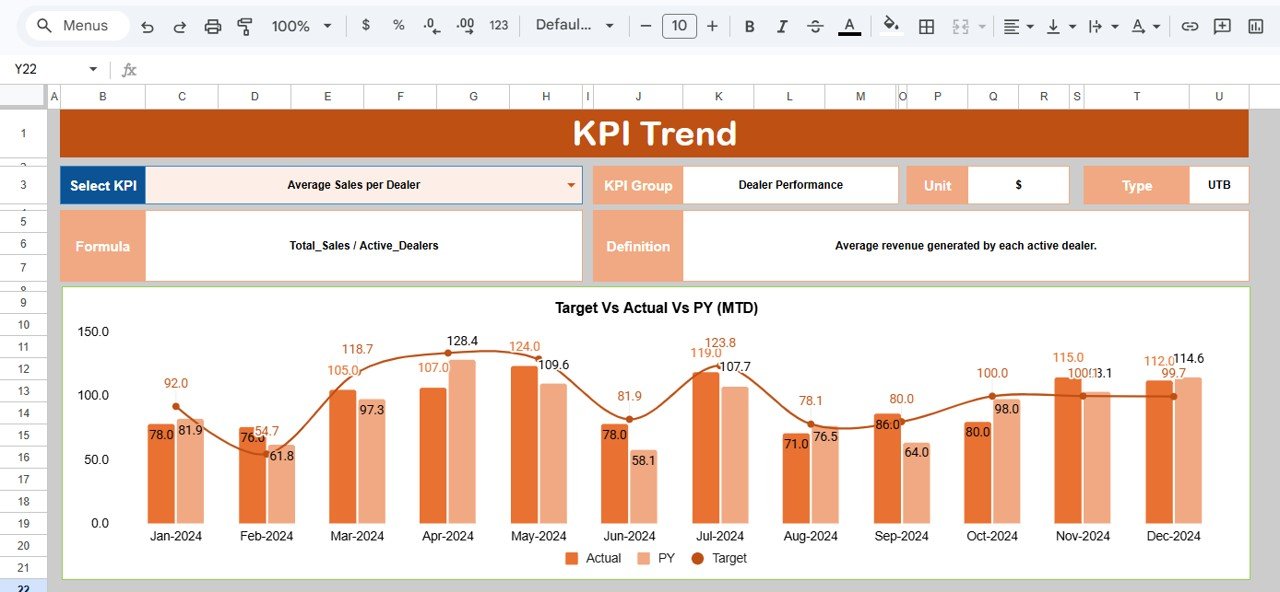
2️⃣ KPI Trend Sheet – KPI Performance Analysis
The KPI Trend Sheet allows users to analyze the performance of a specific KPI.
Users can select a KPI name from the dropdown in cell C3.
Once selected, the sheet displays detailed KPI information including:
• KPI Group
• Unit of Measurement
• KPI Type
• Performance Type (Higher or Lower is better)
• KPI Formula
• KPI Definition
Additionally, the sheet visualizes KPI trends across months. This makes it easier to detect improvement or decline patterns.
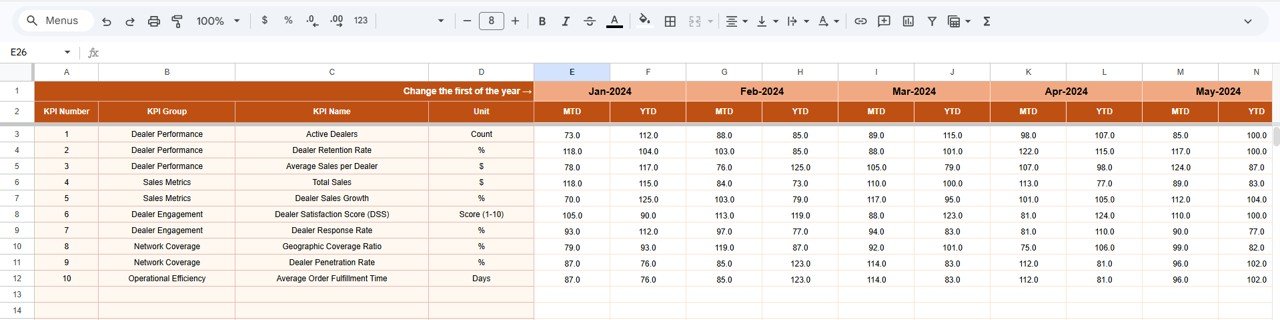
3️⃣ Actual Number Sheet – Enter Current Year Data
The Actual Number Sheet stores KPI values for the current year.
Users enter:
• MTD performance values
• YTD performance values
In cell E1, users define the first month of the fiscal year.
Once updated, the entire dashboard aligns with the fiscal calendar.
This sheet acts as the main data source for the dashboard.
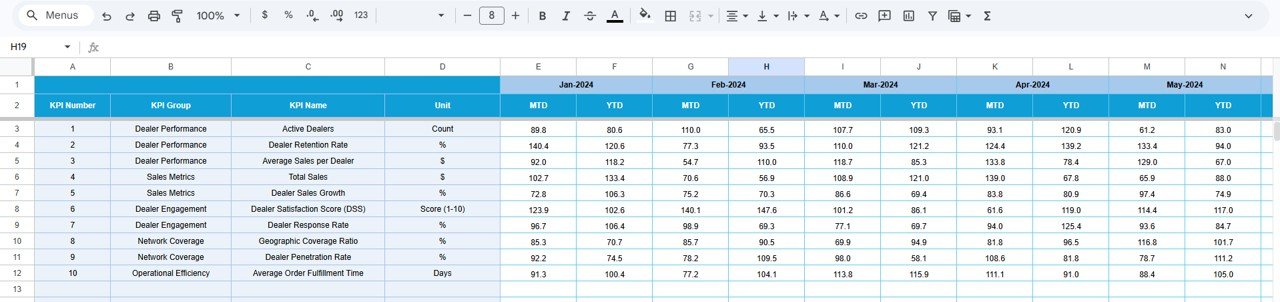
4️⃣ Target Sheet – KPI Performance Goals
The Target Sheet stores KPI performance targets.
Users enter:
• Monthly MTD targets
• Monthly YTD targets
These targets represent expected dealer performance. The dashboard then automatically compares actual values against targets.
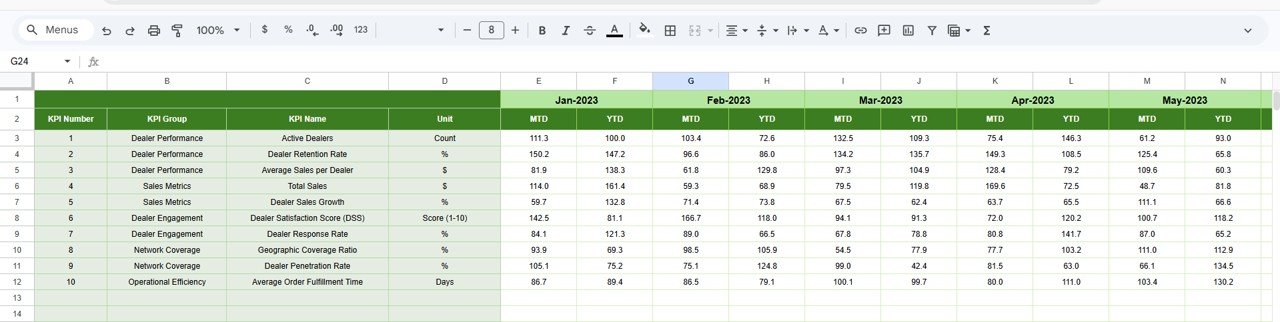
5️⃣ Previous Year Sheet – Historical KPI Data
The Previous Year Sheet stores historical KPI performance data.
Users record KPI values from the previous year in the same format as current year data.
This enables the dashboard to calculate:
• Year-over-Year growth
• Previous Year vs Current Year comparisons
This historical context helps managers evaluate performance improvements.
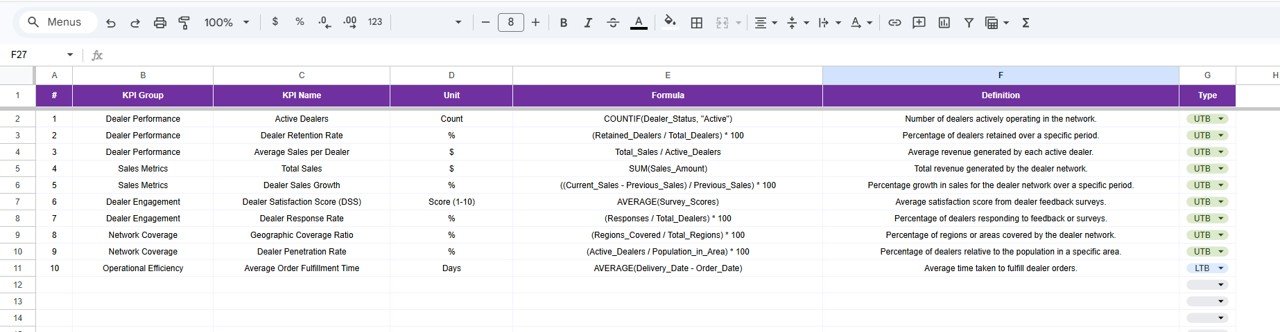
6️⃣ KPI Definition Sheet – KPI Documentation
The KPI Definition Sheet serves as the documentation center for all KPIs.
It contains the following fields:
• KPI Name
• KPI Group
• KPI Unit
• KPI Formula
• KPI Definition
By documenting KPI logic clearly, the dashboard ensures that every user interprets metrics consistently.
⚙️ How to Use the Dealer Network KPI Dashboard in Google Sheets
Using this dashboard is straightforward.
1️⃣ Enter current year KPI values in the Actual Number sheet
2️⃣ Define targets in the Target sheet
3️⃣ Enter previous year values in the Previous Year sheet
4️⃣ Select the desired month from the dashboard dropdown
5️⃣ Analyze performance trends and KPI comparisons
Once the data is entered, the dashboard automatically updates.
👥 Who Can Benefit from This Dealer Network KPI Dashboard?
This dashboard is ideal for organizations that manage dealer or distribution networks.
✔ Sales Directors
✔ Regional Sales Managers
✔ Channel Managers
✔ Dealer Network Managers
✔ Business Analysts
✔ Strategy Teams
Any company with multiple dealers, distributors, or channel partners can benefit from this dashboard.
This dashboard helps answer critical business questions such as:
• Which dealers are achieving targets?
• Which KPIs are improving month-over-month?
• Which regions show declining performance?
• Are we performing better than last year?
With these insights, sales leaders can make faster and smarter decisions.
Moreover, because the dashboard is built in Google Sheets, teams can collaborate easily and update performance data from anywhere.
If you want to improve dealer visibility, track performance trends, and strengthen your distribution network strategy, the Dealer Network KPI Dashboard in Google Sheets is a powerful and practical solution.
Click hare to read the Detailed blog post
Watch the step-by-step video tutorial:


