In today’s high-speed supply chain environment, logistics performance cannot depend on scattered spreadsheets and manual reporting. Freight costs fluctuate. Fuel surcharges rise unexpectedly. Delivery performance impacts client satisfaction. And without a centralized reporting system, profitability quietly suffers.
What if you could track shipments, warehouses, industries, transport modes, regions, and revenue — all in one interactive Excel dashboard?
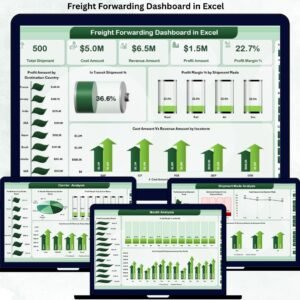
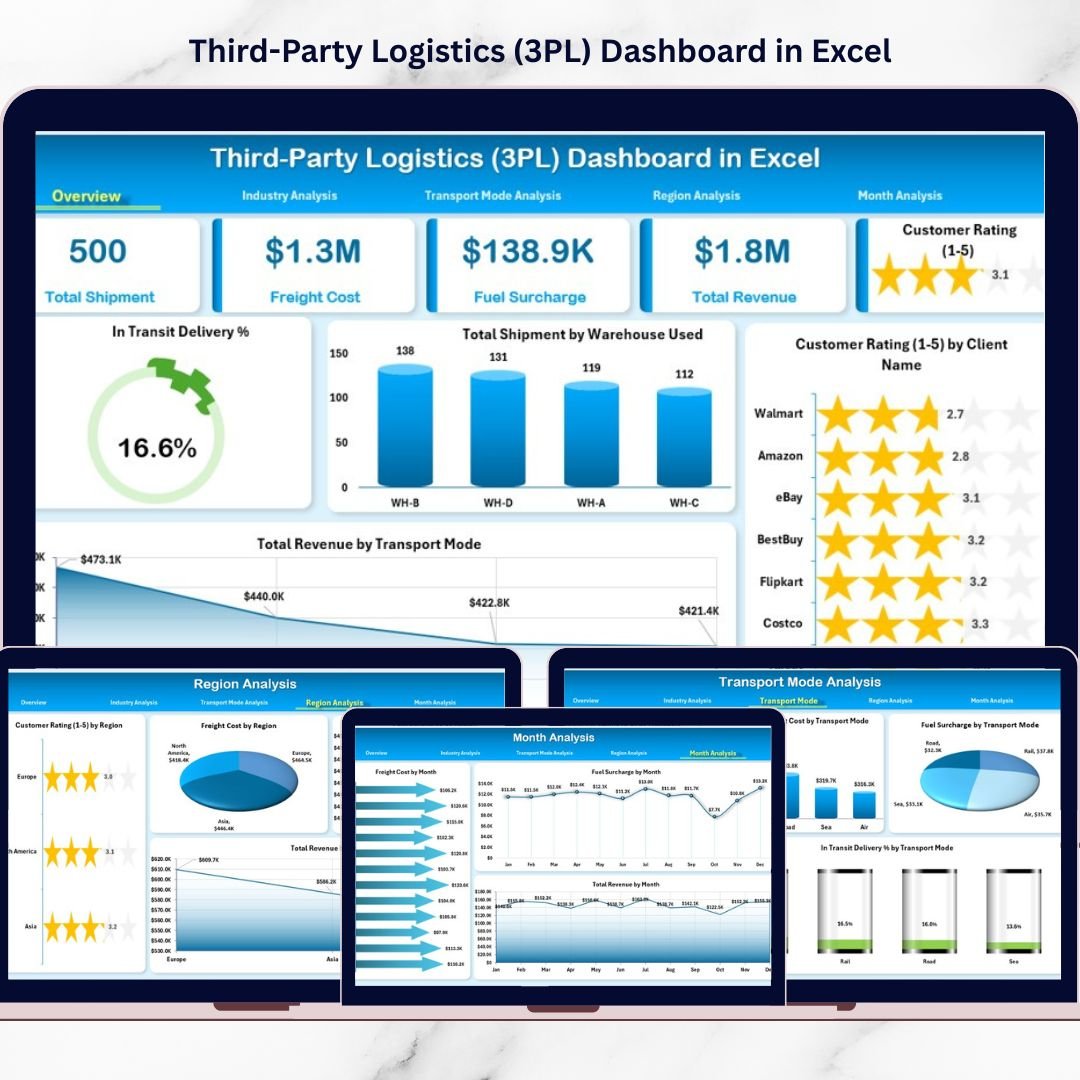
The Third-Party Logistics (3PL) Dashboard in Excel is your complete logistics performance command center. It transforms raw shipment data into clear, dynamic, and decision-ready visuals. Instead of spending hours analyzing multiple files, you gain instant insights that help control costs, improve delivery performance, and strengthen customer relationships.
If you want smarter logistics management and better profitability, this dashboard is built for you.
🚀 Key FeaturAttributese of Third-Party Logistics (3PL) Dashboard in Excel
This ready-to-use Excel dashboard includes 5 powerful analytical pages, along with a structured Data Sheet and Support Sheet.
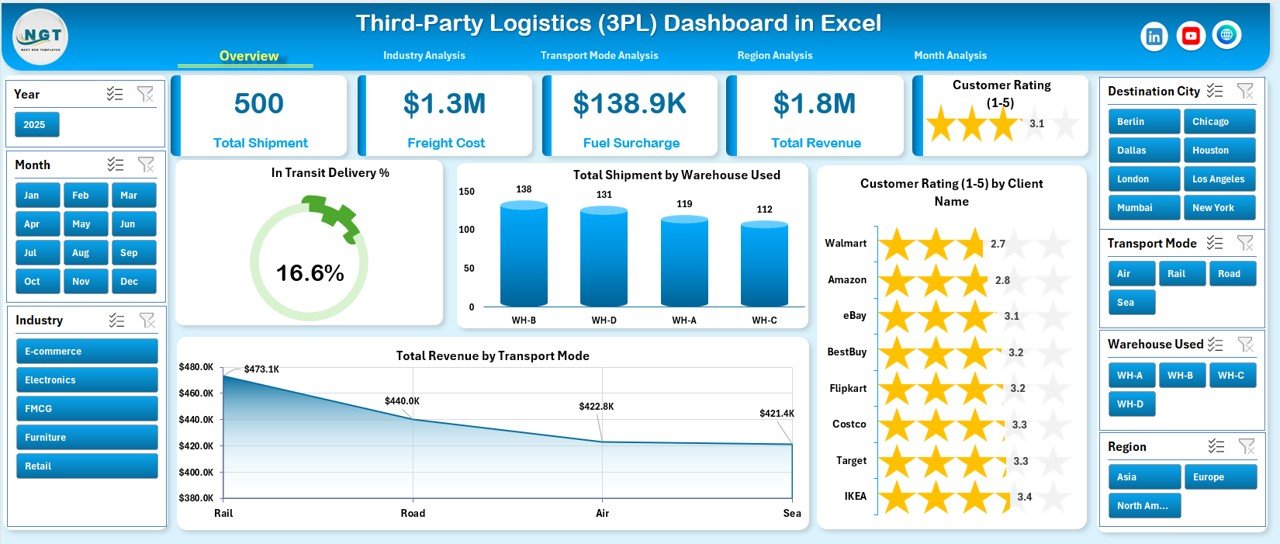
📊 Interactive Overview Page – Monitor In-Transit Delivery %, Total Shipments, Customer Ratings, and Revenue instantly.
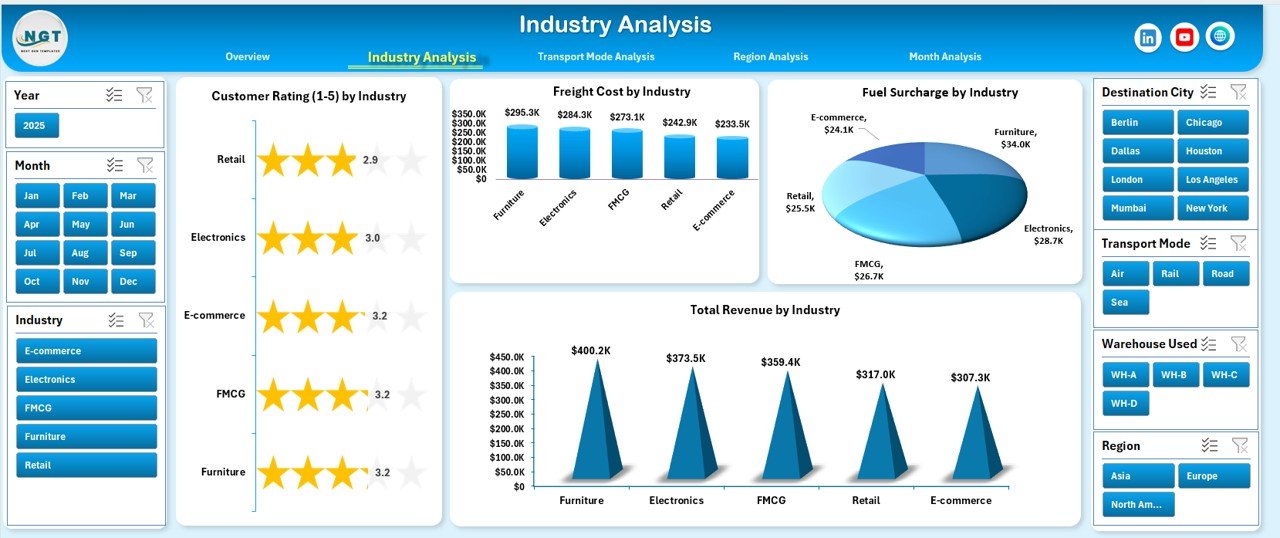
🏭 Industry Analysis Page – Compare freight cost, fuel surcharge, and revenue across industries.
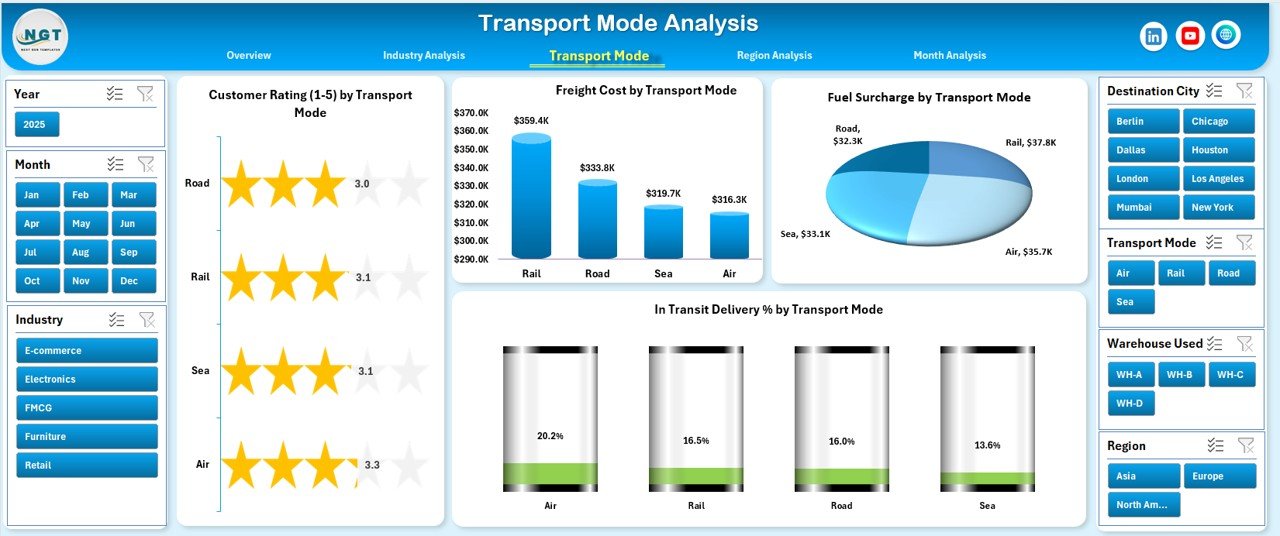
🚚 Transport Mode Analysis – Evaluate road, air, sea, and rail performance side-by-side.
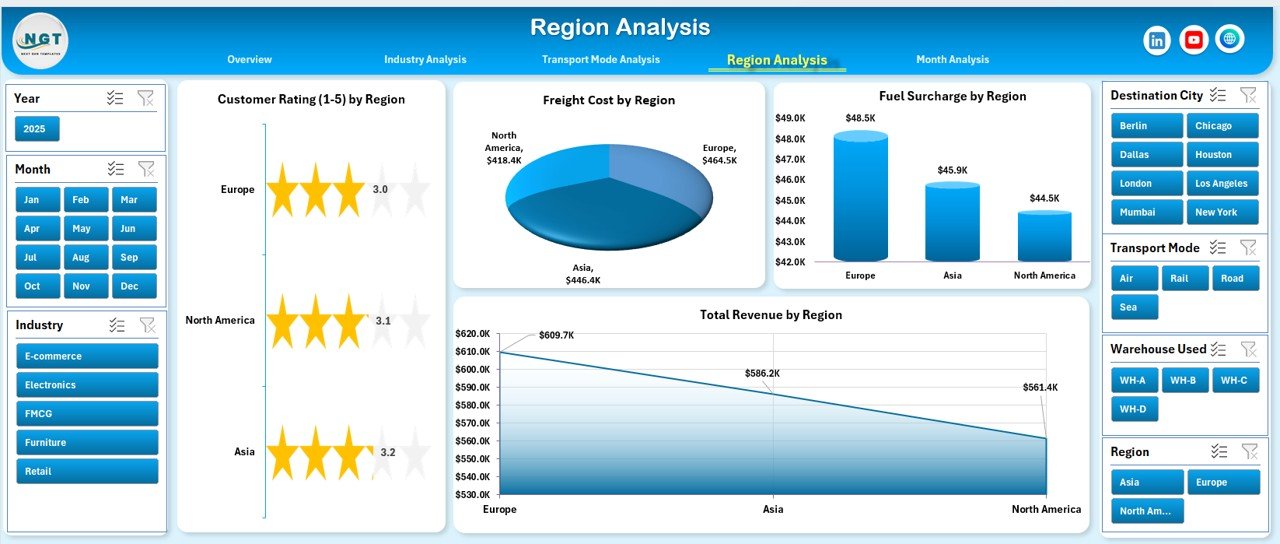
🌍 Region Analysis Page – Track regional cost, revenue, and customer satisfaction.
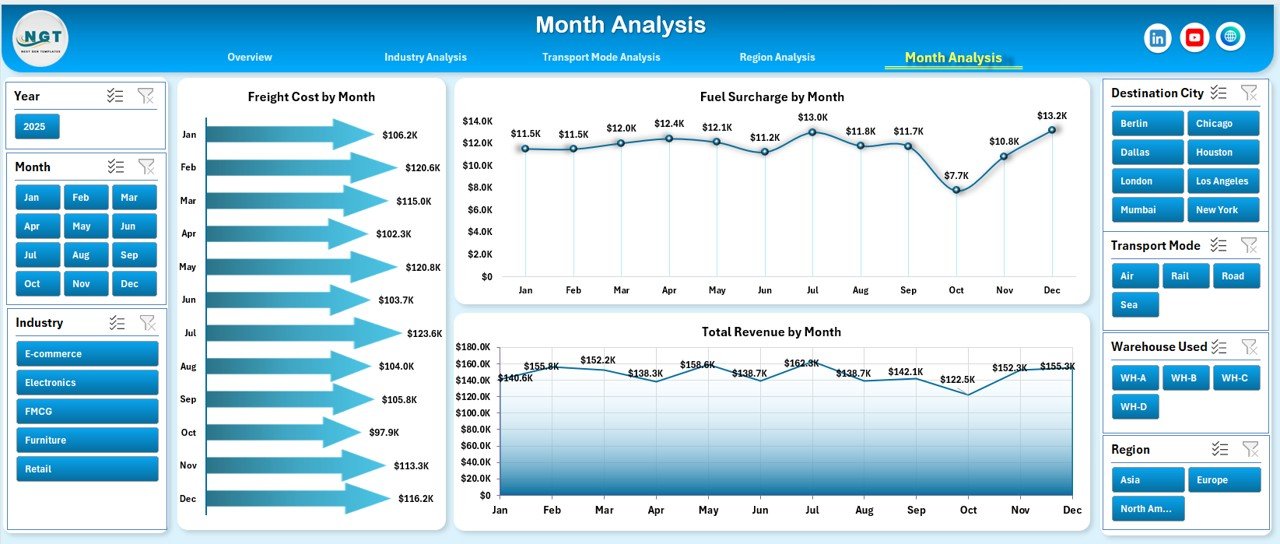
📅 Month Analysis Page – Monitor monthly cost trends and revenue growth patterns.
🎛 Left-Side Page Navigator – Switch between pages instantly.
🎯 Right-Side Slicers – Filter data dynamically by warehouse, industry, region, transport mode, client, and month.
Because the dashboard uses Pivot Tables and dynamic charts, refreshing data automatically updates all insights.
📦 What’s Inside the Third-Party Logistics (3PL) Dashboard in Excel
This dashboard is not just a visual report — it is a structured logistics intelligence system.
Inside the template, you get:
✅ 5 fully designed dashboard pages
✅ Organized Data Sheet for raw shipment data
✅ Support Sheet for calculations and dropdown controls
✅ Dynamic KPI Cards
✅ Interactive slicers for real-time filtering
✅ Pre-built charts for operational and financial insights
✅ Fully customizable layout
The Data Sheet includes structured columns such as:
Shipment ID
Warehouse
Industry
Region
Transport Mode
Freight Cost
Fuel Surcharge
Revenue
Customer Rating
Delivery Status
Month
Because the data structure is organized, the dashboard remains accurate and responsive.
⚙️ How to Use the Third-Party Logistics (3PL) Dashboard in Excel
Implementation is simple and practical.
1️⃣ Collect and clean shipment data.
2️⃣ Upload structured data into the Data Sheet.
3️⃣ Refresh Pivot Tables.
4️⃣ Use slicers to filter by industry, region, transport mode, or month.
5️⃣ Analyze performance trends and cost patterns.
Within minutes, you gain full operational clarity.
No advanced Excel expertise is required — basic Excel knowledge is enough.
👥 Who Can Benefit from This Third-Party Logistics (3PL) Dashboard in Excel
This dashboard is ideal for:
🚛 3PL Companies
🏭 Warehouse Managers
📦 Freight Forwarders
📊 Supply Chain Managers
🚚 Transport Companies
📈 Logistics Consultants
If your business handles shipments, freight cost management, or warehouse coordination, this dashboard provides immediate value.
💡 Why This Dashboard Improves Logistics Performance
✔ Centralized logistics reporting
✔ Better freight cost control
✔ Fuel surcharge monitoring
✔ Improved delivery performance tracking
✔ Stronger customer satisfaction analysis
✔ Smarter revenue planning
✔ Clear industry and regional comparisons
✔ Faster decision-making
Instead of reacting to cost overruns or delayed deliveries, you proactively manage performance.
This dashboard converts complex logistics data into powerful strategic insights.
### Click here to read the Detailed blog post
Visit our YouTube channel to learn step-by-step video tutorials
Youtube.com/@PKAnExcelExpert