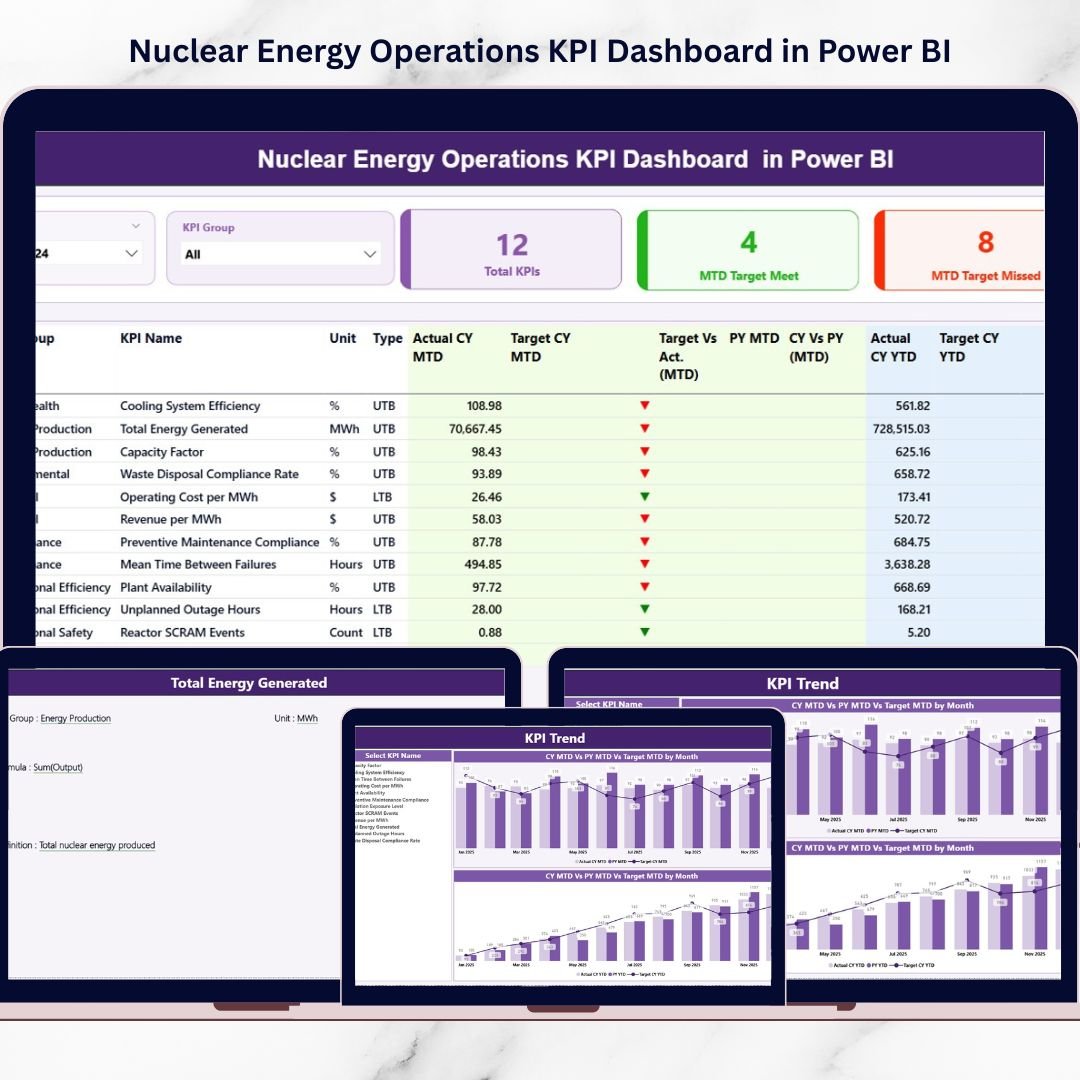
Running a nuclear power plant without real-time performance visibility is risky. One missed indicator can impact safety, compliance, and financial stability. That’s exactly why the Nuclear Energy Operations KPI Dashboard in Power BI becomes your ultimate command center.
This ready-to-use, interactive Power BI solution centralizes your safety, operational, maintenance, and financial KPIs into one powerful reporting system. Instead of juggling spreadsheets, you gain instant clarity, structured monitoring, and actionable insights — all in a few clicks.
If you want smarter decisions, faster reviews, and stronger operational control, this dashboard is built for you.
🚀 Key Feature of Nuclear Energy Operations KPI Dashboard in Power BI
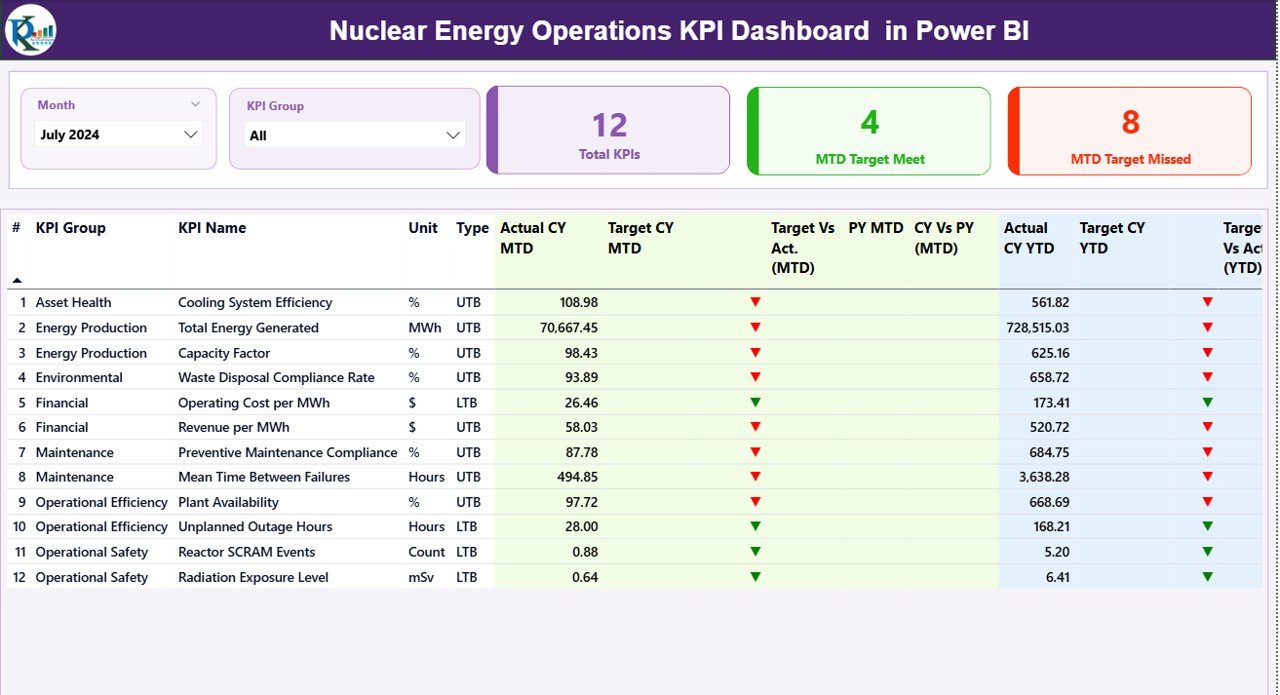
📊 Interactive Summary Page – Instantly view all KPIs with dynamic slicers for Month and KPI Group. Everything updates in real time.
🎯 MTD & YTD Performance Tracking – Monitor Current Year Actual vs Target with automated calculations and smart indicators.
📈 Year-Over-Year Comparison – Compare CY vs PY values to evaluate improvement trends and detect performance gaps.
🟢 Target Achievement Icons – Visual ▲ and ▼ indicators instantly highlight performance status.
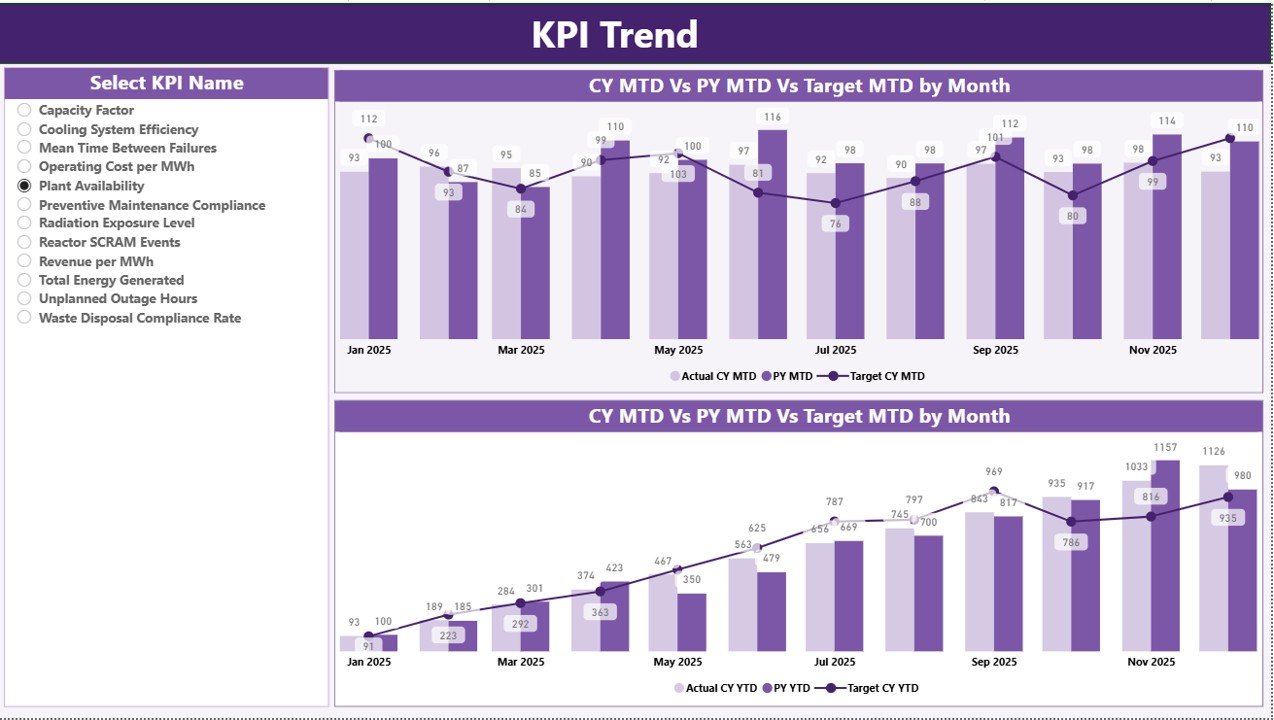
📉 KPI Trend Analysis Page – Analyze MTD and YTD trends using combo charts for deeper performance insights.
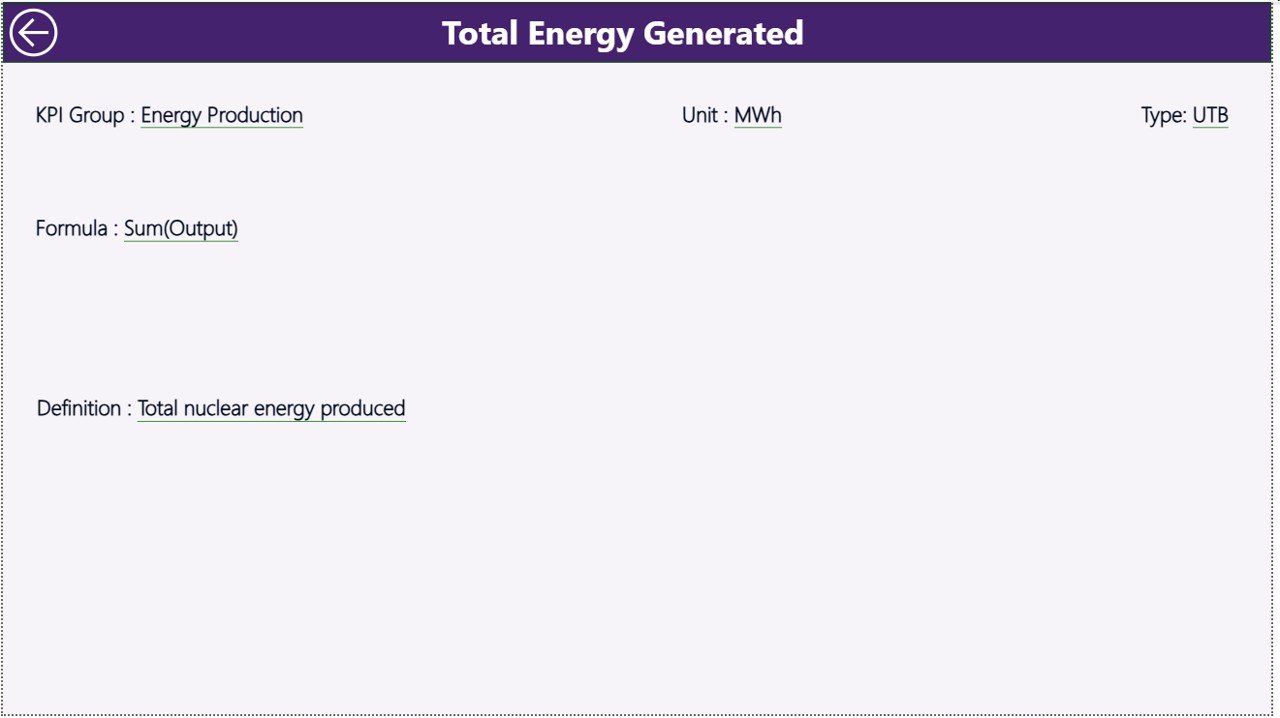
🔎 Drill-Through KPI Definition Page – Access formula, definition, KPI type (LTB/UTB), and classification in one click.
🔄 Excel-Based Data Source – Easy-to-manage Excel input sheets for Actual, Target, and KPI Definitions.
⚡ Automated Calculations – Reduce manual errors and eliminate repetitive reporting work.
📦 What’s Inside the Nuclear Energy Operations KPI Dashboard in Power BI
When you download this product, you receive a structured and professional Power BI reporting system that includes:
✔ Power BI Desktop File (.pbix)
✔ Three Interactive Report Pages (Summary, KPI Trend, KPI Definition)
✔ Pre-built MTD & YTD Calculation Logic
✔ Target vs Actual Performance Ratios
✔ CY vs PY Comparison Measures
✔ Clean KPI Classification (LTB / UTB)
✔ Excel Data Source Template with 3 Sheets:
-
Input_Actual
-
Input_Target
-
KPI Definition
Everything remains organized and easy to maintain. You only need to update monthly values — the dashboard handles the rest.
🛠 How to Use the Nuclear Energy Operations KPI Dashboard in Power BI
Using this dashboard is simple and efficient:
1️⃣ Enter monthly Actual and Target data into the Excel file.
2️⃣ Open the Power BI file and refresh the dataset.
3️⃣ Select the Month using the slicer.
4️⃣ Review Summary KPIs instantly.
5️⃣ Drill into KPI trends for deeper analysis.
6️⃣ Use the KPI Definition page for formula transparency.
Within minutes, you generate executive-level insights ready for management review meetings.
👥 Who Can Benefit from This Nuclear Energy Operations KPI Dashboard in Power BI
This dashboard is ideal for:
🏭 Nuclear Power Plant Managers
⚙ Operations & Maintenance Teams
📊 Performance Analysts
📋 Regulatory Compliance Officers
💼 Executive Leadership Teams
💰 Financial Controllers
If your organization demands precision, structured reporting, and compliance-driven monitoring, this solution delivers measurable impact.
Why This Dashboard Is a Game-Changer
✔ Improves safety monitoring through early KPI detection
✔ Strengthens operational discipline with structured tracking
✔ Supports compliance documentation with historical comparison
✔ Reduces reporting time dramatically
✔ Builds a strong data-driven culture
Instead of reacting to problems late, you proactively manage performance.
Ready to Transform Your Nuclear KPI Reporting?
Stop relying on disconnected spreadsheets. Start leading with clarity, transparency, and confidence.
This dashboard turns complex nuclear data into executive-ready insights — instantly.
Click here to read the Detailed blog post
Watch the step-by-step video tutorial:
Visit our YouTube channel to learn step-by-step video tutorials:
YouTube Channel