Wind energy is rapidly becoming one of the most important sources of renewable power worldwide. Governments, investors, and energy companies are expanding wind farms to generate clean electricity and reduce environmental impact. Wind Energy Farms KPI Dashboard in Excel However, operating a wind energy farm efficiently requires continuous monitoring of turbine performance, operational reliability, maintenance efficiency, and financial outcomes.
Many wind farm operators still rely on disconnected reports, manual spreadsheets, or multiple monitoring tools. As a result, performance issues remain unnoticed, maintenance decisions become delayed, and operational efficiency declines. To overcome these challenges, organizations increasingly adopt structured KPI monitoring systems.
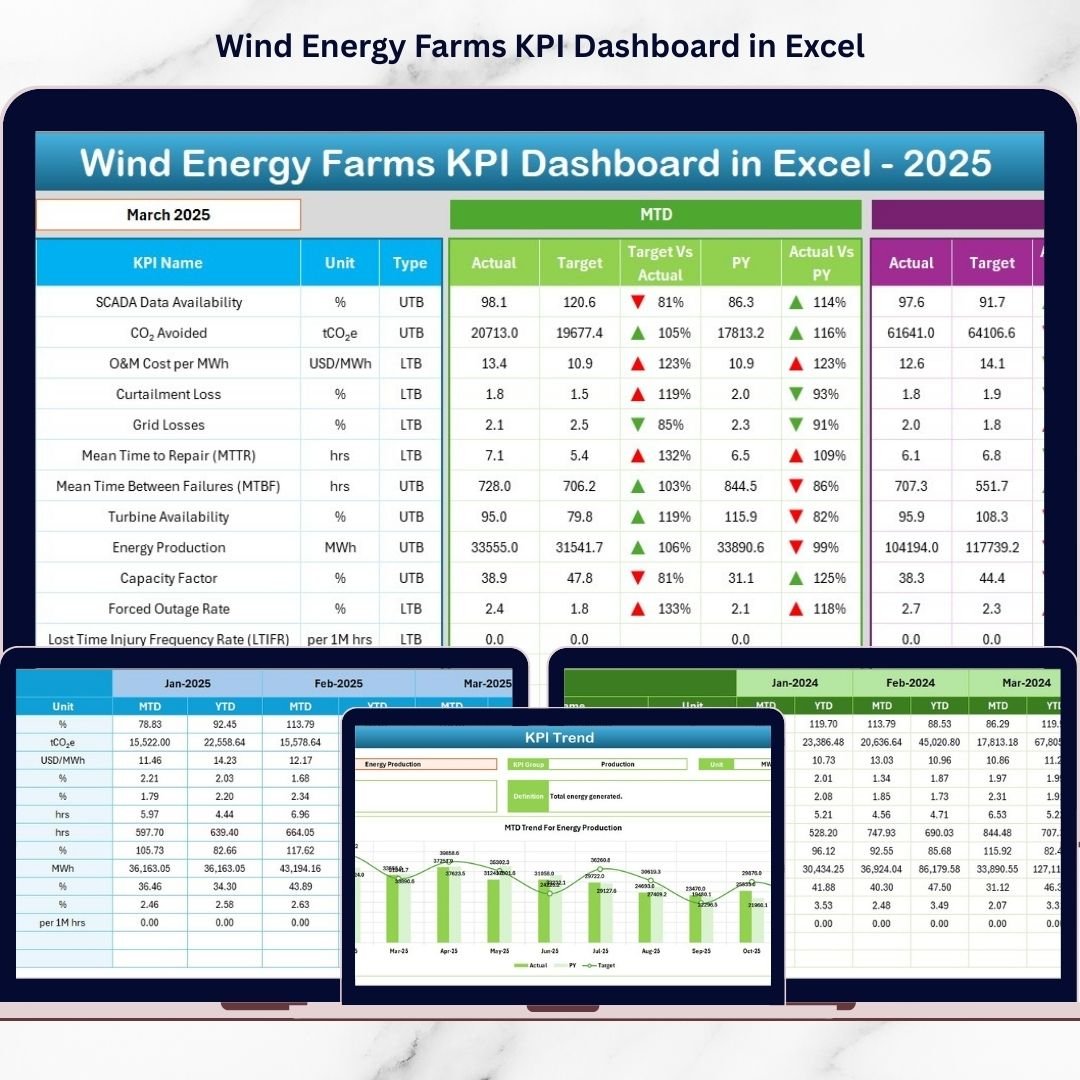
Wind Energy Farms KPI Dashboard in Excel The Wind Energy Farms KPI Dashboard in Excel is a ready-to-use performance analytics solution designed to centralize wind farm operations into one interactive dashboard. Using structured Key Performance Indicators (KPIs), this template transforms raw operational data into clear visual insights that support faster and smarter decision-making.
Instead of analyzing multiple reports separately, managers can track operational, financial, and efficiency metrics through a single Excel-based dashboard. Because the solution runs entirely in Excel, organizations can implement advanced analytics without investing in expensive software platforms.
Whether you manage turbine performance, maintenance planning, or energy production efficiency, this dashboard provides the visibility needed to optimize wind farm operations effectively.
🚀 Key Feature of Wind Energy Farms KPI Dashboard in Excel
🌬️ Centralized Wind Farm Performance Dashboard – Monitor all operational KPIs from one interactive interface.
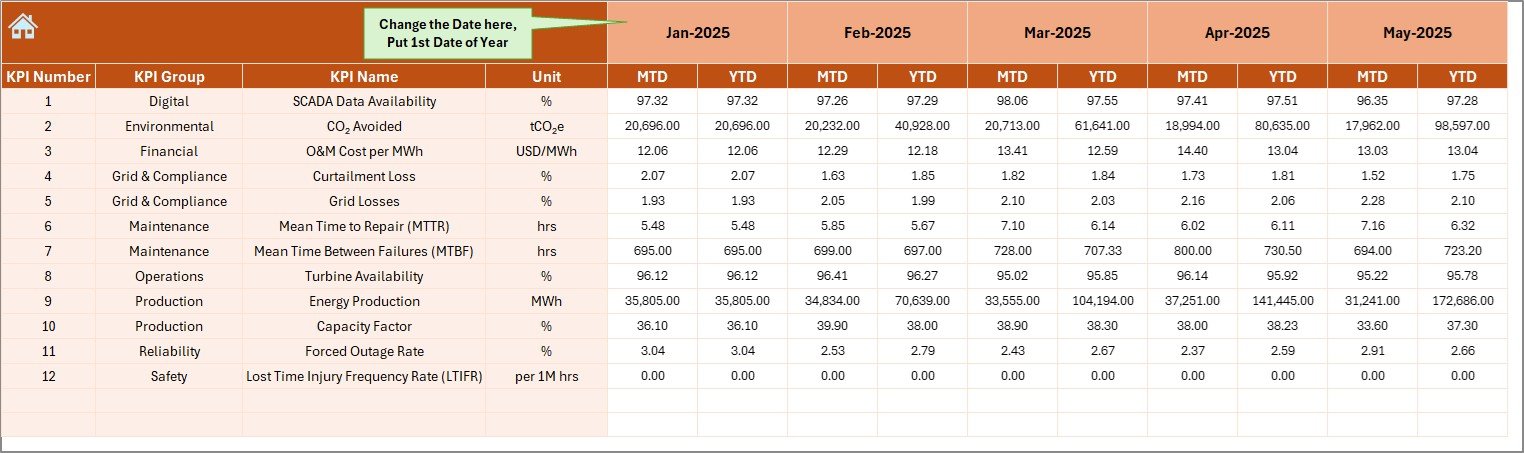
📊 MTD & YTD Performance Analysis – Track short-term and annual performance instantly.
🎯 Actual vs Target Comparison – Identify operational gaps using automated calculations.
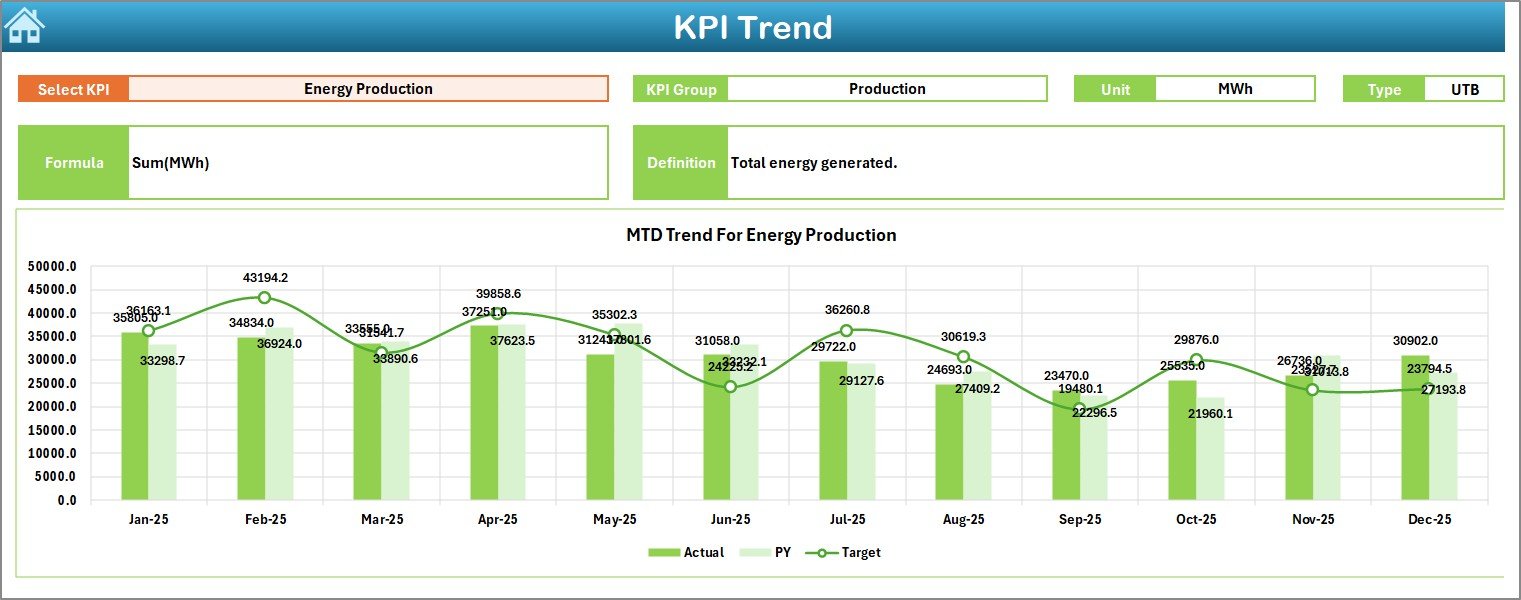
📈 Trend Analysis Charts – Visualize performance patterns across time periods.
🔼 Performance Direction Indicators – Up and down arrows highlight improvements or declines instantly.
⚙️ Automated Dashboard Updates – Update input data once and all reports refresh automatically.
📉 Historical Performance Benchmarking – Compare current results with previous-year performance.
🔧 Fully Customizable KPI Framework – Adapt KPIs to specific wind farm operations.
📦 What’s Inside the Wind Energy Farms KPI Dashboard in Excel
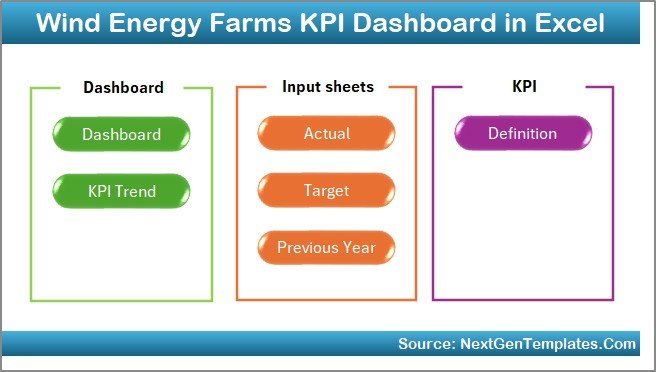
This professionally structured Excel solution includes 7 worksheets, creating a complete renewable energy performance management system:
🏠 Home Sheet
A navigation hub with buttons allowing instant access to all dashboard sections.
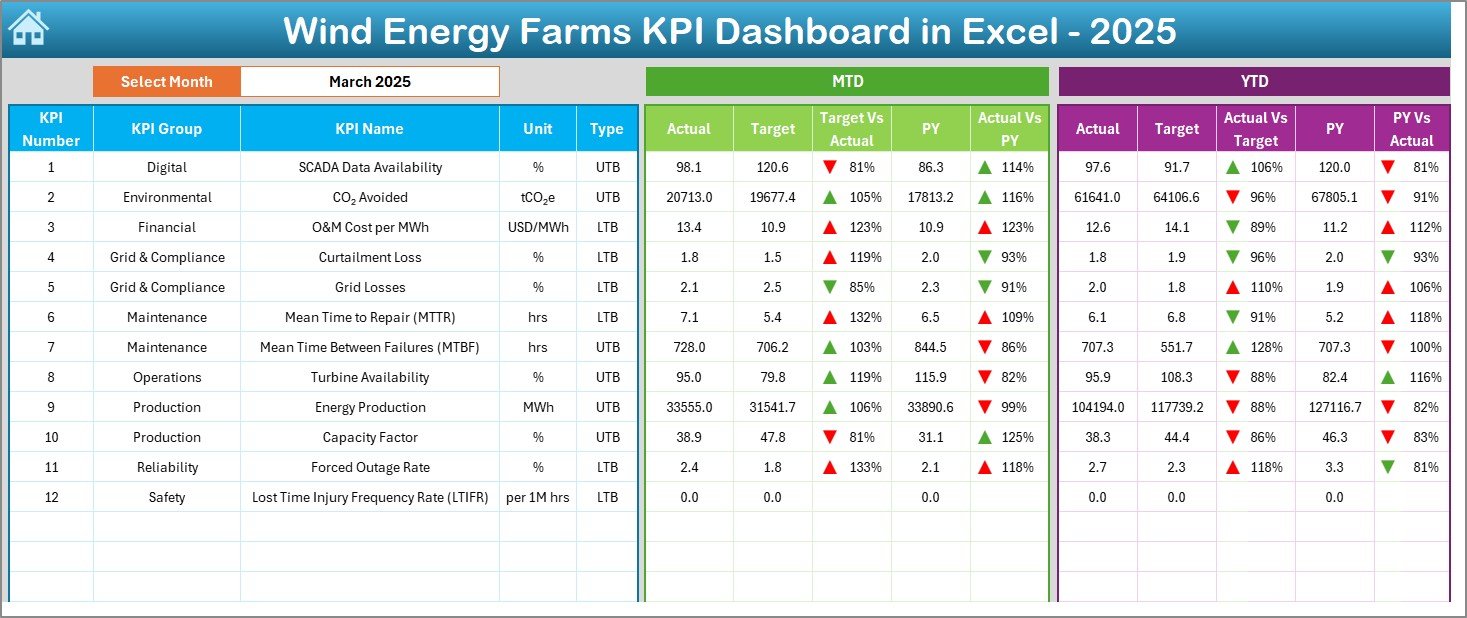
📊 Dashboard Sheet
The main analytics page showing MTD, YTD, Actual vs Target, and Previous Year comparisons with visual performance indicators.
📈 KPI Trend Sheet
Analyze individual KPI performance using dynamic charts displaying Actual, Target, and historical trends.
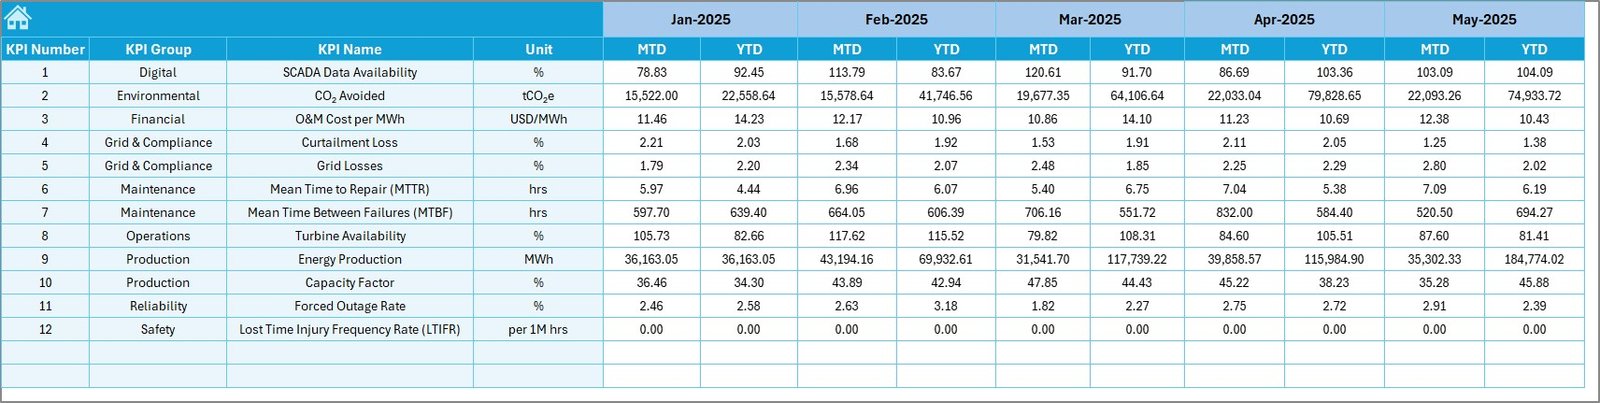
📝 Actual Numbers Input Sheet
Enter operational data monthly, and the dashboard updates automatically.
🎯 Target Sheet
Define performance goals for accurate KPI comparison.
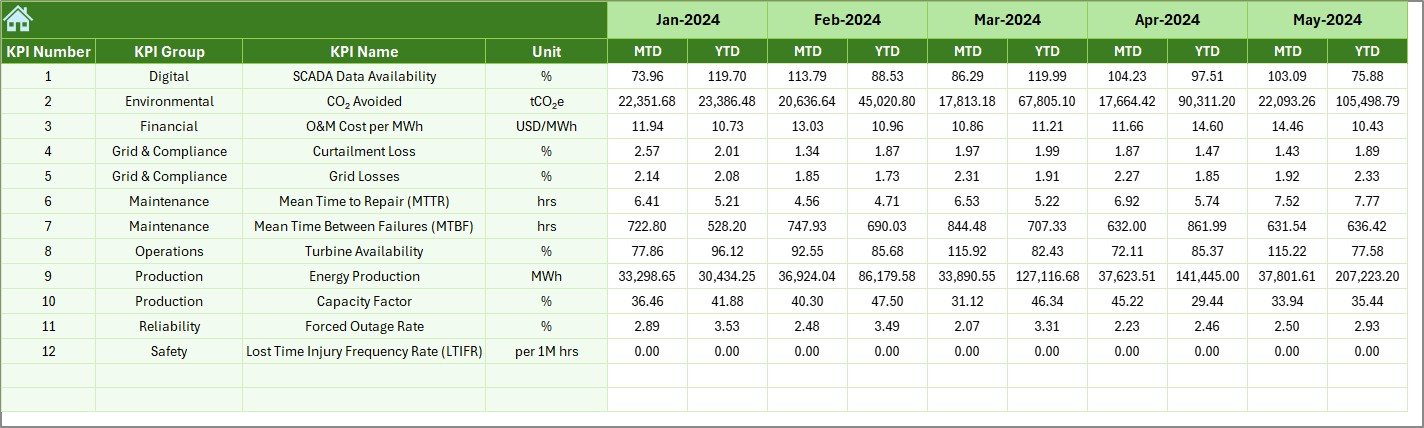
📅 Previous Year Numbers Sheet
Store historical data for benchmarking and trend analysis.
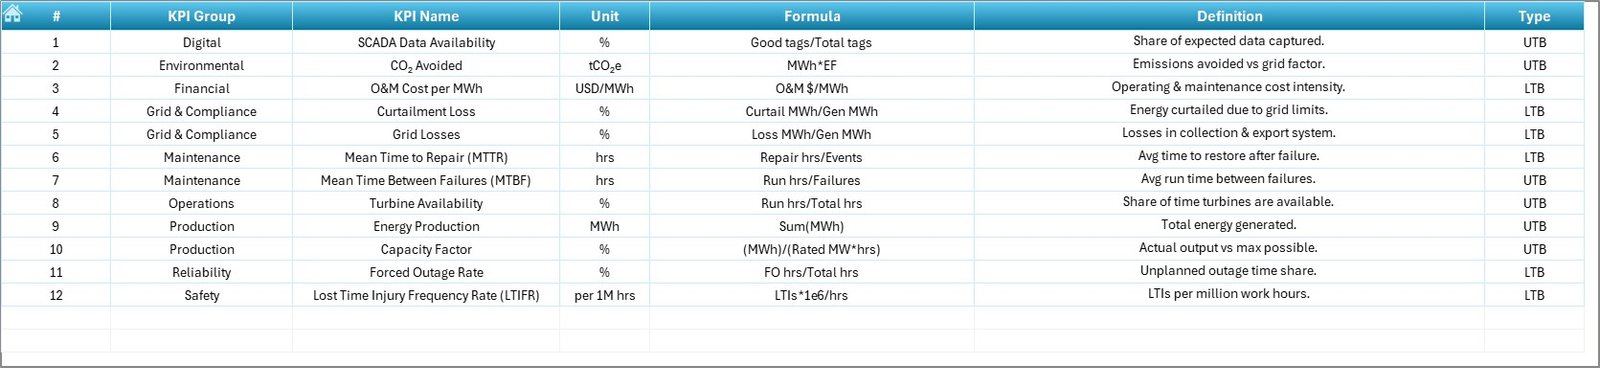
📘 KPI Definition Sheet
Document KPI formulas, units, and definitions to ensure reporting consistency.
Together, these worksheets provide a structured analytics framework for wind farm management.
⚙️ How to Use the Wind Energy Farms KPI Dashboard in Excel
The dashboard is designed for simple implementation:
1️⃣ Define wind farm KPIs aligned with operational goals.
2️⃣ Enter KPI definitions in the Definition sheet.
3️⃣ Add target performance values.
4️⃣ Input actual operational data regularly.
5️⃣ Select reporting month from dropdown filters.
6️⃣ Review dashboard insights and trend charts.
Within minutes, operators gain actionable performance visibility.
👥 Who Can Benefit from This Wind Energy Farms KPI Dashboard in Excel
This dashboard is ideal for renewable energy professionals and organizations:
🌬️ Wind Farm Operators
⚡ Renewable Energy Companies
📊 Energy Analysts
🔧 Maintenance Managers
📈 Operations Leaders
🌍 Sustainability Consultants
💼 Energy Investors
Organizations of all sizes can implement this solution to improve operational efficiency and data-driven decision-making.
By converting operational data into measurable KPIs, the Wind Energy Farms KPI Dashboard in Excel helps teams reduce downtime, optimize maintenance planning, and maximize energy production efficiency.
### Click here to read the Detailed blog post
Visit our YouTube channel to learn step-by-step video tutorials:
👉 https://youtube.com/@PKAnExcelExpert


