Modern fertilizer manufacturing plants operate in a complex environment where production efficiency, raw material utilization, energy consumption, quality compliance, and logistics performance must be monitored continuously. However, relying on manual spreadsheets or disconnected reports often leads to delayed insights and inefficient decision-making.
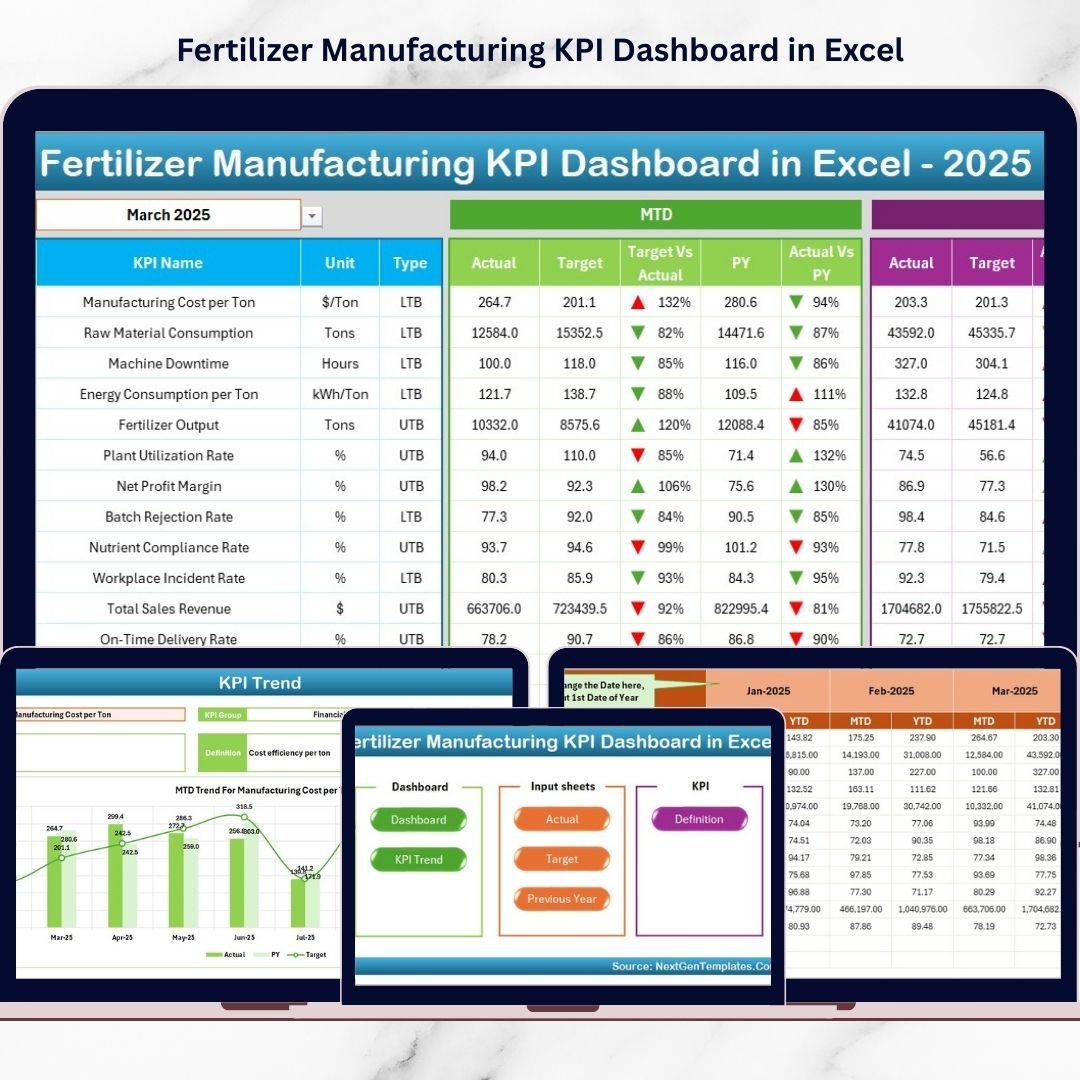
The Fertilizer Manufacturing KPI Dashboard in Excel provides a ready-to-use, automated performance monitoring solution that converts operational data into clear visual insights. Instead of analyzing multiple reports, managers can track all KPIs from one centralized dashboard and instantly compare Actual vs Target and Current Year vs Previous Year performance.
Designed using advanced Excel features, this dashboard enables fertilizer manufacturers to improve operational control, reduce costs, and drive data-based decisions without investing in expensive software.
⭐ Key Feature of Fertilizer Manufacturing KPI Dashboard in Excel
📊 Centralized KPI Monitoring – View all manufacturing KPIs in one interactive dashboard.
📅 Dynamic Month Selection – Change reporting month instantly using dropdown (Cell D3).
📈 MTD & YTD Performance Tracking – Monitor short-term and long-term performance together.
🔺 Visual Performance Indicators – Up/Down arrows highlight improvement or decline instantly.
📉 Trend Analysis Charts – Analyze KPI behavior over time.
🎯 Target vs Actual Comparison – Evaluate operational success quickly.
📚 KPI Definition Library – Standardized KPI formulas and explanations.
⚙️ Automated Calculations – Dashboard updates automatically after data entry.
📂 What’s Inside the Fertilizer Manufacturing KPI Dashboard in Excel
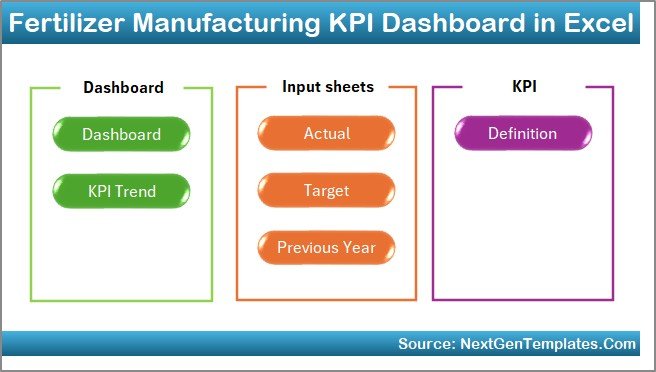
This ready-to-use solution includes 7 structured worksheets, each serving a specific operational purpose.
🏠 Home Sheet – Smart Navigation Center

The Home Sheet acts as the dashboard index.
Features
-
Six navigation buttons
-
One-click access to all sheets
-
User-friendly interface
Users move across sections quickly without manual searching.
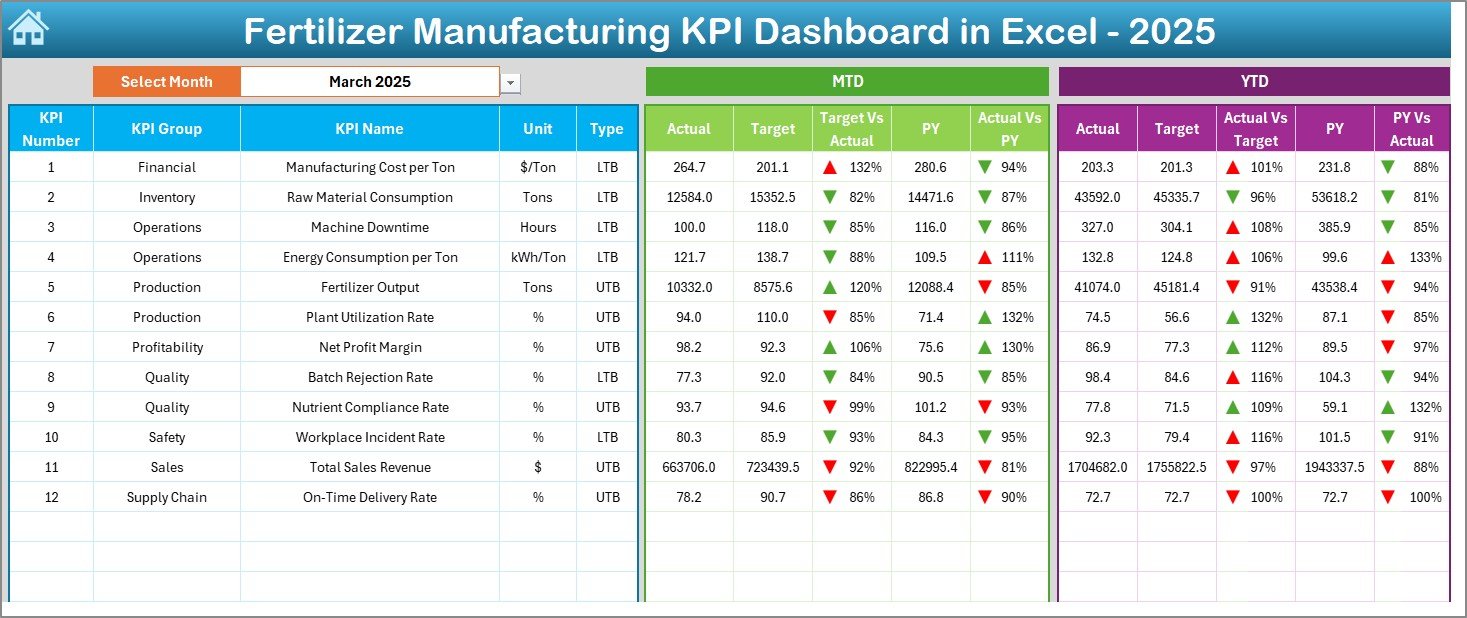
📊 Dashboard Sheet – Main KPI Monitoring Area
This sheet is the heart of the dashboard.
Key Functionalities
-
Month selector in cell D3
-
Automatic dashboard refresh
-
MTD and YTD KPI monitoring
Metrics Displayed
-
MTD Actual vs Target
-
MTD Actual vs Previous Year
-
YTD Actual vs Target
-
YTD Actual vs Previous Year
Visual arrows instantly indicate performance trends:
🔼 Improvement
🔽 Decline
Managers understand operational health at a glance.
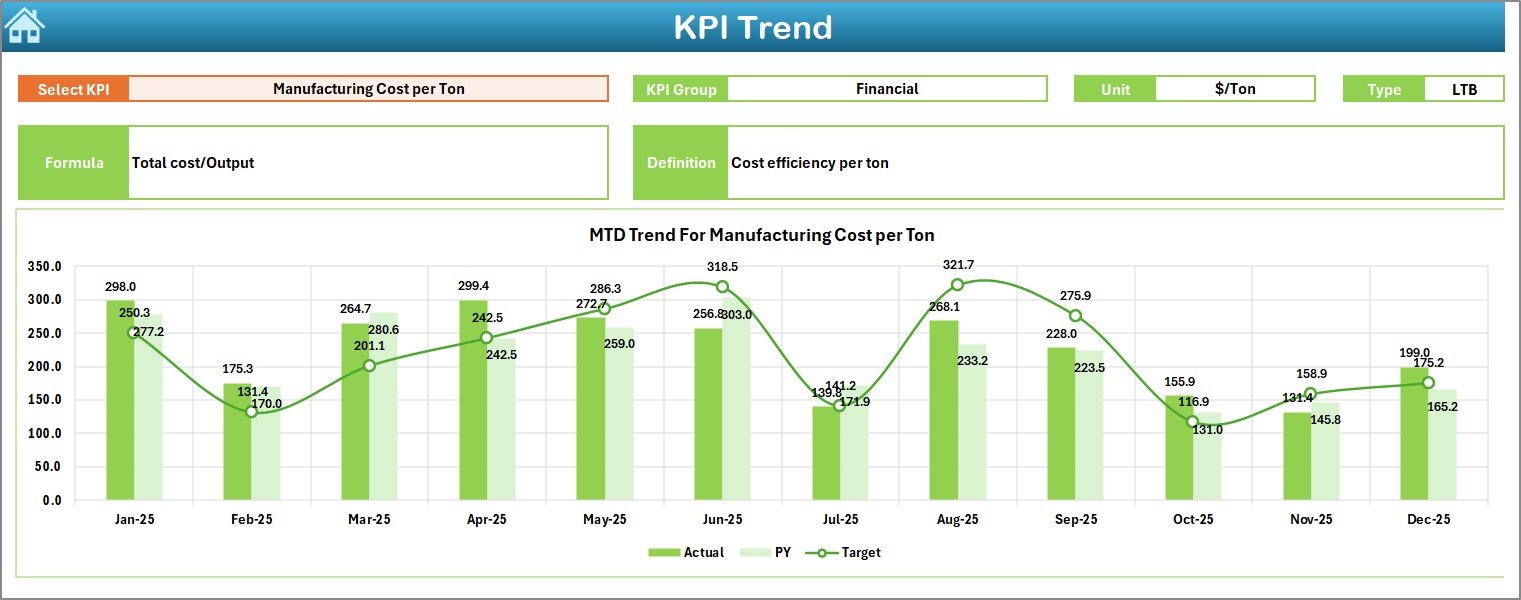
📈 KPI Trend Sheet – Deep Performance Analysis
This sheet explains KPI performance behavior.
Users select a KPI from dropdown cell C3 to view:
-
KPI Group
-
Measurement Unit
-
KPI Type (LTB / UTB)
-
Formula & Definition
-
MTD Trend Charts
-
YTD Trend Charts
-
Actual vs Target vs Previous Year comparison
This helps identify long-term patterns and operational gaps.
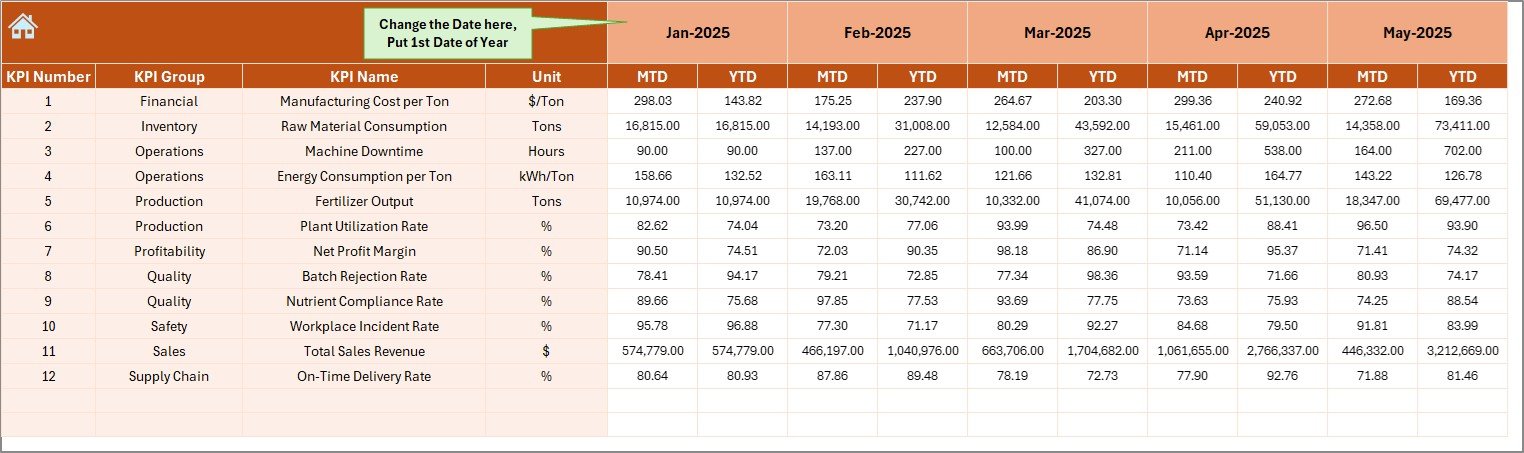
✏️ Actual Numbers Input Sheet – Data Entry Area
This sheet captures operational data.
How It Works
-
Select starting month in cell E1
-
Enter MTD & YTD actual values
-
Dashboard updates automatically
Structured inputs reduce manual errors.
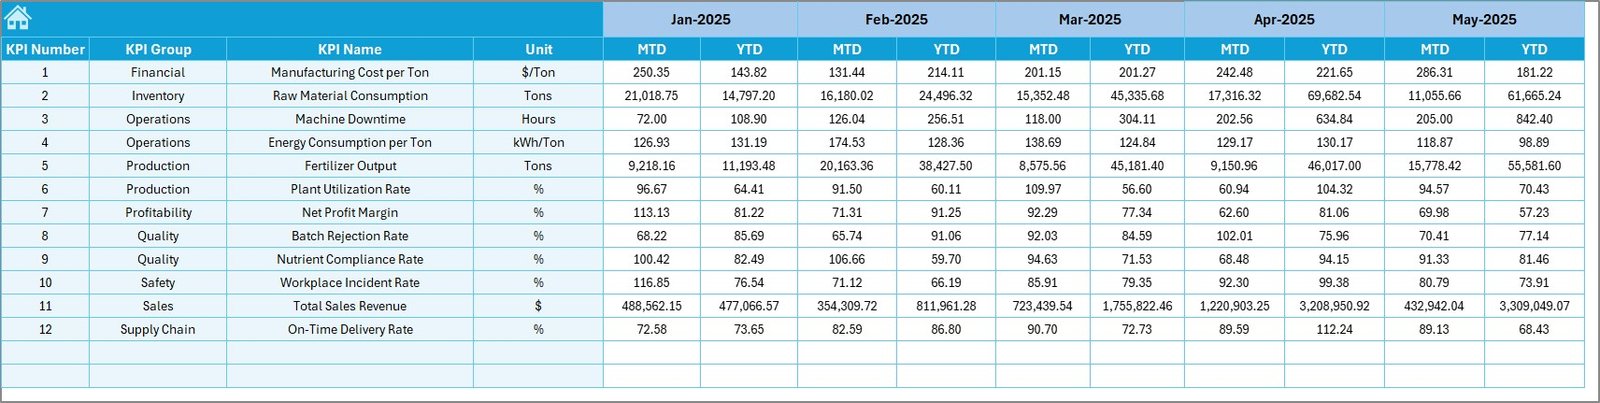
🎯 Target Sheet – Performance Planning
Stores KPI targets used for evaluation.
Users define:
-
Monthly targets
-
YTD targets
-
KPI-specific goals
Targets establish clear performance expectations.
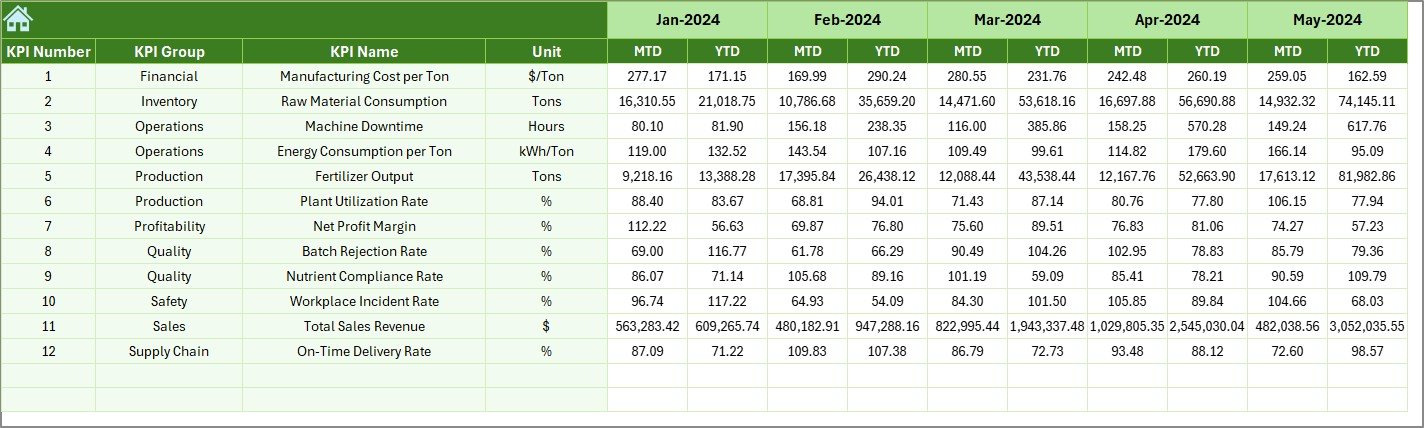
📅 Previous Year Numbers Sheet – Historical Comparison
Maintains last year’s data for benchmarking.
Benefits include:
-
Year-over-year comparison
-
Growth measurement
-
Trend evaluation
Managers easily measure operational improvement.
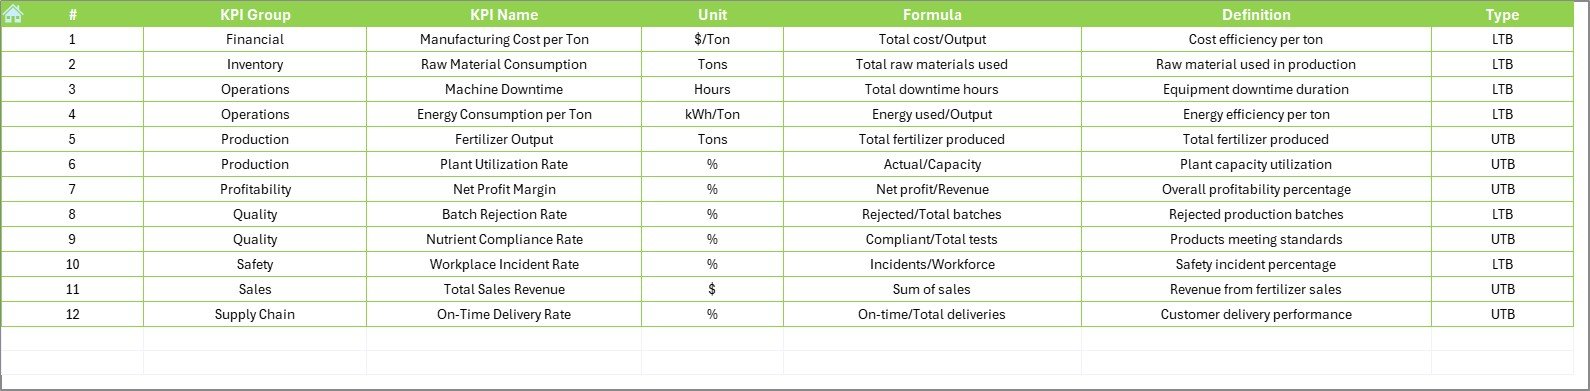
📘 KPI Definition Sheet – KPI Knowledge Base
Acts as a centralized KPI reference.
Includes:
-
KPI Name
-
KPI Group
-
Unit
-
Formula
-
KPI Definition
Ensures consistent KPI understanding across teams.
🧪 What KPIs Can Fertilizer Manufacturers Track?
Production KPIs
-
Production Volume
-
Plant Utilization Rate
-
Downtime Percentage
-
Batch Completion Rate
Quality KPIs
-
Product Purity Level
-
Rejection Rate
-
Quality Compliance Score
Cost KPIs
-
Energy Cost per Ton
-
Raw Material Consumption
-
Maintenance Cost
Supply Chain KPIs
-
Delivery Timeliness
-
Inventory Turnover
-
Logistics Efficiency
Tracking these ensures balanced operational performance.
🚀 How to Use the Fertilizer Manufacturing KPI Dashboard in Excel
1️⃣ Define KPIs aligned with plant objectives
2️⃣ Populate KPI Definition Sheet
3️⃣ Enter monthly targets
4️⃣ Input actual operational data
5️⃣ Review dashboard insights regularly
6️⃣ Take corrective actions based on trends
No advanced Excel expertise required.
👥 Who Can Benefit from This Dashboard
-
Plant Managers
-
Production Supervisors
-
Quality Control Teams
-
Operations Managers
-
Finance Analysts
-
Manufacturing Consultants
Both operational and strategic teams gain actionable insights.
✅ Advantages of Fertilizer Manufacturing KPI Dashboard in Excel
📊 Centralized performance visibility
⚡ Faster operational analysis
💰 Improved cost monitoring
📈 Historical performance comparison
🎯 Better accountability across departments
🔄 Automated reporting process
🛠 Highly customizable structure
💡 Best Practices for Maximum Results
-
Update KPI data regularly
-
Focus on actionable KPIs only
-
Maintain standardized definitions
-
Review trends monthly
-
Train teams on dashboard usage
-
Automate data collection where possible
These practices maximize dashboard effectiveness.
🧠 How This Dashboard Improves Decision-Making
The dashboard converts raw production data into actionable insights:
-
Rising energy cost → analyze consumption trends
-
Production decline → investigate downtime KPIs
-
Quality issues → review process performance
Managers shift from reactive management to proactive optimization.
🏁 Conclusion
The Fertilizer Manufacturing KPI Dashboard in Excel delivers a structured and practical approach to monitoring production, quality, and operational performance. By combining automated calculations, visual indicators, and trend analysis, the dashboard provides instant operational visibility.
Because Excel is flexible, affordable, and widely used, organizations can implement advanced KPI monitoring without complex BI tools. Ultimately, companies that adopt KPI-driven dashboards improve efficiency, control costs, and strengthen strategic decision-making.


