The textile industry is becoming more competitive every day. Customers expect consistent fabric quality, faster delivery timelines, optimized costs, and environmentally responsible production. However, textile dyeing and finishing operations involve complex processes such as chemical handling, machine utilization, labor coordination, and resource consumption monitoring. Without proper performance tracking, even small inefficiencies can lead to higher costs and reduced profitability.
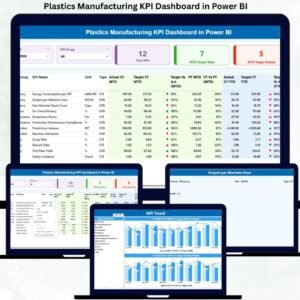
The Textile Dyeing and Finishing KPI Dashboard in Power BI is designed to solve these challenges by transforming operational data into interactive business intelligence insights. Instead of spending hours preparing manual reports, managers can instantly analyze performance using dynamic visuals and automated KPI calculations.
This ready-to-use dashboard combines Excel data management with Power BI’s advanced analytics capabilities. Users simply update KPI values in structured Excel sheets, refresh Power BI, and instantly access updated performance insights. As a result, textile factories gain real-time operational visibility without complex system implementation.
Built specifically for textile dyeing and finishing units, this dashboard enables organizations to monitor production efficiency, quality performance, resource utilization, delivery timelines, and cost control from a single interactive interface.
Whether you are managing production floors, monitoring quality standards, or improving operational strategy, this dashboard helps you move from reactive reporting to proactive decision-making.
✅ Key Feature of Textile Dyeing and Finishing KPI Dashboard in Power BI
📊 Interactive KPI Monitoring — Analyze textile performance through dynamic Power BI visuals and filters.
🎯 Actual vs Target Performance Tracking — Instantly measure KPI achievement with automated indicators.
📅 Smart Slicers & Filters — Analyze results by month and KPI group with one-click filtering.
📈 MTD & YTD Analytics — Track short-term and long-term performance simultaneously.
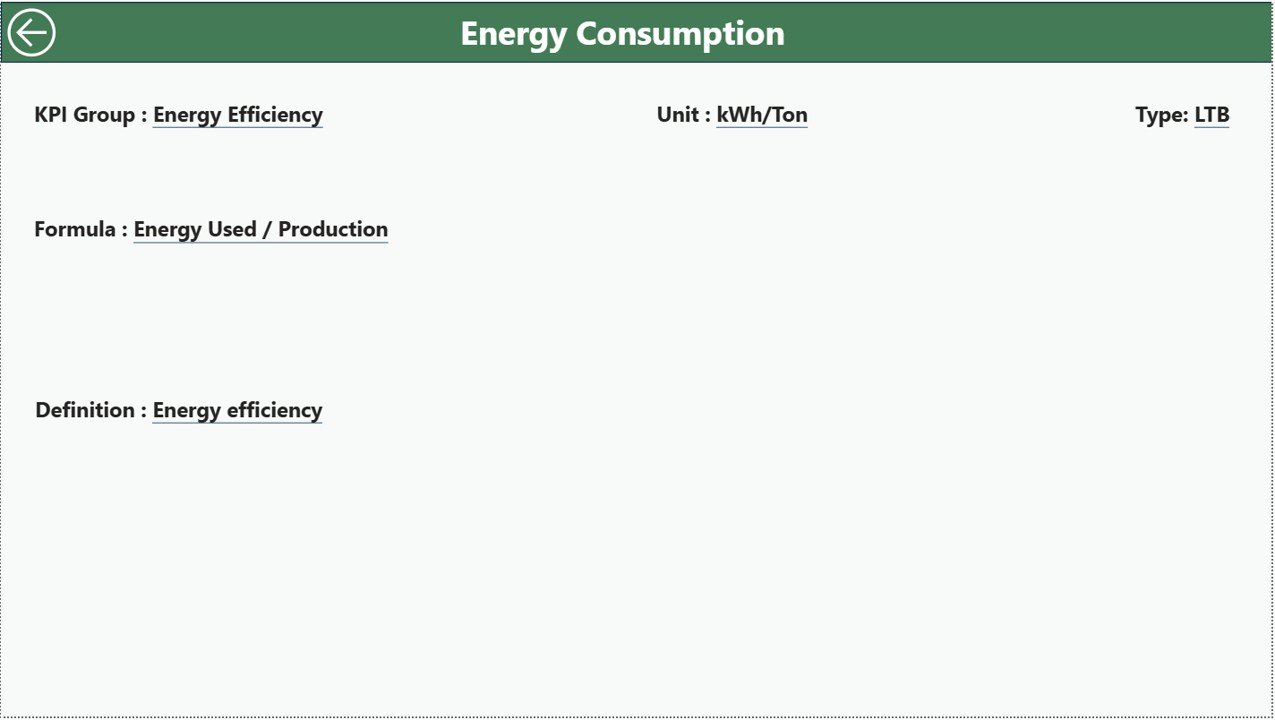
🔍 Drill-Through KPI Definitions — View KPI formulas and explanations directly inside the dashboard.
📉 Trend Analysis Visualization — Compare Current Year, Previous Year, and Target performance trends.
⚡ Excel Integration — Update KPI data easily through structured Excel input sheets.
🚀 Professional BI Experience — Built using Power BI best practices for faster insights.
📦 What’s Inside the Textile Dyeing and Finishing KPI Dashboard in Power BI
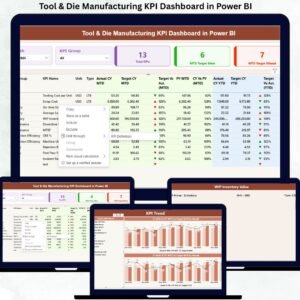
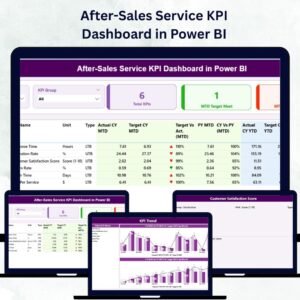
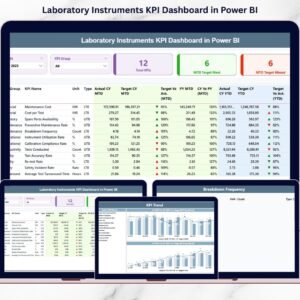
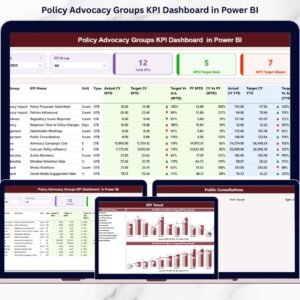
This dashboard includes three powerful analytical pages designed for complete KPI monitoring:
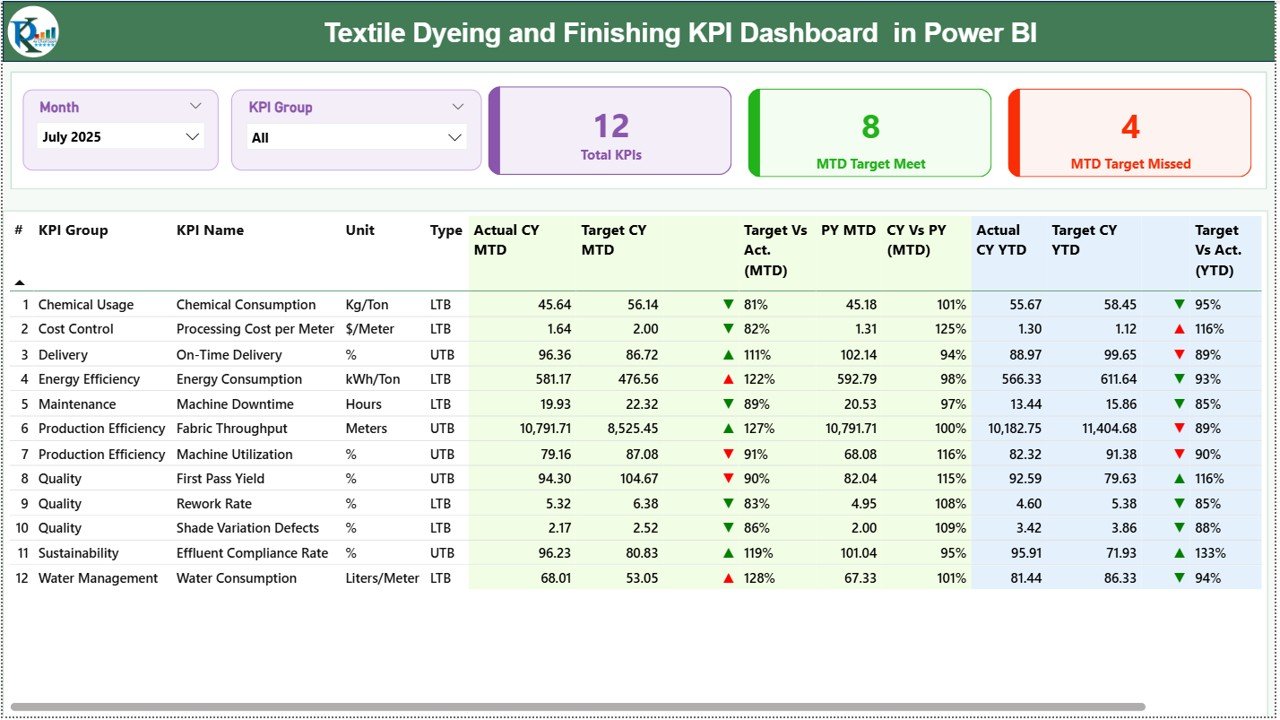
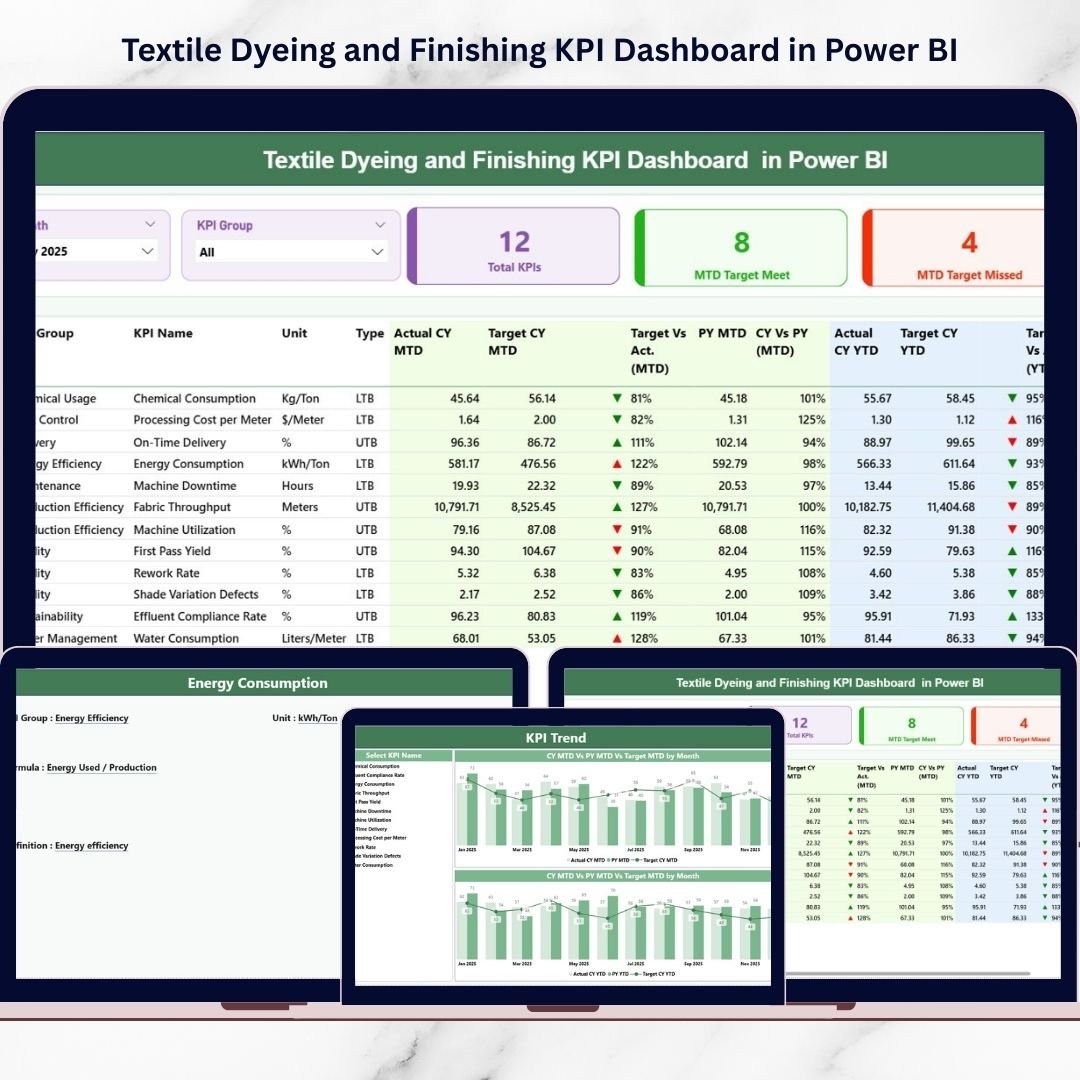
🧭 Summary Page – Central performance overview displaying KPI cards, slicers, and detailed KPI comparison tables with MTD and YTD metrics.
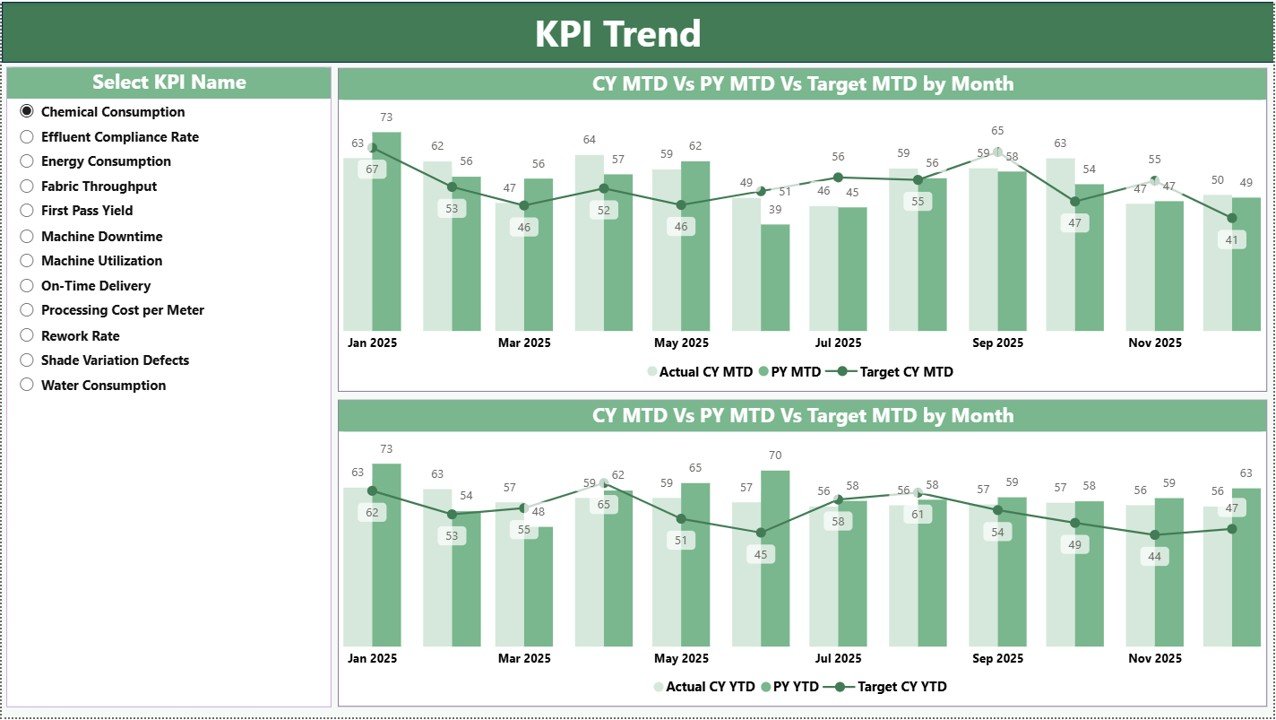
📈 KPI Trend Page – Advanced trend analysis using combo charts comparing Actual, Target, and Previous Year values.
📘 KPI Definition Page – Drill-through page containing KPI formulas, units, groups, and definitions for clarity and consistency.
The dashboard connects seamlessly with an Excel data source containing:
-
Input Actual Sheet for KPI performance entry
-
Input Target Sheet for defining targets
-
KPI Definition Sheet for KPI master data
This structured setup ensures accurate, scalable, and standardized performance tracking.
⚙️ How to Use the Textile Dyeing and Finishing KPI Dashboard
Using this dashboard is simple and beginner-friendly:
1️⃣ Enter KPI values in the Excel Input Actual sheet.
2️⃣ Update targets in the Input Target sheet.
3️⃣ Maintain KPI definitions in the master sheet.
4️⃣ Refresh Power BI data.
5️⃣ Use slicers and visuals to analyze insights instantly.
Within seconds, decision-makers can identify inefficiencies, compare results, and take corrective actions.
👥 Who Can Benefit from This Textile Dyeing and Finishing KPI Dashboard
This dashboard is ideal for:
🏭 Textile Plant Managers monitoring operational performance
👨🏭 Production Supervisors improving productivity
🎨 Dyeing & Finishing Teams ensuring quality standards
✅ Quality Assurance Professionals reducing defects
📊 Operations Analysts evaluating performance trends
⚙️ Continuous Improvement Teams driving efficiency initiatives
Because of its intuitive interface, both technical and non-technical users can use it confidently.
By converting raw textile operational data into clear visual intelligence, this dashboard enables faster decisions, improved efficiency, reduced waste, and stronger profitability. Instead of reacting to problems late, organizations gain proactive insights that support continuous improvement and sustainable growth.
### Click here to read the Detailed blog post
Visit our YouTube channel to learn step-by-step video tutorials:
👉 https://youtube.com/@PKAnExcelExpert