


Running a successful online marketplace business today is no longer just about listing products. Sellers and marketplace managers must constantly monitor sales performance, customer behavior, fulfillment efficiency, and operational outcomes. Without proper tracking, businesses often rely on scattered reports and manual analysis, which leads to slow decisions and missed opportunities.That’s exactly why the Online Marketplaces KPI Scorecard in Excel was created.This ready-to-use Excel solution transforms complex marketplace data into a clear, visual, and actionable performance system. Instead of spending hours preparing reports, you can instantly evaluate results, compare targets with actual performance, and identify growth opportunities from one centralized dashboard.
Whether you sell on Amazon, Flipkart, Etsy, Shopify marketplaces, or multiple platforms simultaneously, this KPI scorecard helps you monitor performance with clarity and confidence — without expensive analytics software.
Built using powerful Excel features like dropdown menus, automated calculations, conditional formatting, and dynamic charts, this scorecard converts raw numbers into meaningful business insights within seconds.
🚀 Key Features of Online Marketplaces KPI Scorecard in Excel
✅ Interactive KPI scorecard dashboard for instant performance visibility
✅ Month, MTD, and YTD performance analysis using dropdown selections
✅ Actual vs Target comparison with visual performance indicators
✅ Automated KPI trend charts for growth monitoring
✅ Color-coded status signals for quick decision-making
✅ Centralized KPI tracking across multiple marketplaces
✅ Dynamic dashboard updates after data entry
✅ Structured KPI documentation system
✅ Beginner-friendly design with no technical skills required
✅ Fully customizable KPIs based on business needs
📦 What’s Inside the Online Marketplaces KPI Scorecard in Excel
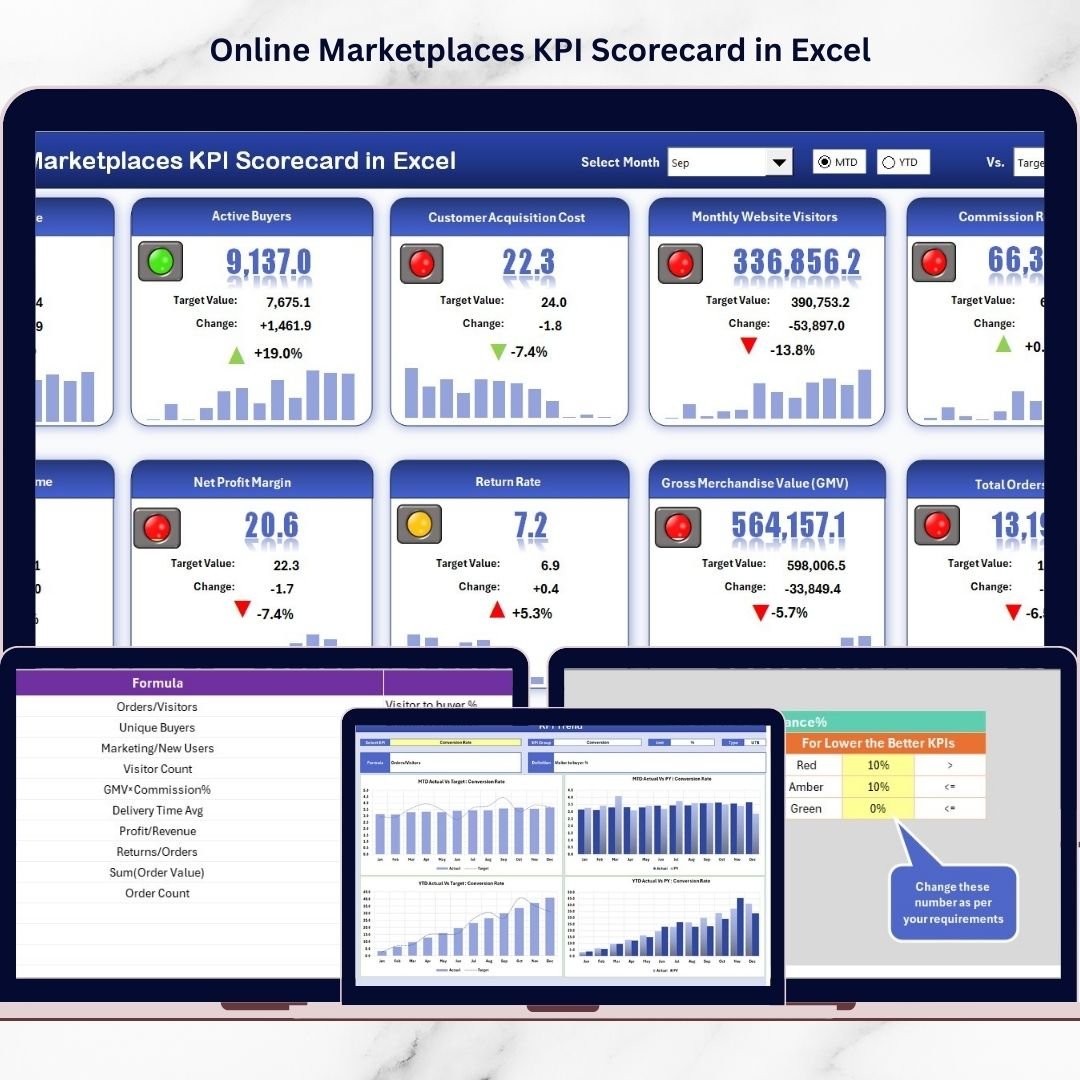
This template includes four professionally designed worksheets that work together as a complete performance management system:
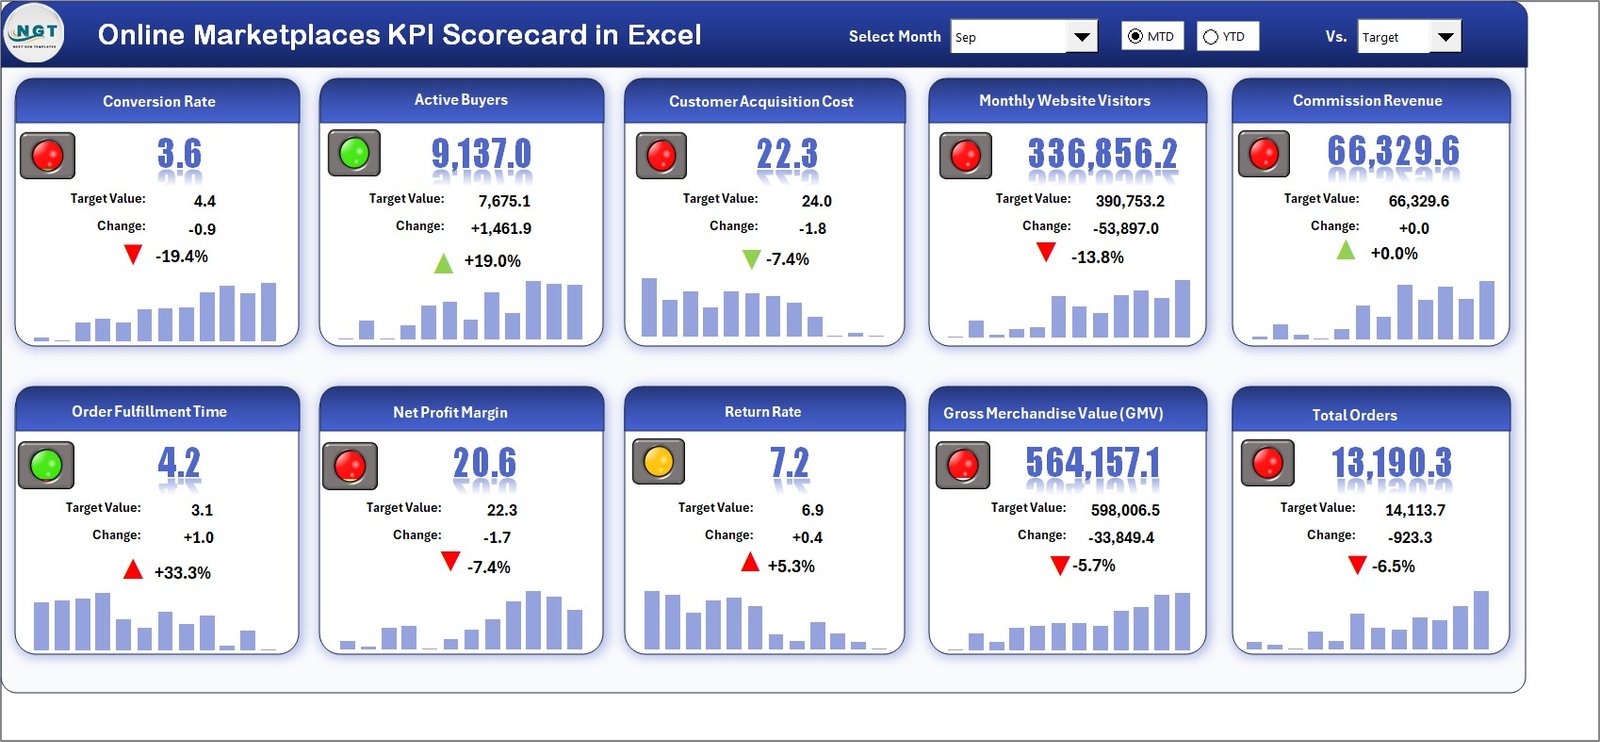
1️⃣ Scorecard Sheet – Main Dashboard
View up to 10 KPIs in one screen with performance indicators, targets, and comparisons for faster evaluation.
2️⃣ KPI Trend Sheet – Performance Analysis
Analyze KPI performance over time using automated trend charts and comparisons with previous periods.
3️⃣ Input Data Sheet – Data Entry Hub
Enter monthly actual values and targets in one structured location while dashboards update automatically.
4️⃣ KPI Definition Sheet – KPI Documentation
Maintain KPI formulas, definitions, and units to ensure reporting consistency across teams.
⚙️ How to Use the Online Marketplaces KPI Scorecard in Excel
Getting started takes only a few minutes:
1️⃣ Define KPIs in the KPI Definition sheet.
2️⃣ Enter targets and actual performance data.
3️⃣ Select reporting period (Month / MTD / YTD).
4️⃣ Review dashboard performance instantly.
5️⃣ Analyze trends using automated charts.
Because calculations are automated, you focus more on decision-making and less on reporting work.
👥 Who Can Benefit from This Online Marketplaces KPI Scorecard
This template is ideal for professionals managing marketplace performance:
🛒 Marketplace Sellers tracking sales and listing efficiency
📊 E-commerce Managers monitoring multi-platform operations
🏢 Business Owners analyzing profitability trends quickly
🚚 Operations Teams improving fulfillment performance
📈 Marketing Teams measuring campaign impact and conversions
💼 Analysts seeking structured KPI monitoring without complex tools
If your business depends on marketplace performance, this scorecard becomes an essential management tool.
Using this KPI scorecard helps you:
✔ Identify underperforming areas instantly
✔ Improve operational efficiency
✔ Make faster data-driven decisions
✔ Track progress against business goals
✔ Strengthen strategic planning
Instead of reacting to problems late, you gain proactive control over marketplace performance.
Click here to read the Detailed blog post
Watch the step-by-step video tutorial:


