The wine industry runs on precision, timing, and uncompromising quality. Yet many wineries still depend on scattered spreadsheets and time-consuming manual reports. As a result, leaders struggle to track fermentation efficiency, production yield, sales performance, and inventory levels in one unified view.That is exactly why the Winemaking KPI Dashboard in Excel is a game-changer.This powerful, ready-to-use Excel dashboard gives winery owners, production managers, and operations teams real-time visibility into critical KPIs — all from one dynamic interface. Instead of reacting to problems late, your team can identify performance gaps early and take data-driven action.
Built with usability and performance in mind, this template transforms raw winery data into clear, actionable insights within minutes.
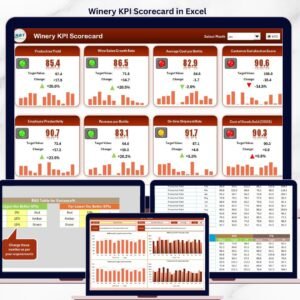
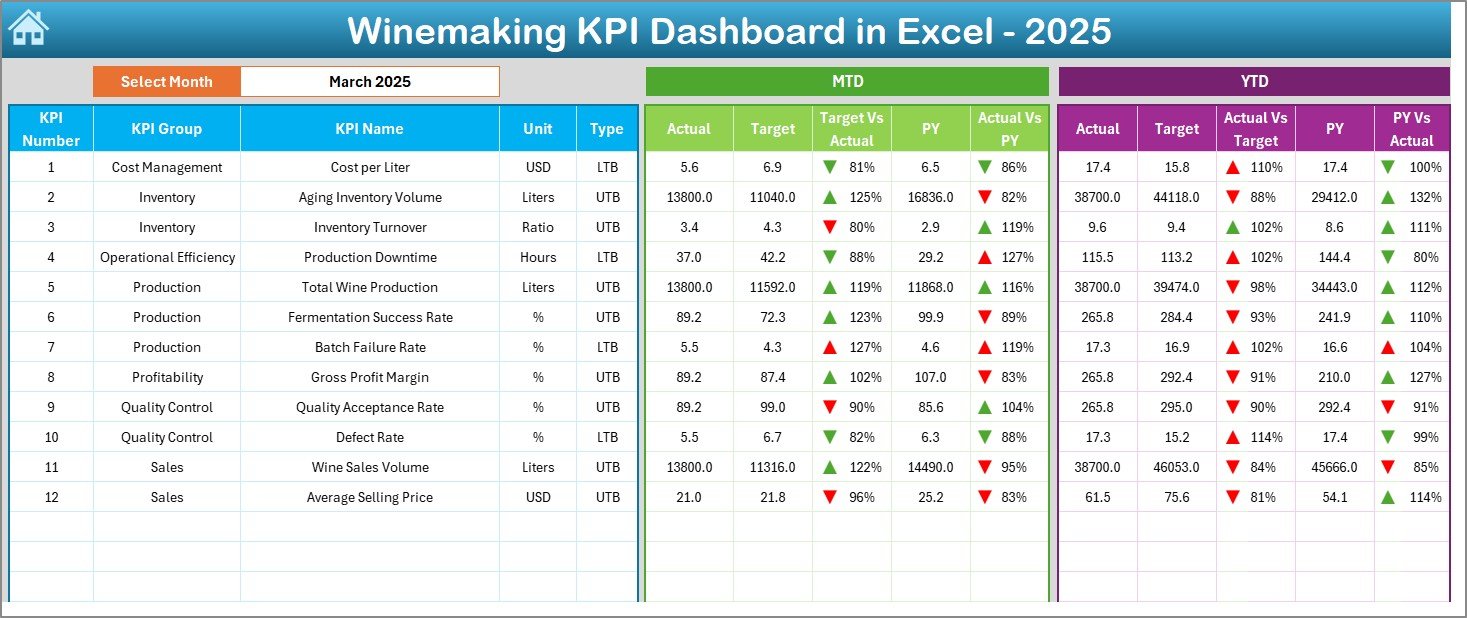
🚀 Key Feature of Winemaking KPI Dashboard in Excel
✅ Interactive Monthly Dashboard – Instantly analyze performance using the month selector at cell D3.
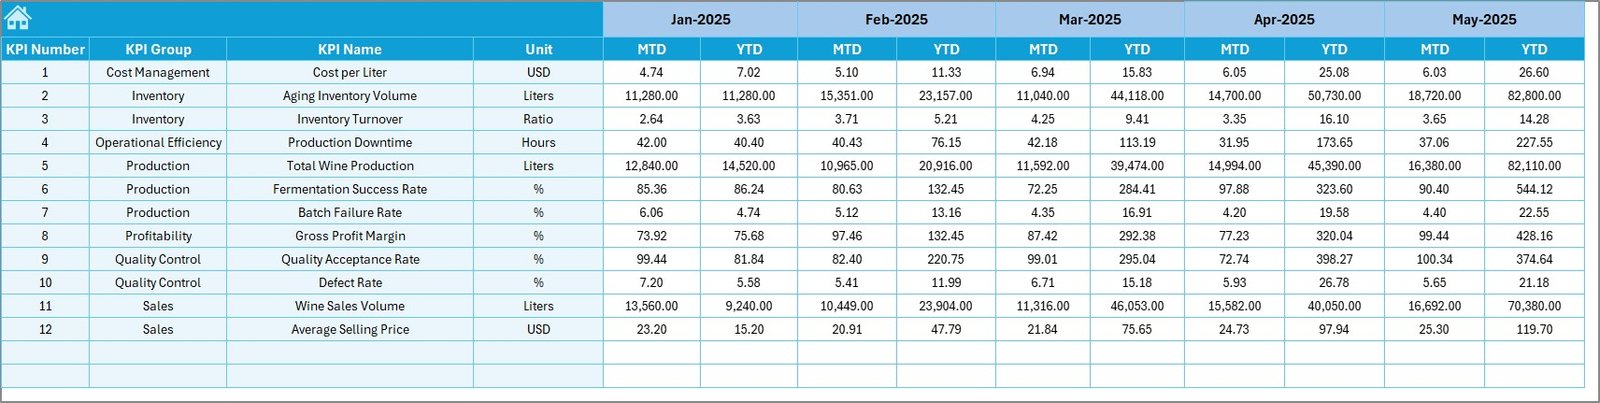
✅ MTD & YTD Tracking – Monitor both short-term and yearly performance side by side.
✅ Visual Performance Indicators – Up/down arrows and color coding highlight risks immediately.
✅ Deep KPI Trend Analysis – Dedicated Trend sheet for individual KPI monitoring.
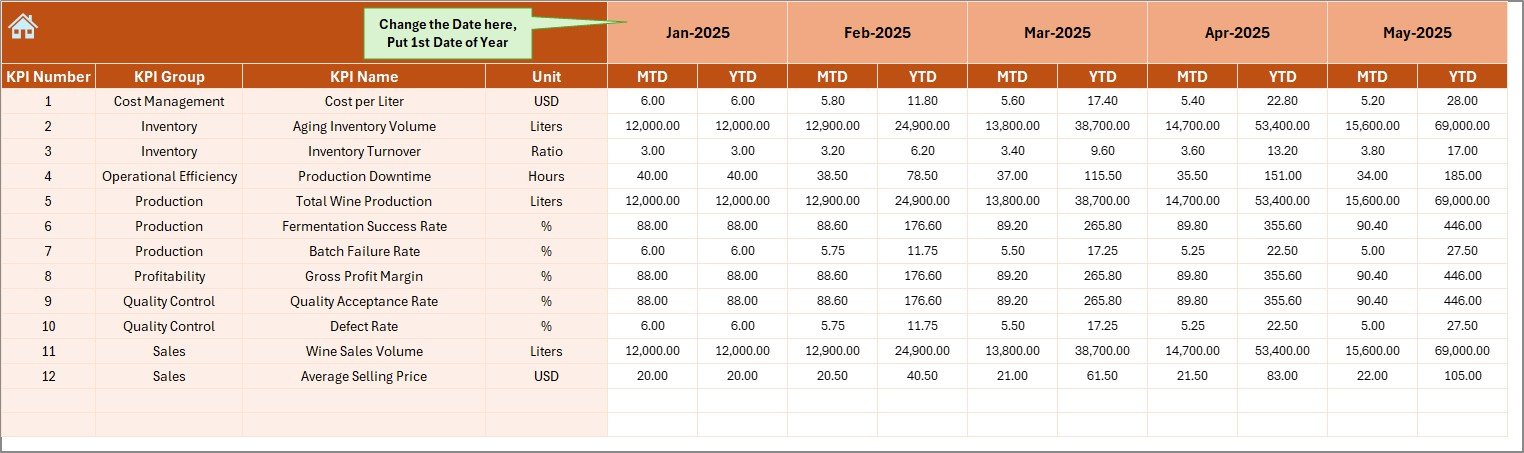
✅ Structured Data Entry Sheets – Clean input areas for Actual, Target, and Previous Year data.
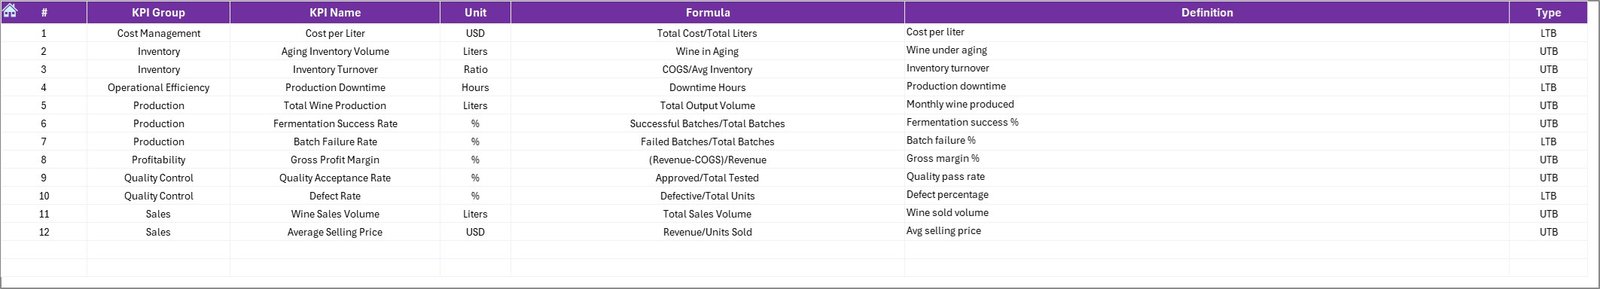
✅ Central KPI Definition Dictionary – Standardize formulas, units, and KPI meanings.
✅ One-Click Navigation Hub – Six navigation buttons for smooth user experience.
Because of these features, winery teams gain complete operational clarity without complex BI tools.
📦 What’s Inside the Winemaking KPI Dashboard in Excel
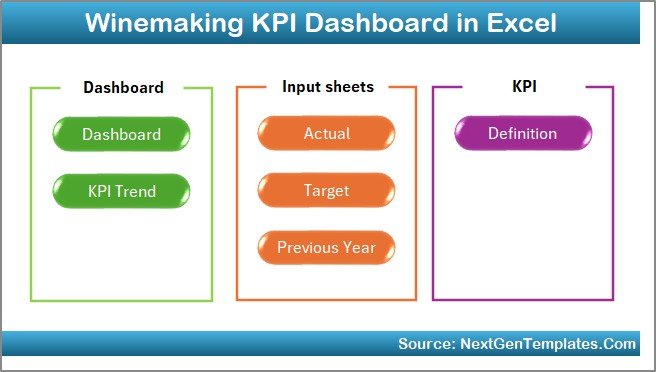
This professionally designed template includes 7 fully structured worksheets:
1️⃣ Summary Page
Your navigation hub with six buttons for quick movement across the dashboard.
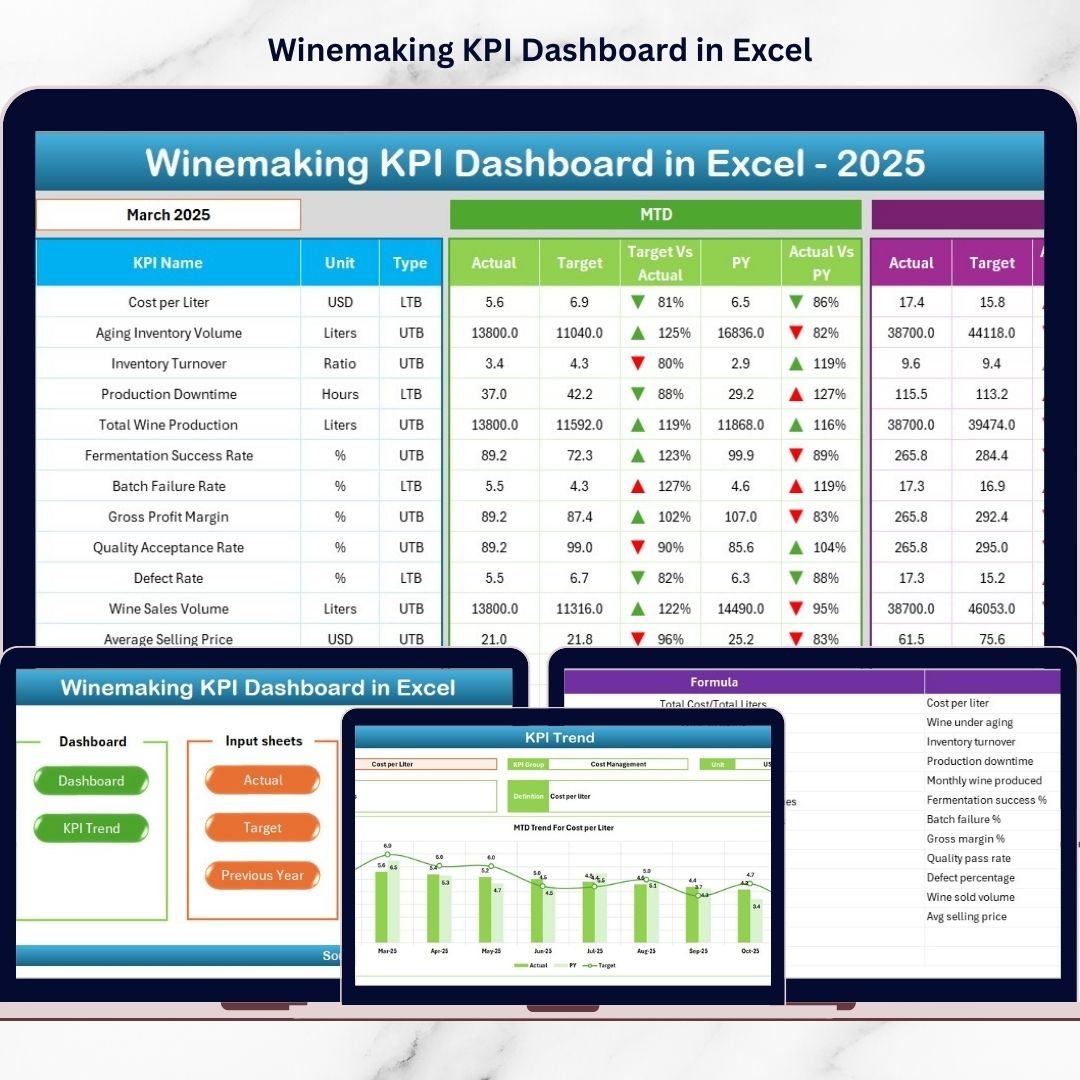
2️⃣ Dashboard Sheet
The main control panel showing:
-
MTD Actual, Target, Previous Year
-
YTD comparisons
-
Variance analysis
-
Visual performance arrows
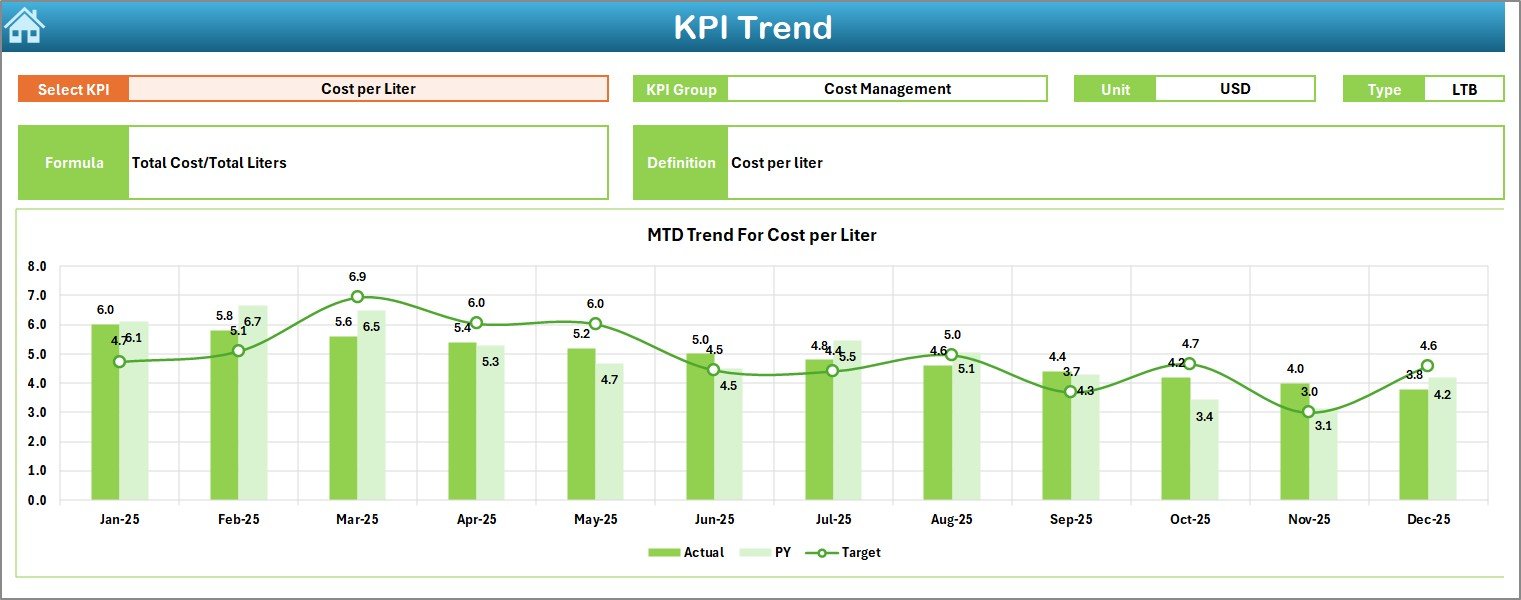
3️⃣ Trend Sheet
Deep-dive KPI analysis with:
-
KPI selector (cell C3)
-
KPI group, unit, and formula
-
MTD and YTD trend charts
-
Actual vs Target vs PY comparison
4️⃣ Actual Numbers Input Sheet
Primary data entry area for current year performance with dynamic month control.
5️⃣ Target Sheet
Stores monthly and yearly KPI benchmarks for accurate performance evaluation.
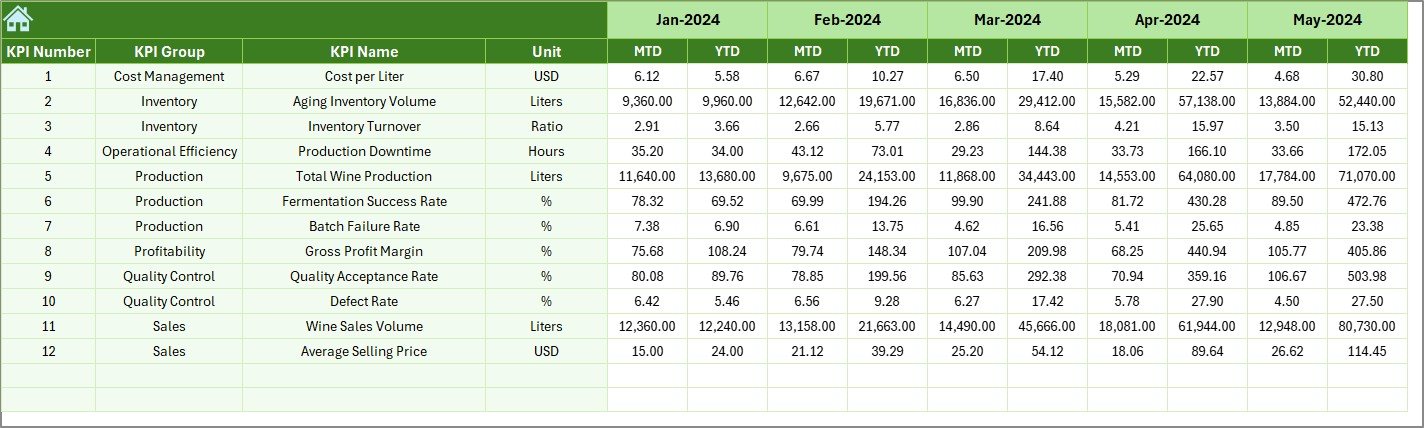
6️⃣ Previous Year Numbers Sheet
Enables powerful historical comparisons and seasonality analysis.
7️⃣ KPI Definition Sheet
Acts as the KPI dictionary ensuring consistent calculations and easy user onboarding.
Together, these sheets create a complete winery performance monitoring system.
⚙️ How to Use the Winemaking KPI Dashboard in Excel
Getting started is fast and simple:
-
Open the Excel template
-
Update the KPI Definition sheet
-
Enter targets in the Target sheet
-
Input previous year values
-
Add current actual data
-
Select the desired month on the Dashboard
-
Review instant performance insights
Within minutes, your winery transforms raw data into executive-ready intelligence.
👥 Who Can Benefit from This Winemaking KPI Dashboard in Excel
This dashboard is designed for end-to-end winery management.
Perfect for:
-
🍷 Winery Owners
-
🏭 Production Managers
-
⚙️ Operations Teams
-
🧪 Quality Managers
-
💰 Finance Teams
-
📦 Supply Chain Managers
Whether you run a boutique vineyard or a large wine production facility, this tool delivers immediate value.
By implementing the Winemaking KPI Dashboard in Excel, wineries gain:
-
Faster decision-making
-
Complete performance visibility
-
Reduced manual reporting
-
Better target control
-
Early problem detection
-
Cost-effective analytics
In today’s competitive wine market, reactive reporting is no longer enough. You need proactive, real-time performance management.
This dashboard gives you exactly that.
Click here to read the Detailed blog post
Watch the step-by-step video tutorial: