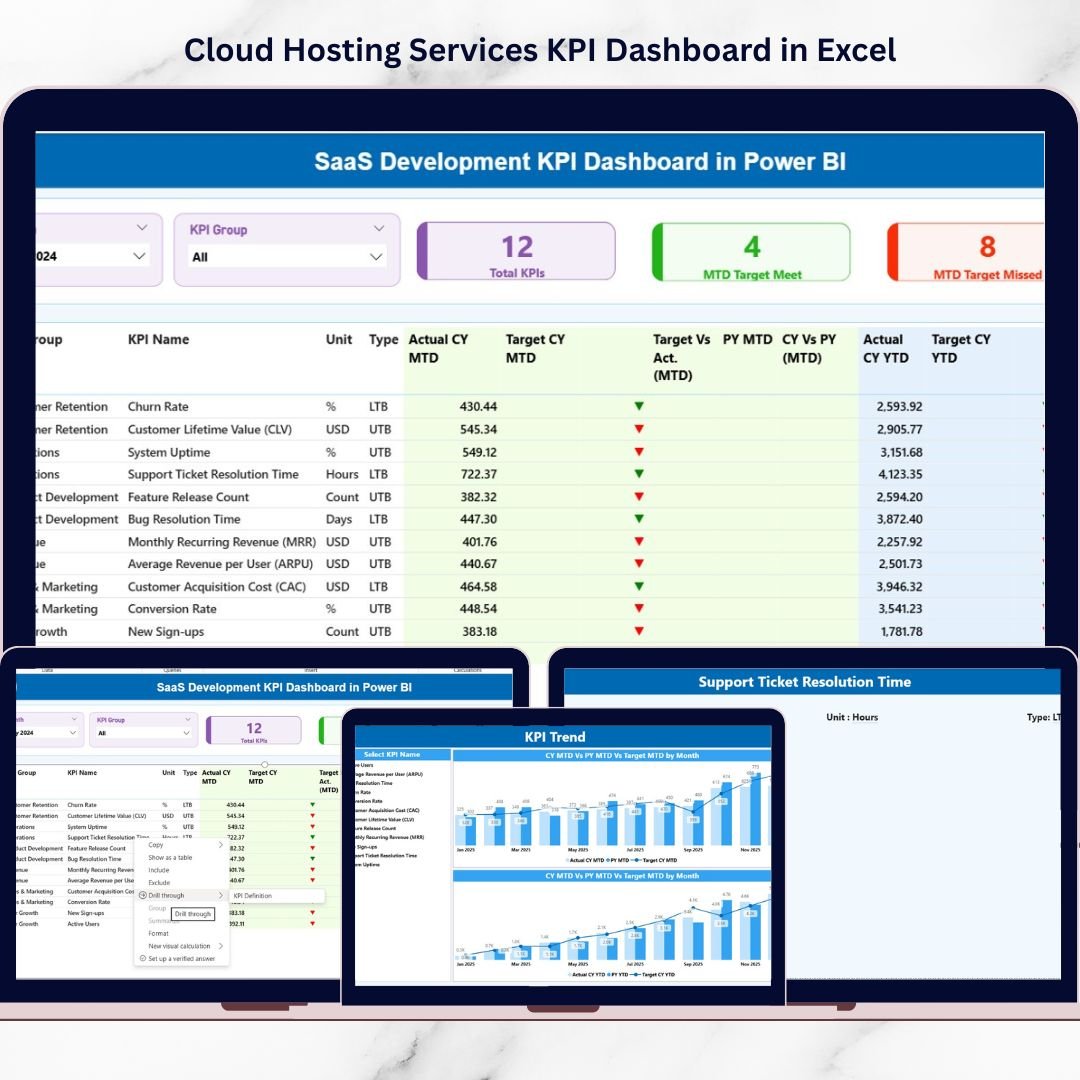
In the SaaS world, growth is everything — but uncontrolled growth is chaos. You may launch features fast, acquire customers aggressively, and push new releases weekly. Yet without structured KPI tracking, your strategy becomes guesswork.What if you could monitor revenue, churn, development efficiency, and performance trends in one powerful system?That’s exactly what the SaaS Development KPI Dashboard in Power BI delivers.This ready-to-use Power BI dashboard transforms structured Excel data into interactive, executive-level insights. It tracks MTD (Month-To-Date) and YTD (Year-To-Date) performance, compares actual vs target values, and highlights trends using visual indicators — so you always know where your SaaS business stands.
Stop juggling spreadsheets. Start scaling with clarity.
🚀 Key Feature of SaaS Development KPI Dashboard in Power BI
📊 3 Interactive Dashboard Pages – Summary, KPI Trend, and KPI Definition pages for complete visibility.
📅 Dynamic Month & KPI Group Slicers – Instantly filter performance data.
📈 MTD & YTD Comparison – Monitor short-term and long-term performance together.
🎯 Target vs Actual Tracking – Instantly see which KPIs are meeting targets.
🔺🔻 Visual Performance Indicators – Green ▲ and Red ▼ icons show direction clearly.
📉 Previous Year Comparison – Analyze growth stability and trends.
📂 Structured Excel Data Integration – Simple input sheets, automatic calculations.
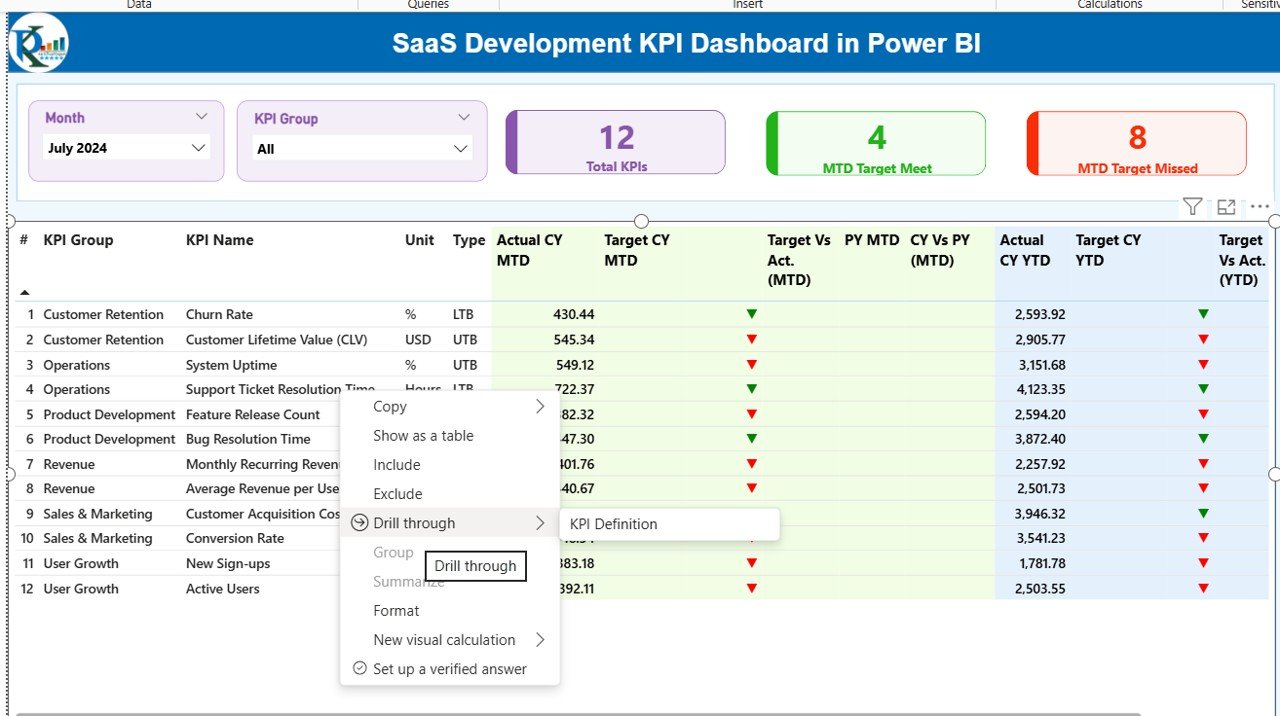
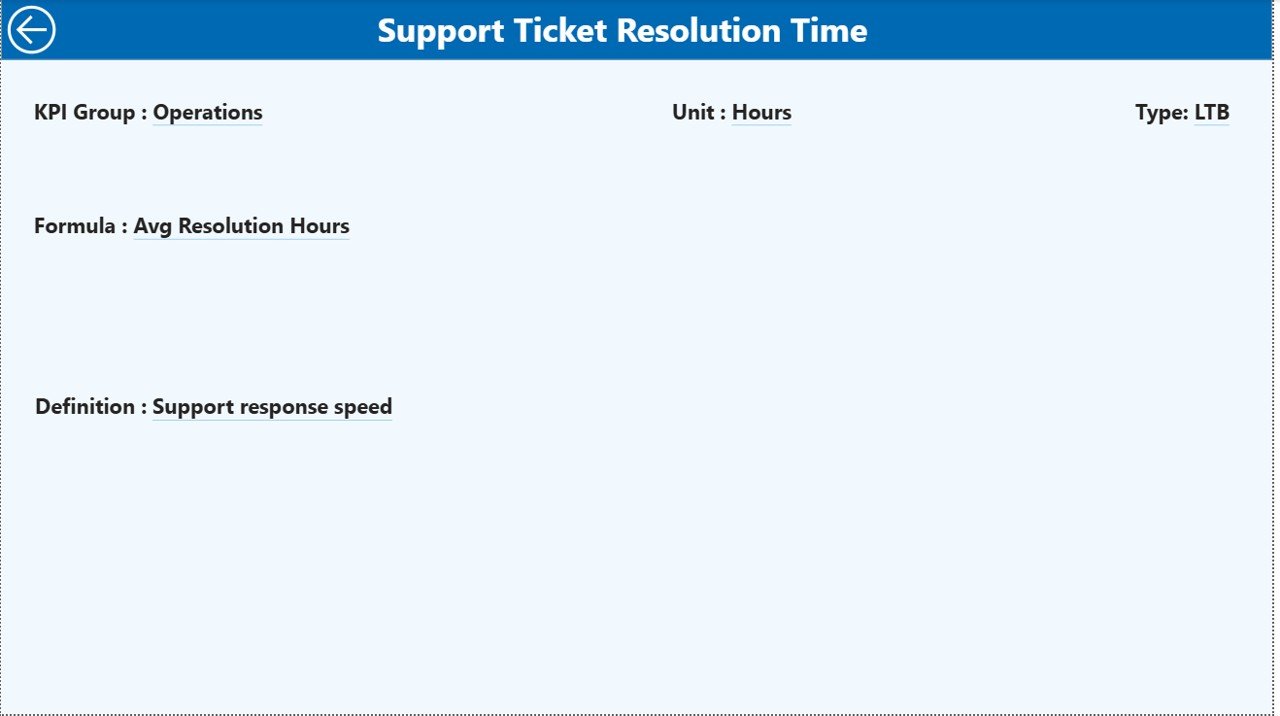
🔎 Drill-Through KPI Definition Page – View formula, definition, and KPI type instantly.
Because of these features, decision-making becomes faster, clearer, and data-driven.
📦 What’s Inside the SaaS Development KPI Dashboard in Power BI
When you purchase this product, you receive:
✔️ Power BI Desktop File (.pbix)
✔️ Structured Excel Data File
✔️ Three Pre-Designed Dashboard Pages
✔️ KPI Definition Framework
✔️ MTD & YTD Calculation Logic
✔️ Target Achievement Indicators
✔️ Previous Year Comparison Setup
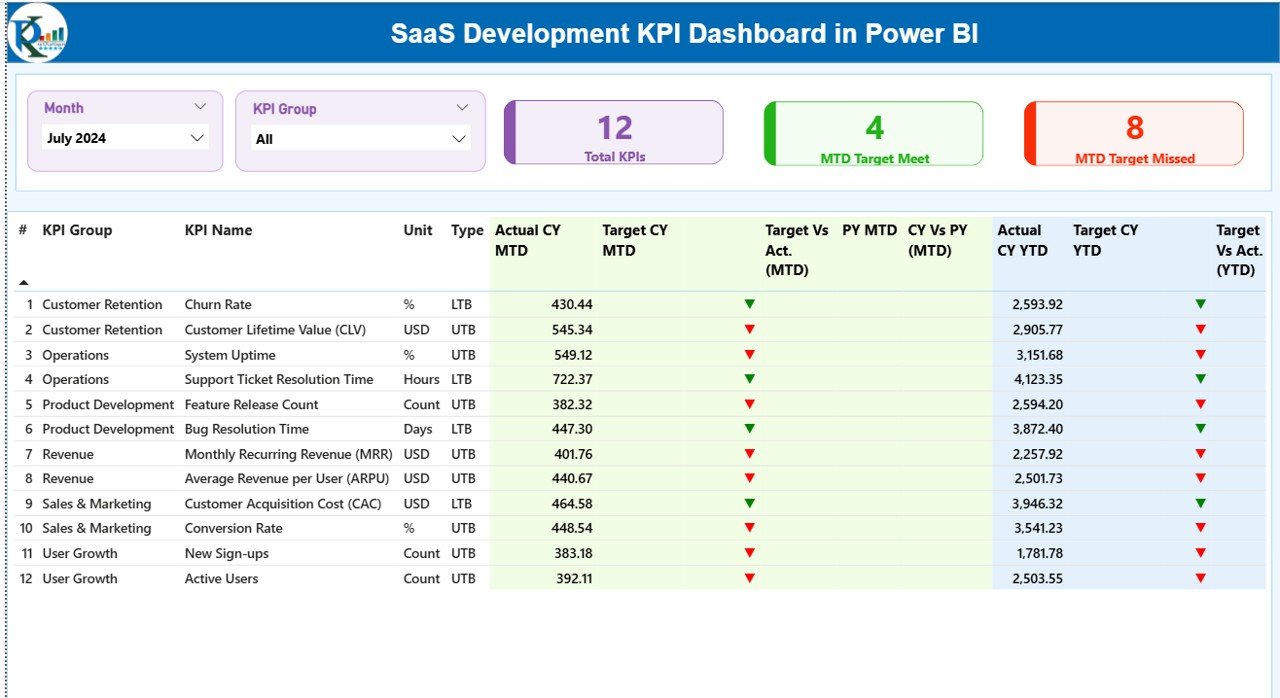
The Summary Page includes KPI cards such as:
-
Total KPI Count
-
MTD Target Meet Count
-
MTD Target Missed Count
The detailed KPI table displays:
-
Actual vs Target (MTD & YTD)
-
Previous Year comparison
-
UTB / LTB KPI type
-
Percentage achievement metrics
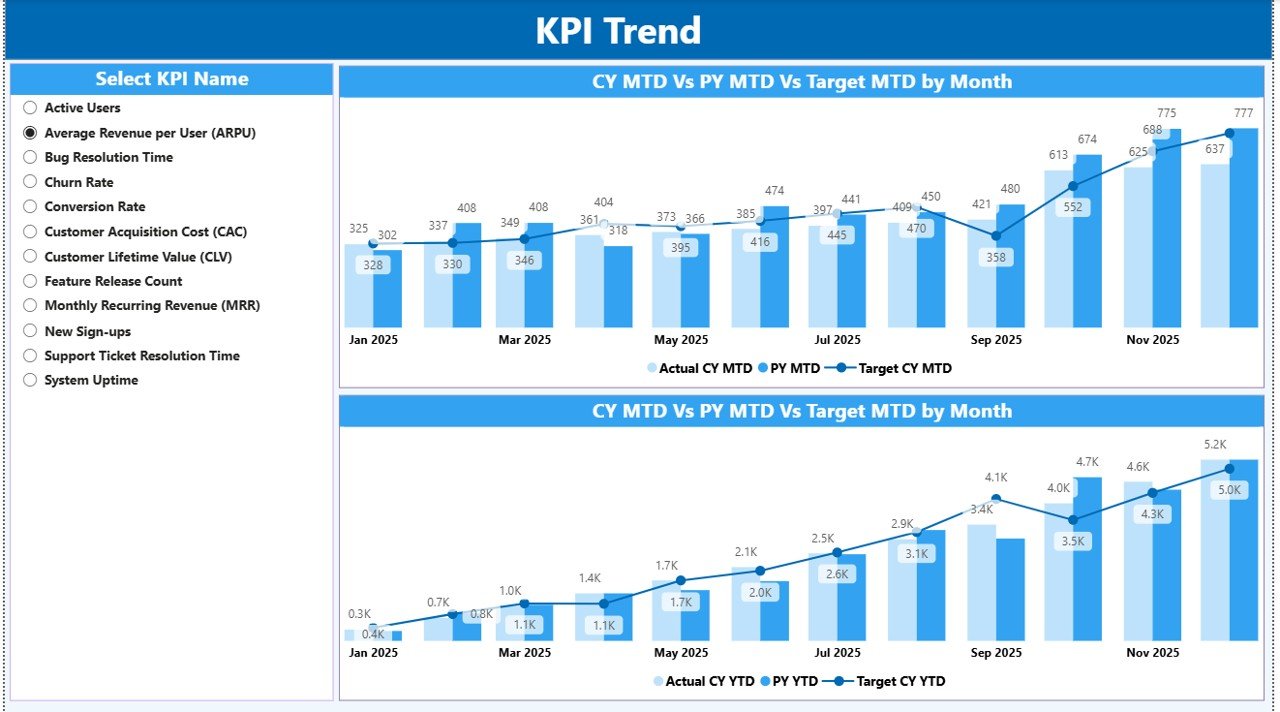
The KPI Trend Page provides combo charts for deep analysis.
The KPI Definition Page explains every metric clearly.
Everything is structured, automated, and ready to use.
⚙️ How to Use the SaaS Development KPI Dashboard in Power BI
Using this dashboard is simple and beginner-friendly.
1️⃣ Open the Excel file.
2️⃣ Update three sheets:
-
Input_Actual
-
Input_Target
-
KPI Definition
3️⃣ Enter data using the first date of the month format.
4️⃣ Refresh the Power BI file.
5️⃣ Instantly view updated insights.
There is no need for advanced DAX skills. No need for complex calculations. Just update Excel — Power BI handles the rest.
Within minutes, your SaaS performance becomes crystal clear.
👥 Who Can Benefit from This SaaS Development KPI Dashboard in Power BI
This dashboard is ideal for:
👨💼 SaaS Founders & CEOs
📊 Product Managers
💻 Development Teams
📈 Growth & Marketing Teams
💰 Finance & Revenue Teams
📑 Investor Reporting Teams
🚀 Startup Founders Scaling Their SaaS
If you want structured visibility across revenue, churn, development speed, and feature adoption — this dashboard is built for you.
A SaaS company cannot scale on assumptions. It must track performance consistently. This dashboard centralizes your KPIs, highlights performance gaps, and supports smarter decisions.
When churn increases, you see it instantly.
When revenue improves, it’s clearly visible.
When development slows, indicators highlight the issue.
Instead of wasting hours consolidating reports, you focus on strategy and execution.
This isn’t just a dashboard. It’s your SaaS growth control center.


