Laboratories depend on precision, uptime, and compliance. But if you are still managing instrument KPIs using multiple Excel sheets, manual calculations, and disconnected reports, you are losing time and visibility.
What if you could monitor utilization, downtime, calibration compliance, and maintenance performance in one powerful dashboard?
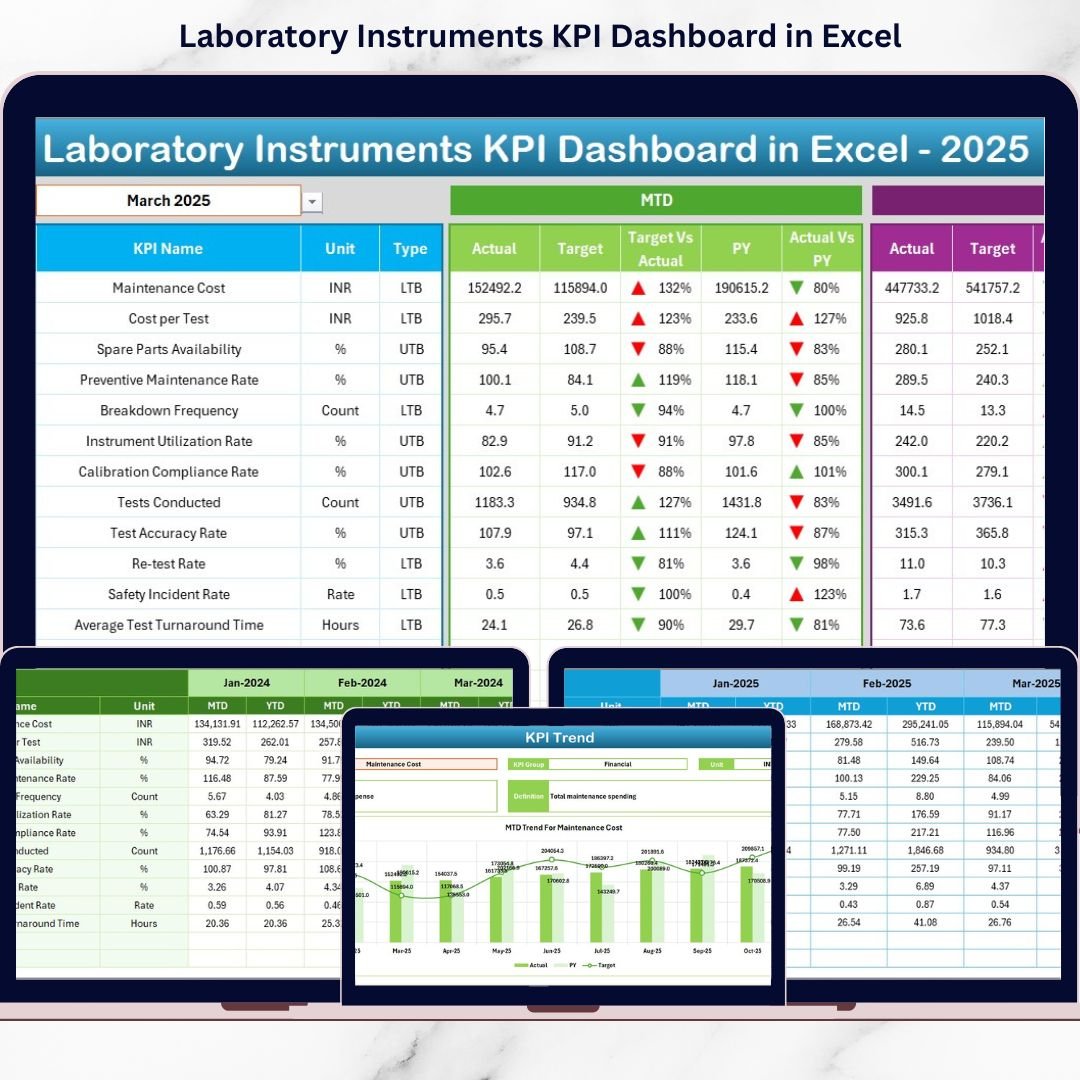
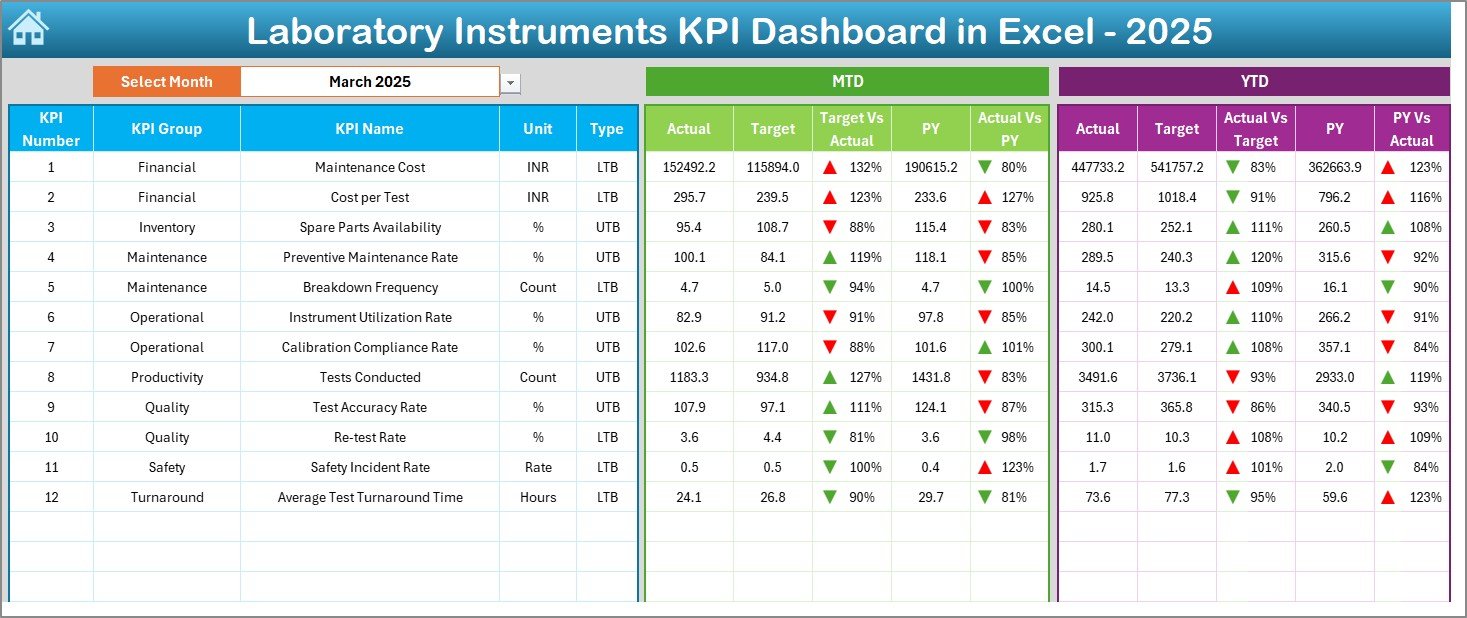
The Laboratory Instruments KPI Dashboard in Excel is a ready-to-use, professionally designed performance monitoring solution that centralizes all critical laboratory instrument KPIs into one structured system.
With dynamic month selection, automated MTD & YTD comparisons, and visual performance indicators, this dashboard transforms raw data into actionable insights within seconds.
Stop reacting late. Start managing proactively. 🚀
🚀 Key Features of Laboratory Instruments KPI Dashboard in Excel
📊 1️⃣ Interactive Monthly Dashboard
Select any month from a drop-down (Cell D3) and instantly view:
-
MTD Actual vs Target
-
YTD Actual vs Target
-
Previous Year comparison
-
Performance direction arrows (⬆️⬇️)
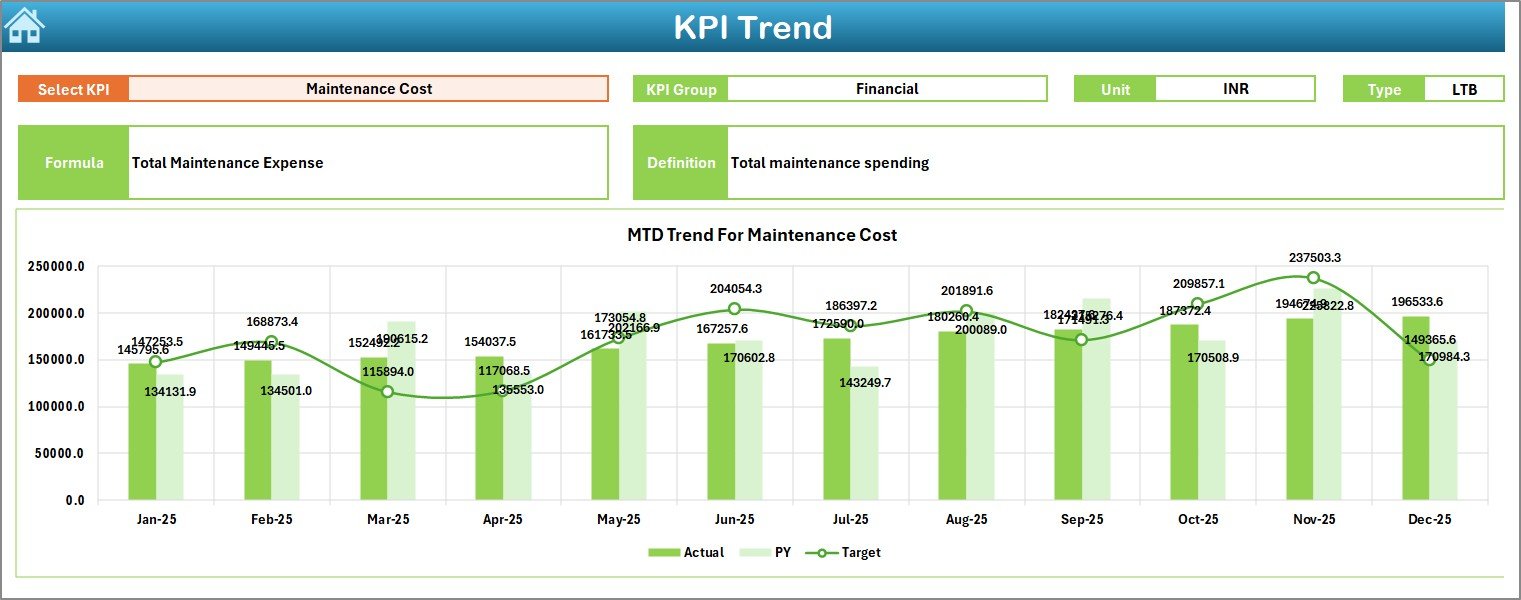
📈 2️⃣ KPI Trend Analysis Sheet
Analyze KPI-level performance trends with:
-
MTD & YTD trend charts
-
Target vs Actual comparison
-
Lower/Upper KPI logic
-
KPI definitions and formulas
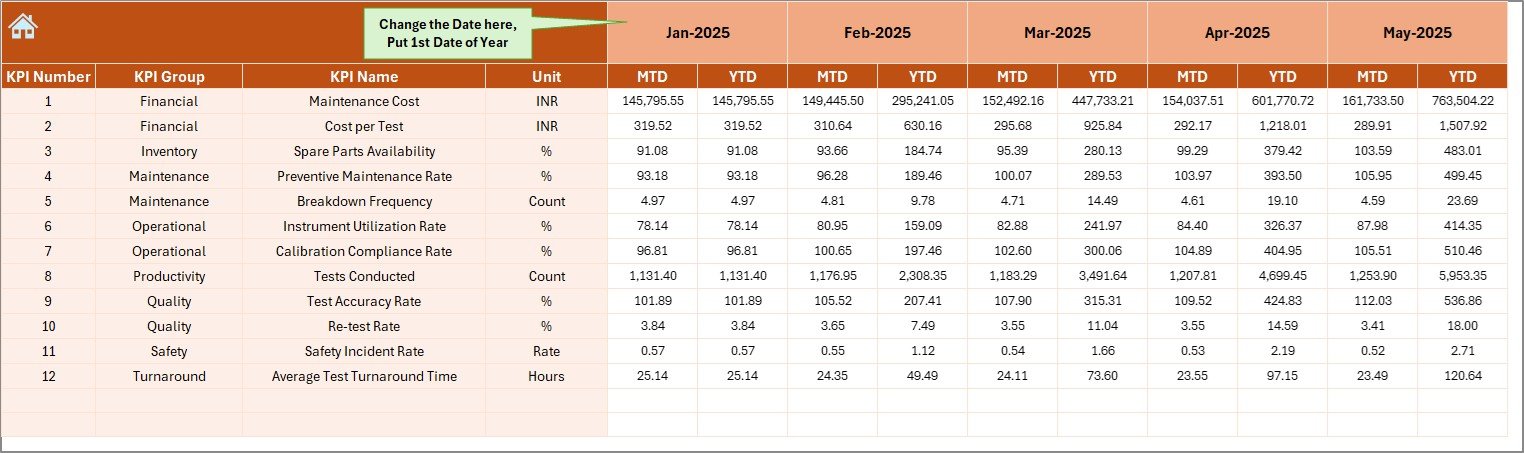
🧾 3️⃣ Structured Data Entry Sheets
Dedicated sheets for:
-
Actual Numbers
-
Targets
-
Previous Year Data
-
KPI Definitions
Everything updates automatically.
🧭 4️⃣ User-Friendly Home Page
Navigation buttons allow easy movement across all worksheets without confusion.
🎯 5️⃣ Real-Time Comparison
Compare:
-
Actual vs Target
-
Current Year vs Previous Year
-
Monthly vs Year-to-Date performance
🔍 6️⃣ Clear Visual Indicators
Conditional formatting arrows highlight improvement or decline instantly.
🛠 7️⃣ Fully Customizable Structure
Add new KPIs anytime. Modify financial year. Adjust targets easily.
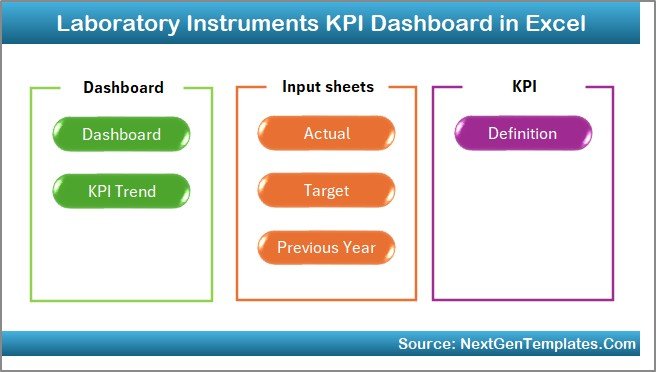
📦 What’s Inside the Laboratory Instruments KPI Dashboard in Excel
This dashboard includes 7 professionally structured worksheets:
-
🏠 Home Sheet – Clean navigation interface
-
📊 Main Dashboard Sheet – Core KPI monitoring (MTD & YTD)
-
📈 KPI Trend Sheet – Detailed trend analysis
-
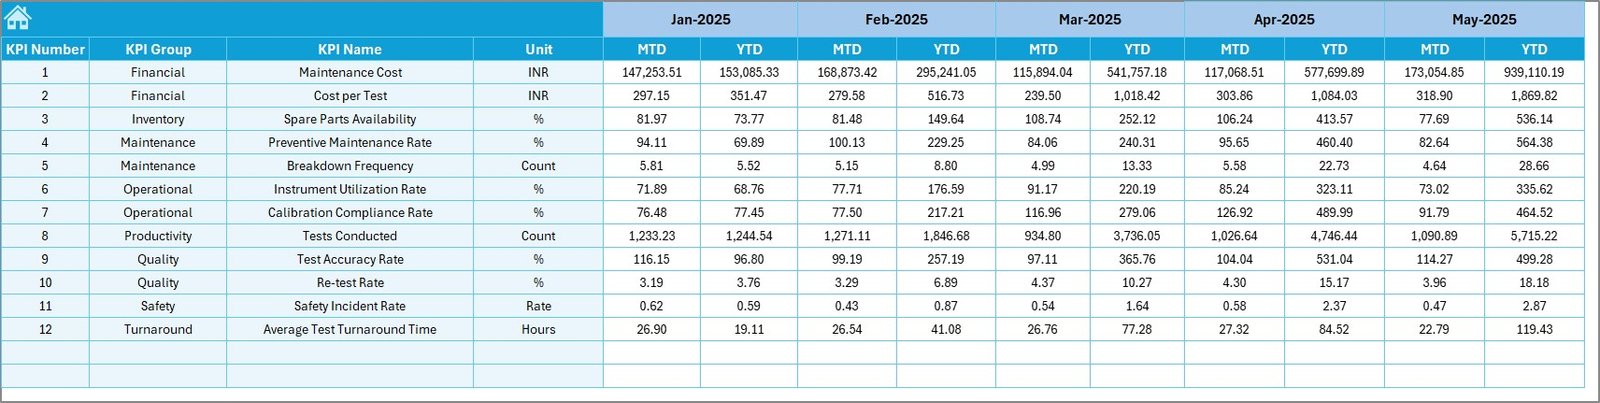
✏️ Actual Numbers Sheet – MTD & YTD data entry
-
🎯 Target Sheet – Monthly & yearly targets
-
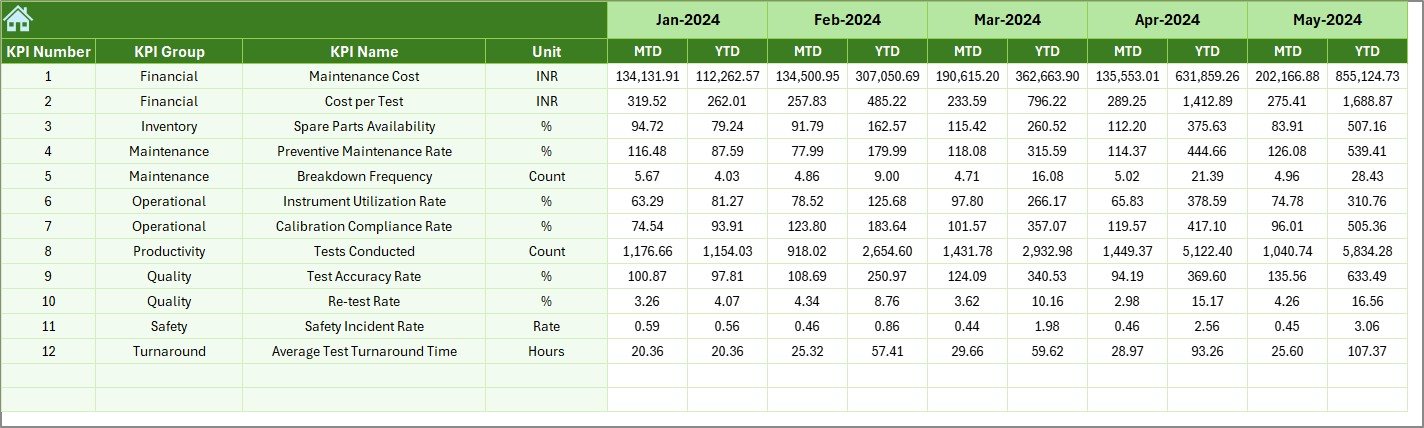
📅 Previous Year Sheet – Historical comparison
-
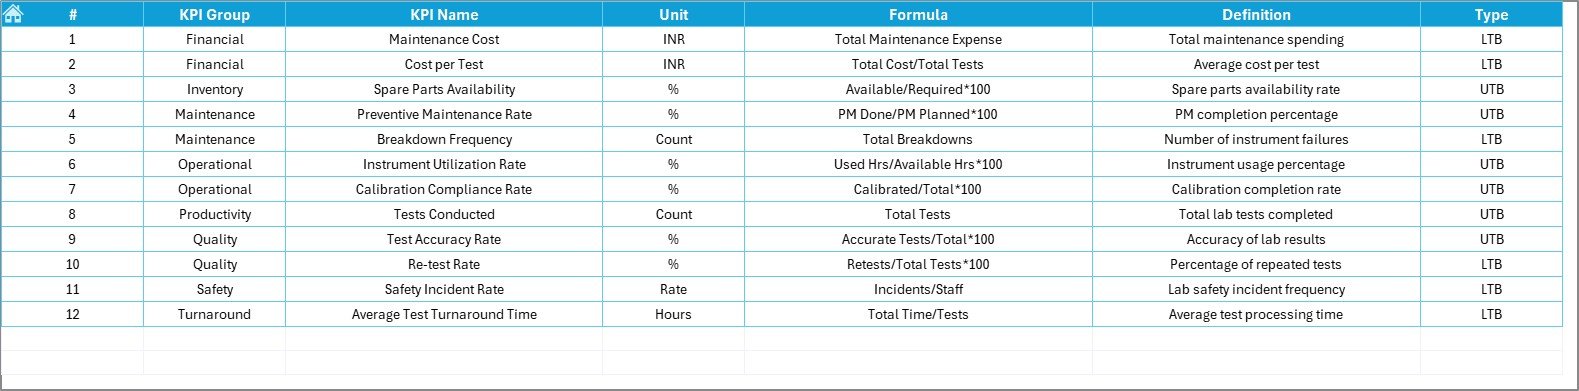
📘 KPI Definition Sheet – KPI logic, unit, formula, and explanation
You can track powerful laboratory KPIs such as:
-
Instrument Utilization Rate (%)
-
Downtime Hours
-
Calibration Compliance Rate
-
Preventive Maintenance Completion
-
Equipment Availability
-
Breakdown Frequency
-
Average Repair Time
-
Cost per Test
-
Error Rate
-
Rework Rate
Everything is structured for clarity and compliance readiness.
🛠 How to Use the Laboratory Instruments KPI Dashboard in Excel
Using this dashboard is simple:
1️⃣ Enter actual monthly performance data in the Actual Numbers Sheet
2️⃣ Define monthly and YTD targets in the Target Sheet
3️⃣ Enter previous year data in the Previous Year Sheet
4️⃣ Select the desired month from the dashboard drop-down
5️⃣ Instantly analyze MTD and YTD performance
The dashboard updates automatically. No complex formulas required from your side.
The visual arrows immediately show whether performance improves or declines.
👥 Who Can Benefit from This Laboratory Instruments KPI Dashboard in Excel
This dashboard is ideal for:
-
Laboratory Managers
-
Quality Control Teams
-
Hospital Diagnostic Centers
-
Pharmaceutical Laboratories
-
Research Institutions
-
Equipment Maintenance Teams
-
Compliance Officers
Whether you manage a small diagnostic lab or a large pharmaceutical facility, this dashboard helps you monitor efficiency, reduce downtime, and improve accountability.
Instead of waiting for breakdown reports, you detect performance risks early and act immediately.
Why This Dashboard Is a Game changer 💡
-
Centralizes all KPI data in one file
-
Eliminates manual calculations
-
Improves compliance tracking
-
Enhances transparency
-
Supports preventive maintenance planning
-
Reduces unexpected downtime
-
Strengthens decision-making
If preventive maintenance completion drops below 90%, you see it instantly and take corrective action before breakdowns occur.
That is proactive laboratory management.
# Click hare to read the Detailed blog post
Visit our YouTube channel to learn step-by-step video tutorials:
👉 YouTube.com/@PKAnExcelExpert


