Communication isn’t “soft work” anymore — it’s business performance.
If your company is running campaigns, sending internal updates, posting on social media, managing PR, and spending budgets… but still tracking everything in scattered sheets, you’re flying blind.
Here’s what happens next:
-
Budgets quietly cross limits
-
Engagement drops and nobody notices
-
Departments overspend without accountability
-
Leadership can’t see what’s working (or wasting money)
That’s exactly why you need the Corporate Communications Dashboard in Excel — a ready-to-use, interactive dashboard designed to track budget allocation, actual cost, engagement rate, and campaign progress across departments, channels, audience types, and months.
This is not a boring report.
This is your communication control room. 📣📊
🚀 Key Feature of Corporate Communications Dashboard in Excel
🧭 Page Navigator (Left Side)
Move between dashboard pages instantly — no scrolling, no confusion.
🎛 Right-Side Slicers for Quick Filtering
Filter by month, department, channel, communication type, and more in seconds.
💰 Budget vs Actual Cost Tracking
Catch overspending early and control cost variance before it becomes a problem.
📈 Engagement Rate Monitoring
See which channels and message categories drive real engagement.
✅ Ongoing Campaign % Visibility
Know how many campaigns are still running vs completed — instantly.
🏢 Department-Wise Comparison
Compare HR vs Marketing vs Corporate Affairs performance without manual work.
📣 Communication Type Performance Insights
Identify which formats (press release, newsletter, internal memo, events) deliver results.
📅 Month-Wise Trend Tracking
Spot seasonal spikes, engagement growth, and budget patterns over time.
🛠 Pivot Table-Based Design
Built with Pivot Tables, Pivot Charts, slicers, and Excel tables — easy to maintain and customize.
📦 What’s Inside the Corporate Communications Dashboard in Excel
This Excel dashboard comes with 5 professional analysis pages:
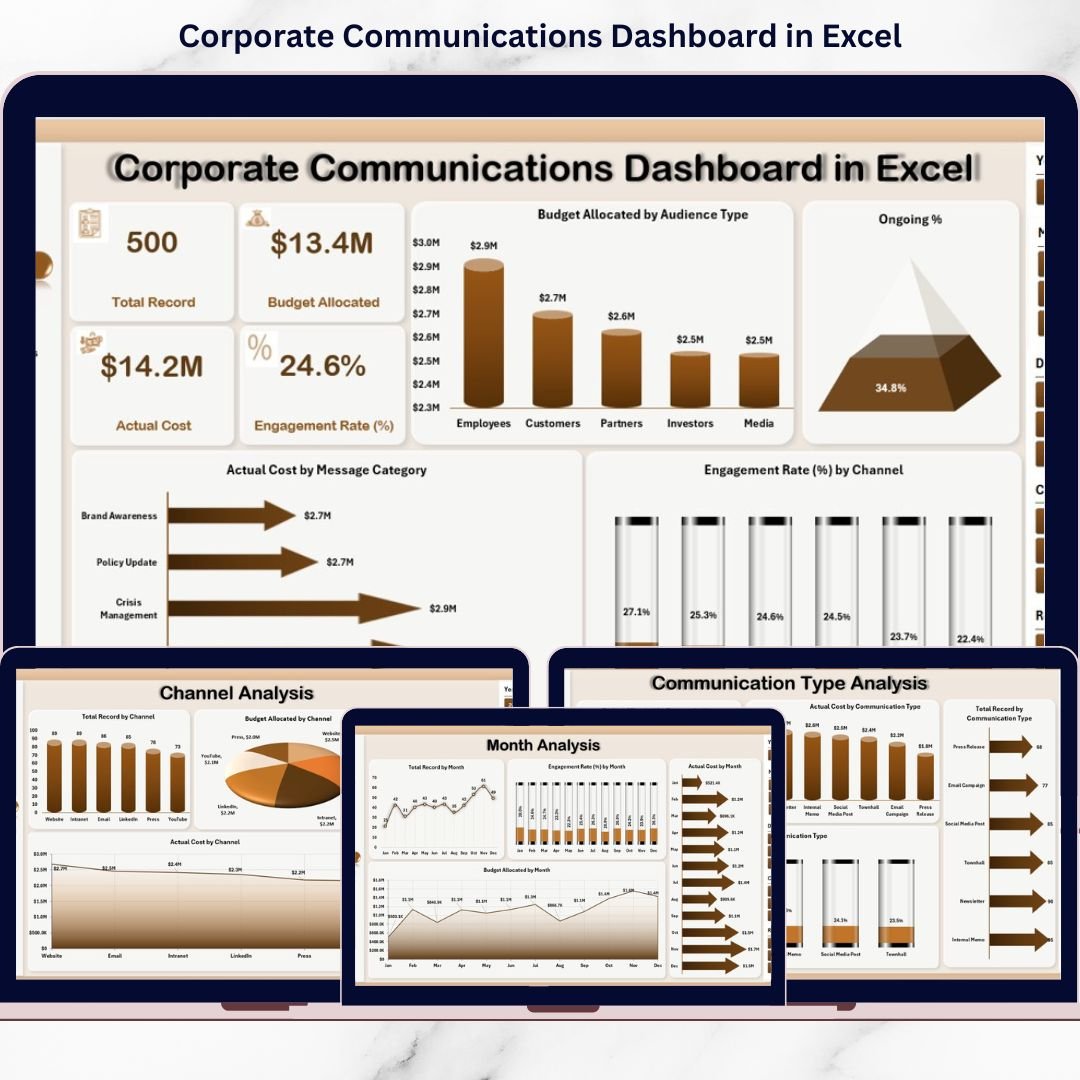
1️⃣ Overview Page
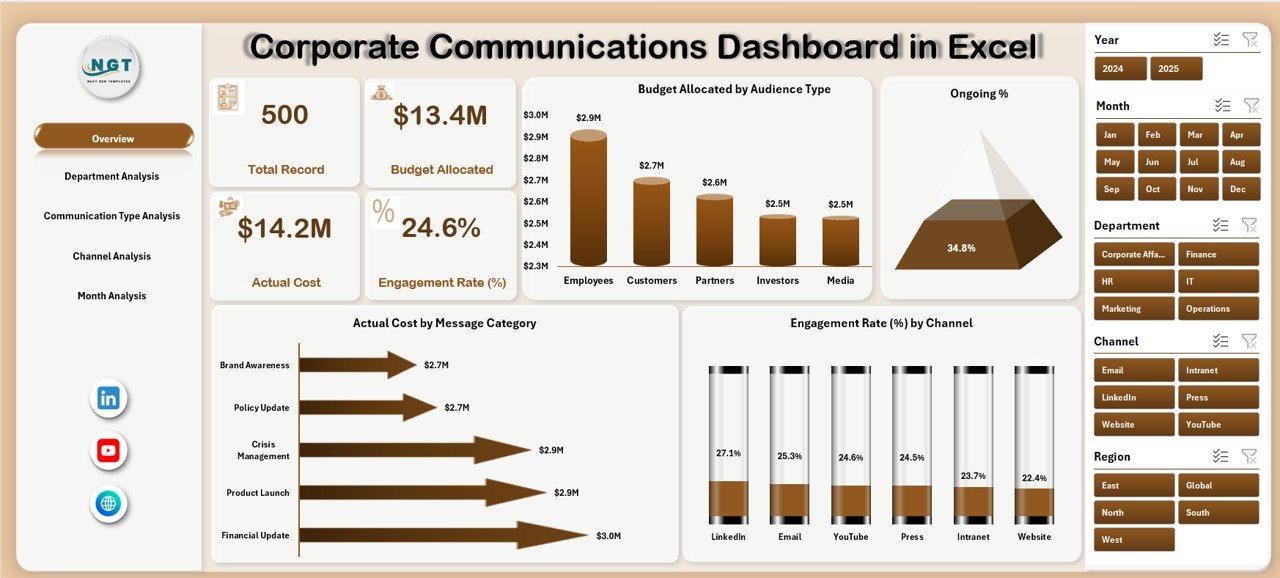
-
4 KPI cards: Total Budget, Actual Cost, Engagement Rate, Ongoing %
-
4 charts: Budget by Audience Type, Ongoing %, Actual Cost by Message Category, Engagement by Channel
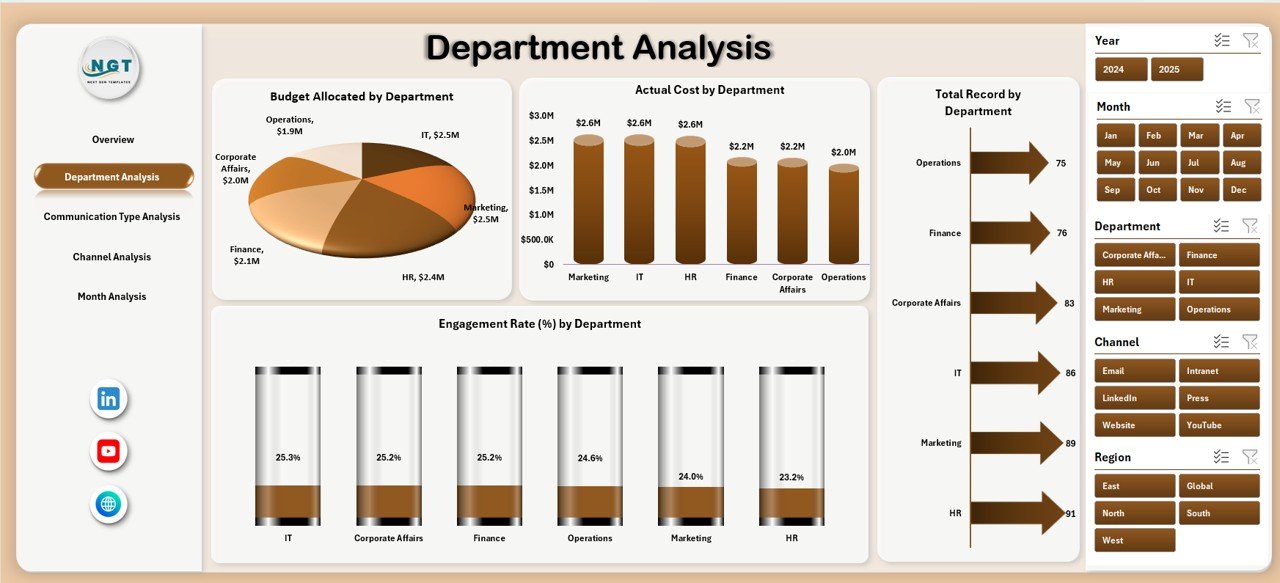
2️⃣ Department Analysis
-
Budget by Department
-
Actual Cost by Department
-
Engagement Rate by Department
-
Total Records by Department
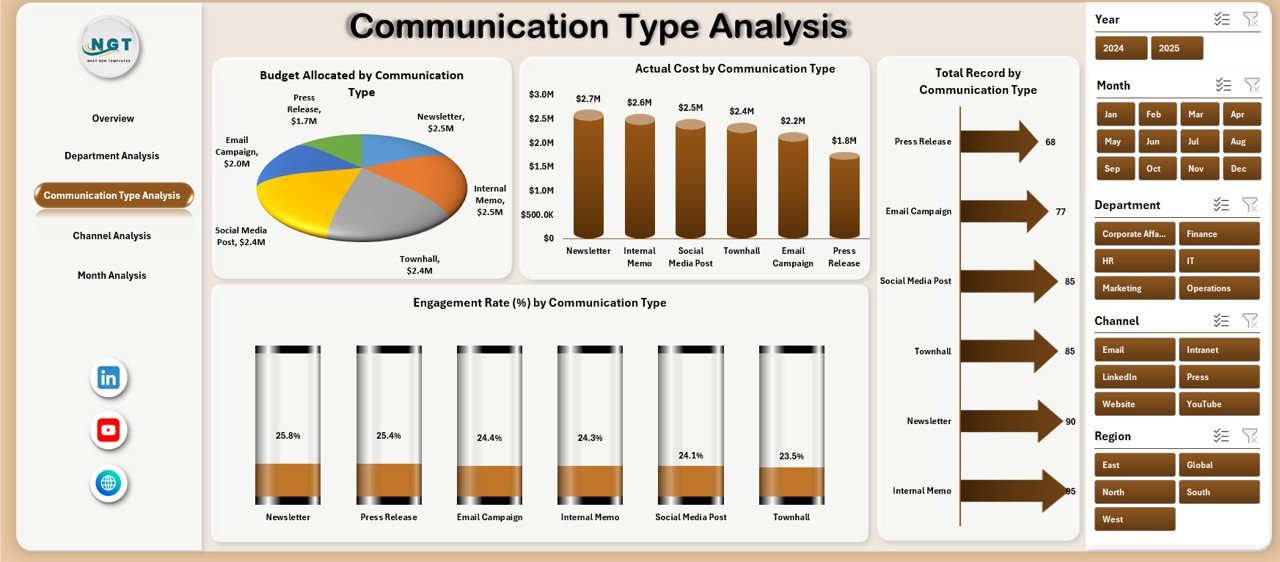
3️⃣ Communication Type Analysis
-
Budget by Communication Type
-
Actual Cost by Type
-
Engagement Rate by Type
-
Total Records by Type
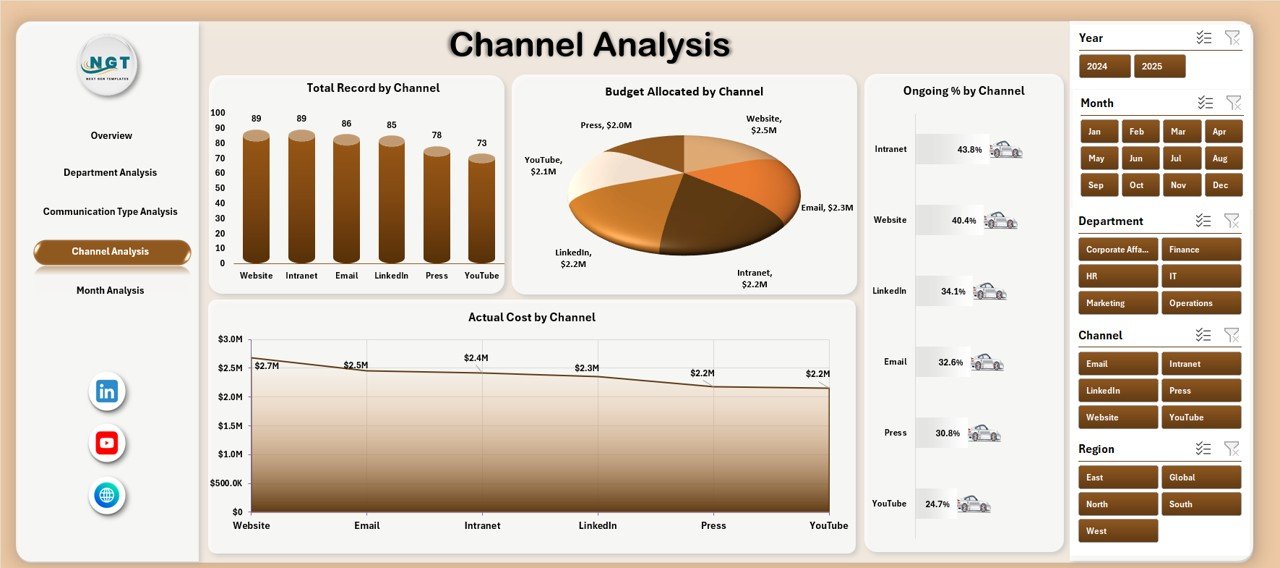
4️⃣ Channel Analysis
-
Budget by Channel
-
Actual Cost by Channel
-
Ongoing % by Channel
-
Total Records by Channel
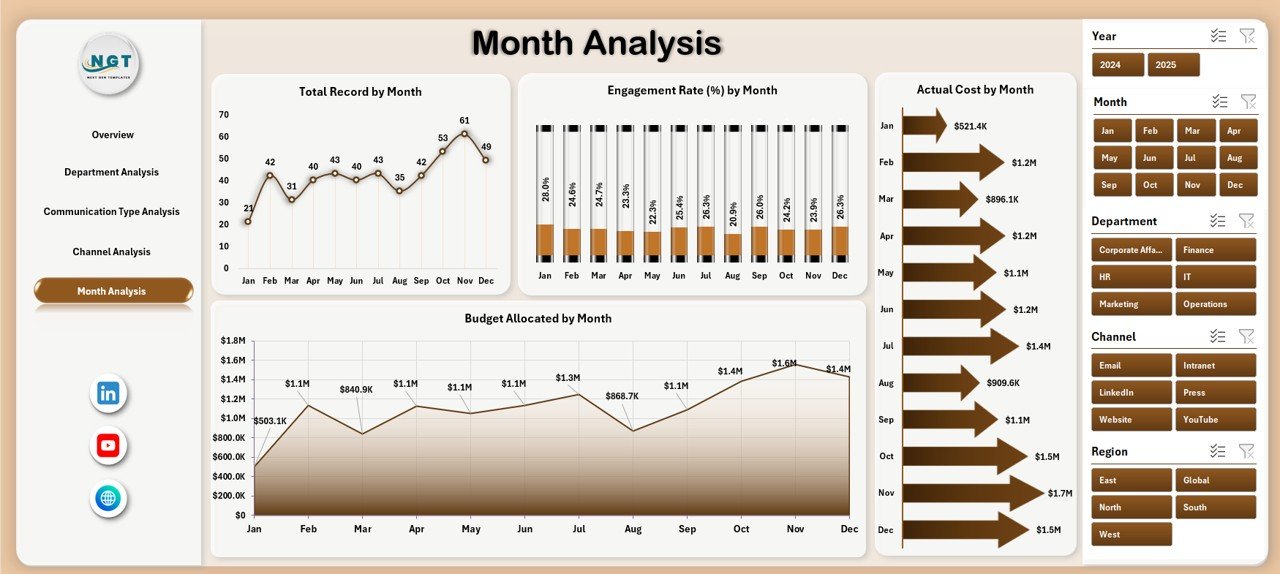
5️⃣ Month Analysis
-
Budget by Month
-
Actual Cost by Month
-
Engagement % by Month
-
Total Records by Month
📌 Recommended Data Columns Included in the Model
Date, Month, Department, Communication Type, Channel, Audience Type, Budget Allocation, Actual Cost, Engagement Rate %, Campaign Status, Message Category.
🛠 How to Use the Corporate Communications Dashboard in Excel
Using this dashboard is simple (even if you’re not an Excel pro):
1️⃣ Update your communication data in the structured Data Sheet
2️⃣ Keep budgets and actual costs updated regularly
3️⃣ Refresh Pivot Tables (one click)
4️⃣ Use slicers to filter by month, department, channel, type, or audience
5️⃣ Read KPI cards + charts to identify overspenders and top performers
6️⃣ Take action — reallocate budgets, improve content, and repeat winning campaigns
No coding. No complex BI setup. Just Excel power. ⚡
👥 Who Can Benefit from This Corporate Communications Dashboard in Excel
This dashboard is perfect for:
📣 Corporate Communications Teams – Track campaigns, engagement, and performance.
📊 Marketing Teams – Compare channels and optimize budget spend.
🏢 HR Communication Teams – Improve employee engagement and internal comms clarity.
📰 PR & Corporate Affairs Managers – Monitor message effectiveness and spending.
💼 Leadership Teams – Get instant visibility into performance and ROI.
🏭 Small Businesses to Enterprises – Works for any organization using Excel.
If your team communicates and spends money doing it — you need this. ✅
Why This Dashboard Helps You Win (Fast)
With this dashboard, you can instantly answer questions like:
-
Which department is overspending this month?
-
Which channel has the highest engagement rate?
-
Are we spending more but getting less engagement?
-
Which communication type is actually working?
-
Are we improving month over month — or slipping?
When you can see the truth in 5 seconds, you can act in 5 minutes. That’s the advantage. 🚀
Click here to read the Detailed blog post
Visit our YouTube channel to learn step-by-step video tutorials
YouTube Channel


