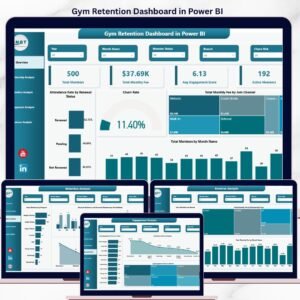
Are you still tracking event attendance in scattered Excel sheets? Stop guessing and start analyzing! The Office Event Attendance Dashboard in Power BI is your all-in-one solution to monitor employee participation, measure engagement, and optimize workplace events with powerful visual insights.
From training programs and town halls to workshops, onboarding sessions, and virtual meetings — this ready-to-use dashboard transforms raw attendance data into meaningful intelligence. Instead of wasting hours compiling reports, you can instantly see who attended, who didn’t, and what’s working best.
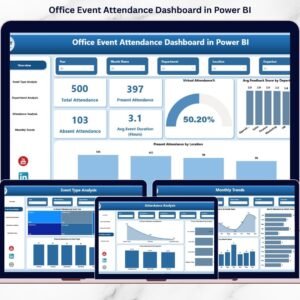
This interactive Power BI dashboard empowers HR teams, event planners, and leadership with real-time performance visibility.
🚀 Key Features of Office Event Attendance Dashboard in Power BI
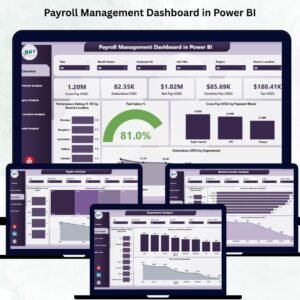
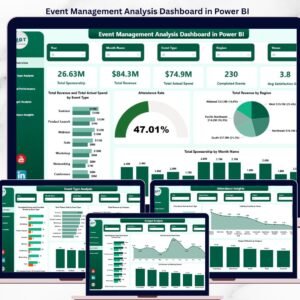
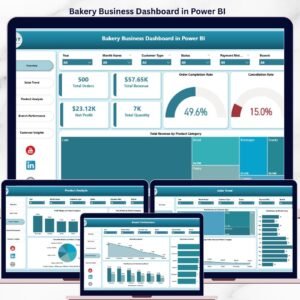
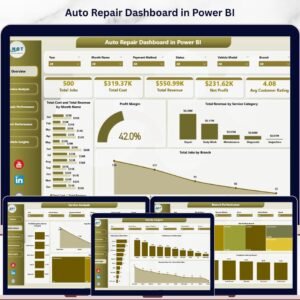
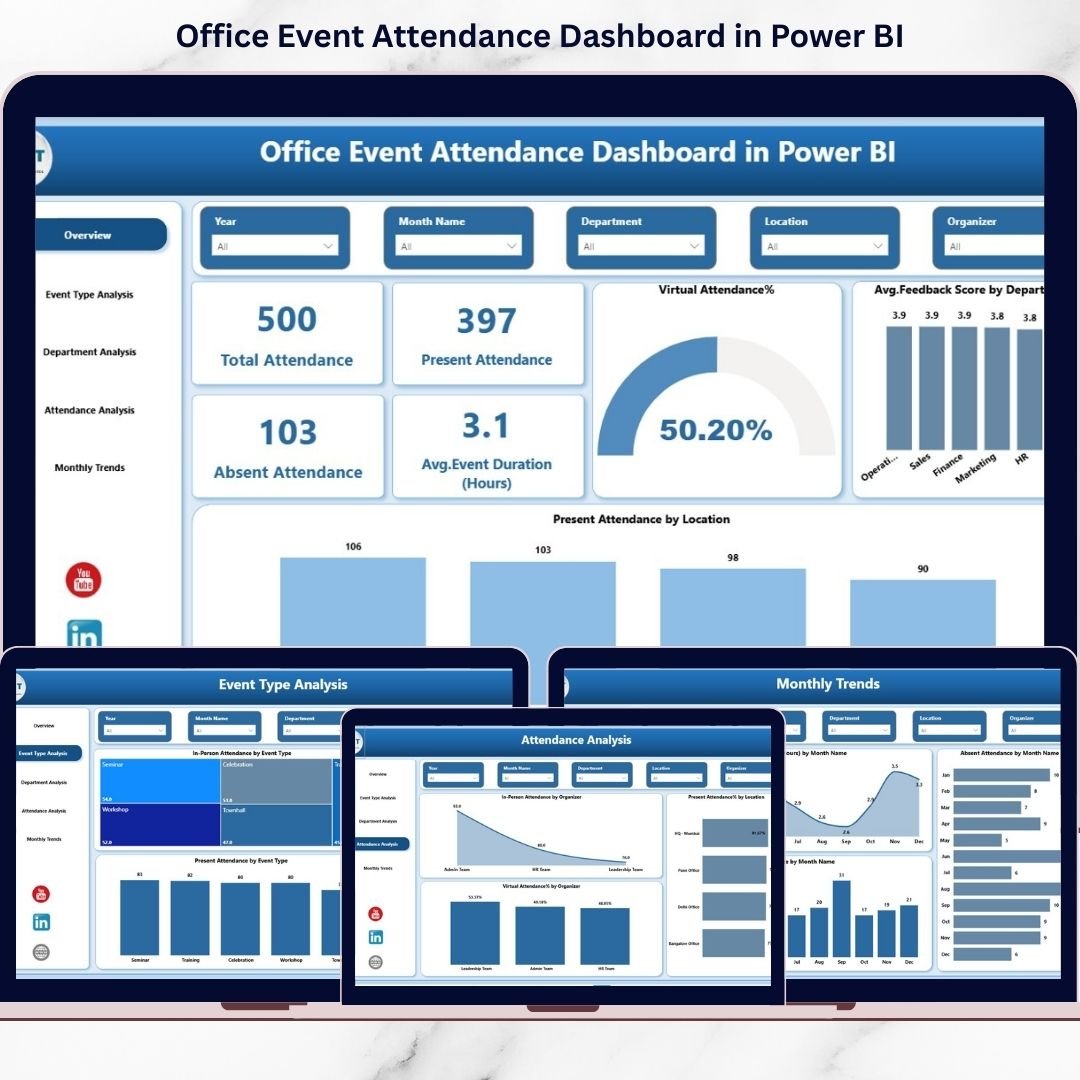
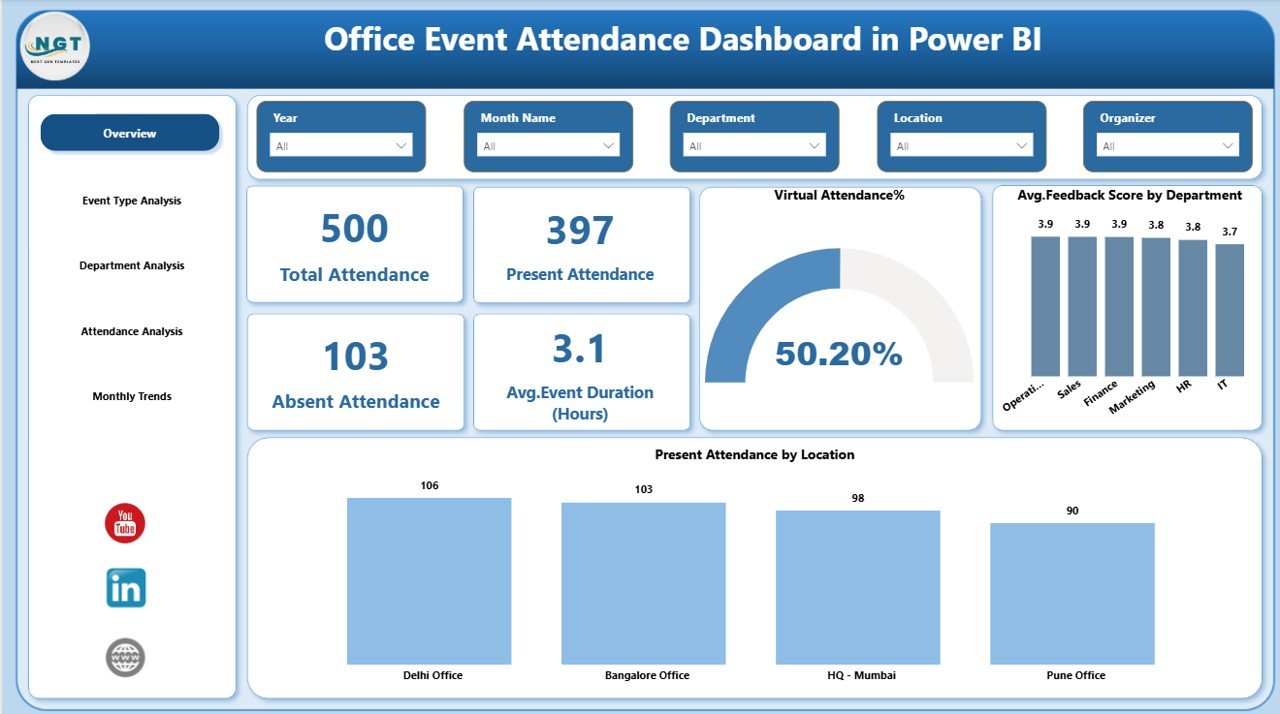
📊 Interactive KPI Cards – Instantly view Total Attendance, Present Attendance, Absent Attendance, and Average Event Duration.
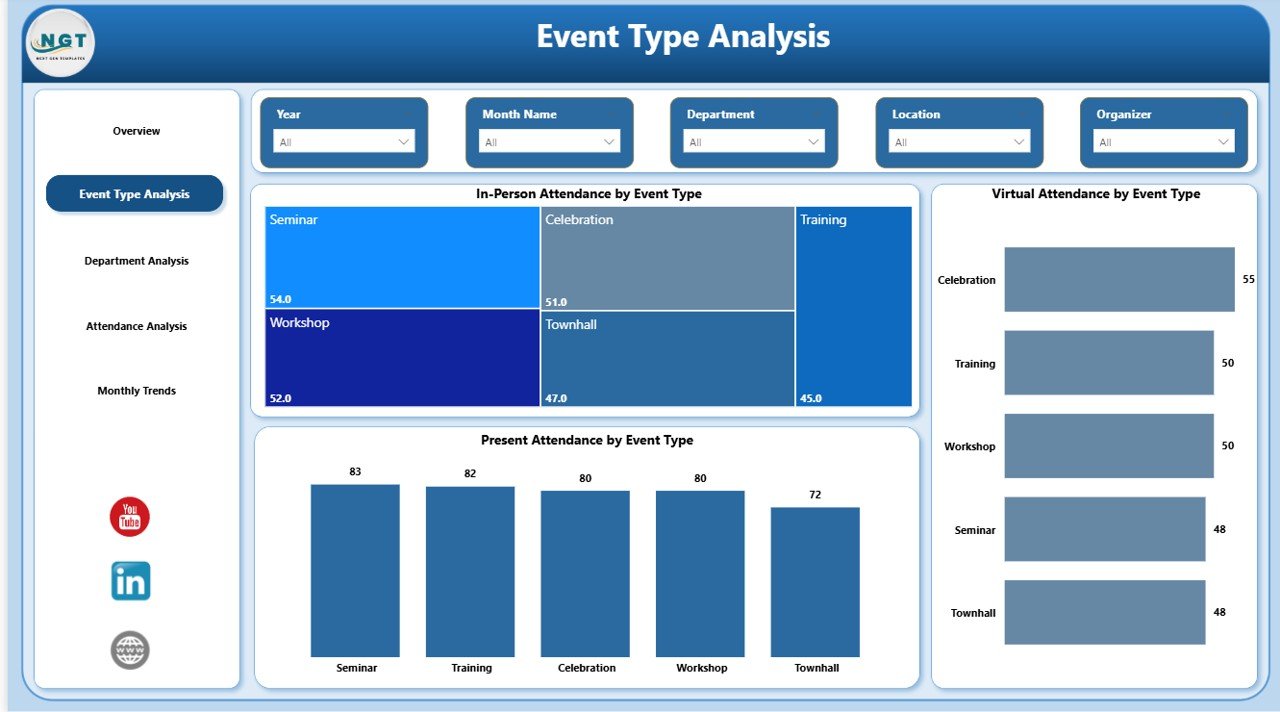
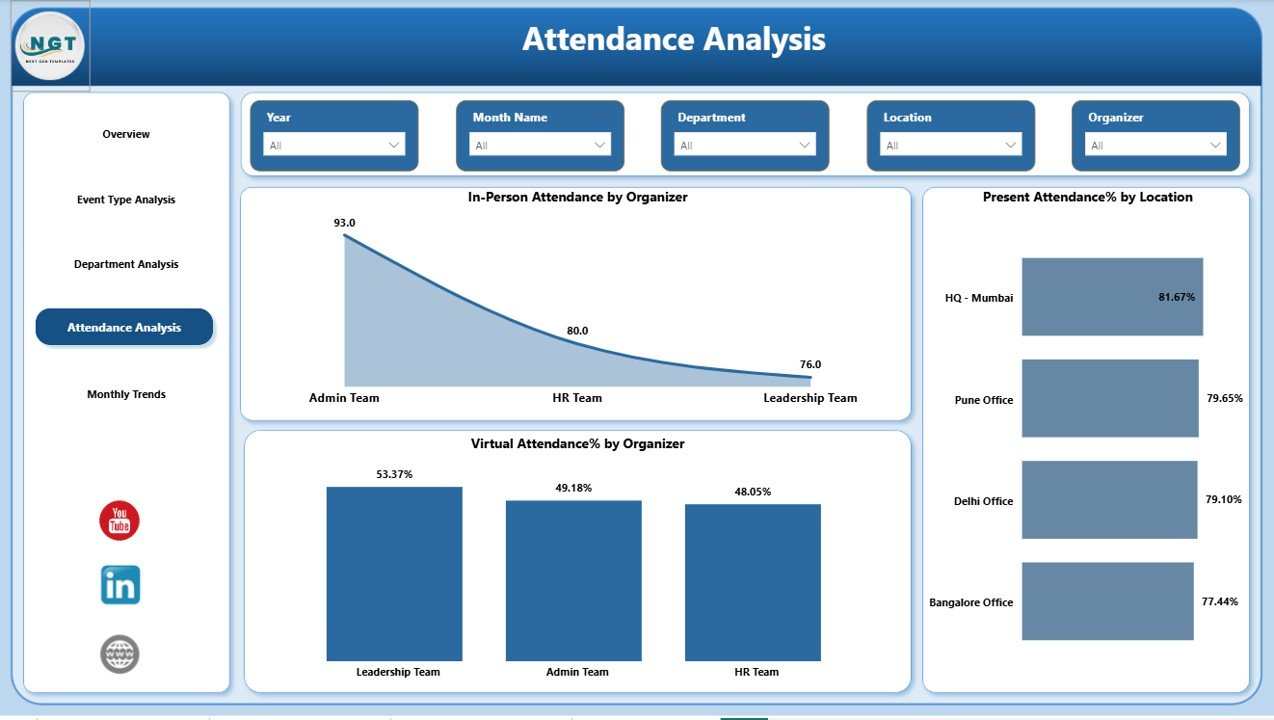
🎯 Event Type Analysis – Compare in-person vs virtual attendance by event category.
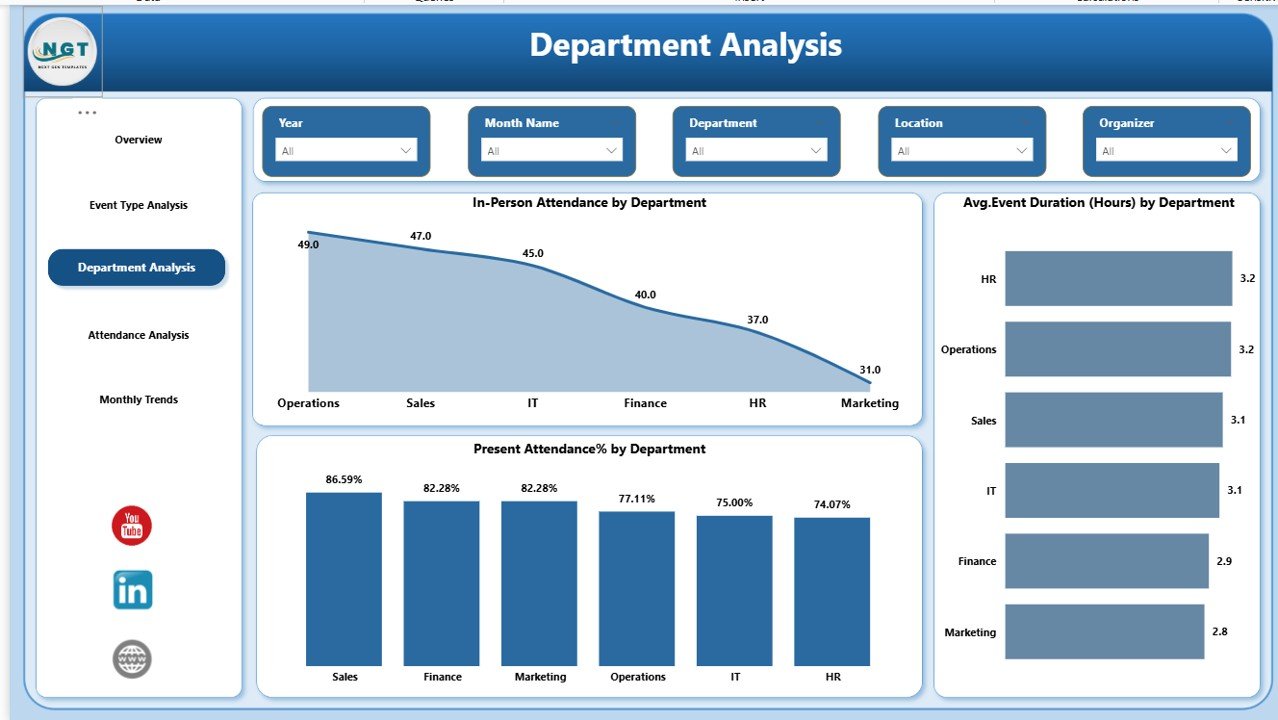
🏢 Department Participation Insights – Identify high and low engagement departments.
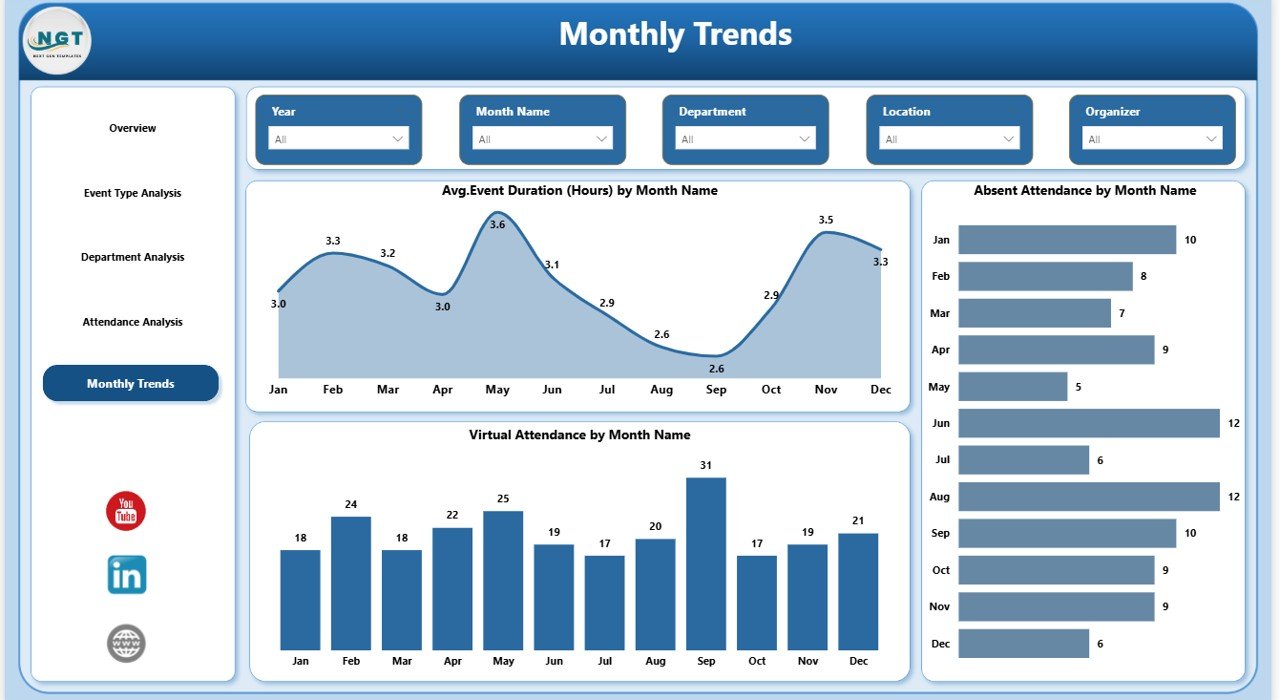
📅 Monthly Trend Monitoring – Track attendance performance and seasonality patterns.
👥 Organizer Performance Tracking – Discover which organizers drive maximum participation.
🌍 Location-Based Analysis – Compare attendance % by office location.
🔎 Advanced Slicers & Filters – Filter data by Event Type, Department, Organizer, Location, or Month in seconds.
⚡ Real-Time Insights – No more manual calculations or outdated spreadsheets.
This dashboard doesn’t just display numbers — it delivers clarity.
📦 What’s Inside the Office Event Attendance Dashboard in Power BI
When you download this digital product, you receive:
✔️ A fully interactive Power BI (.pbix) file
✔️ 5 professionally designed dashboard pages
✔️ KPI summary cards with dynamic visuals
✔️ Multiple analytical charts (bar charts, trend lines, percentage visuals)
✔️ Pre-built slicers for deep data exploration
✔️ Structured data model for smooth performance
✔️ Ready-to-use layout — no complex setup required
Each page is designed to provide actionable insights:
-
Overview Page – The central summary hub.
-
Event Type Analysis – Performance comparison by event category.
-
Department Analysis – Team-level participation insights.
-
Attendance Analysis – Organizer & location insights.
-
Monthly Trends – Long-term engagement monitoring.
Everything is structured for professional reporting and leadership presentations.
⚙️ How to Use the Office Event Attendance Dashboard in Power BI
Using this dashboard is simple and efficient:
1️⃣ Import your attendance data into Power BI.
2️⃣ Ensure event types and department names are properly categorized.
3️⃣ Use slicers to filter by month, department, or event type.
4️⃣ Analyze Present Attendance % and Absent trends.
5️⃣ Identify low-performing areas and plan corrective action.
Within minutes, you can uncover insights that previously took hours to compile.
No advanced technical skills required — just connect your data and explore.
👥 Who Can Benefit from This Office Event Attendance Dashboard in Power BI
This solution is ideal for:
✔️ HR Managers
✔️ Training & Development Teams
✔️ Corporate Event Planners
✔️ Operations Managers
✔️ Employee Engagement Teams
✔️ Corporate Leadership
Mid-sized and large organizations benefit the most, especially those conducting frequent internal events.
If your organization runs multiple events monthly, this dashboard becomes a powerful decision-making tool.
💡 Why This Dashboard Is a Game-Changer
Without structured reporting:
You rely on manual tracking
You waste time consolidating data
You miss engagement trends
You struggle to justify event budgets
With this Power BI dashboard:
✅ You gain real-time visibility
✅ You improve employee engagement
✅ You make data-driven HR decisions
✅ You optimize event duration and format
✅ You compare departments, organizers, and locations
Stop reacting. Start analyzing.
🏁 Transform Workplace Engagement Today
Events shape workplace culture — but only when you measure participation properly. The Office Event Attendance Dashboard in Power BI helps you track engagement, improve planning, and support leadership decisions with confidence.
If you want better participation, smarter event planning, and professional reporting — this is the solution your organization needs.
Click hare to read the Detailed blog post
Watch the step-by-step video tutorial: