Are your employees overloaded while others sit underutilized? Are deadlines slipping because you cannot clearly see task distribution? It is time to stop guessing and start managing with data.
The Employee Workload Dashboard in Power BI is a ready-to-use, interactive business intelligence solution designed to help managers monitor task allocation, estimated hours, completion rates, and department performance — all in one powerful system.
Instead of juggling scattered spreadsheets and manual reports, this dashboard gives you instant clarity. You can identify overloaded employees, detect delays, balance departments, and track monthly workload trends with just a few clicks.
If you want better productivity, smarter planning, and burnout prevention — this dashboard is your ultimate solution.
Key Features of Employee Workload Dashboard in Power BI
Interactive 5-Page Analytical Dashboard
Dynamic Slicers (Employee, Department, Role, Category, Month)
Real-Time KPI Tracking
Workload Balance Visualization
Department & Category Performance Analysis
Monthly Workload Trend Monitoring
Drill-Through Insights for Deeper Analysis
Easy Data Refresh & Customizable KPIs
Each page is strategically designed to give decision-makers actionable insights instantly.

📊 What’s Inside the Employee Workload Dashboard?
This dashboard includes 5 powerful analytical pages:
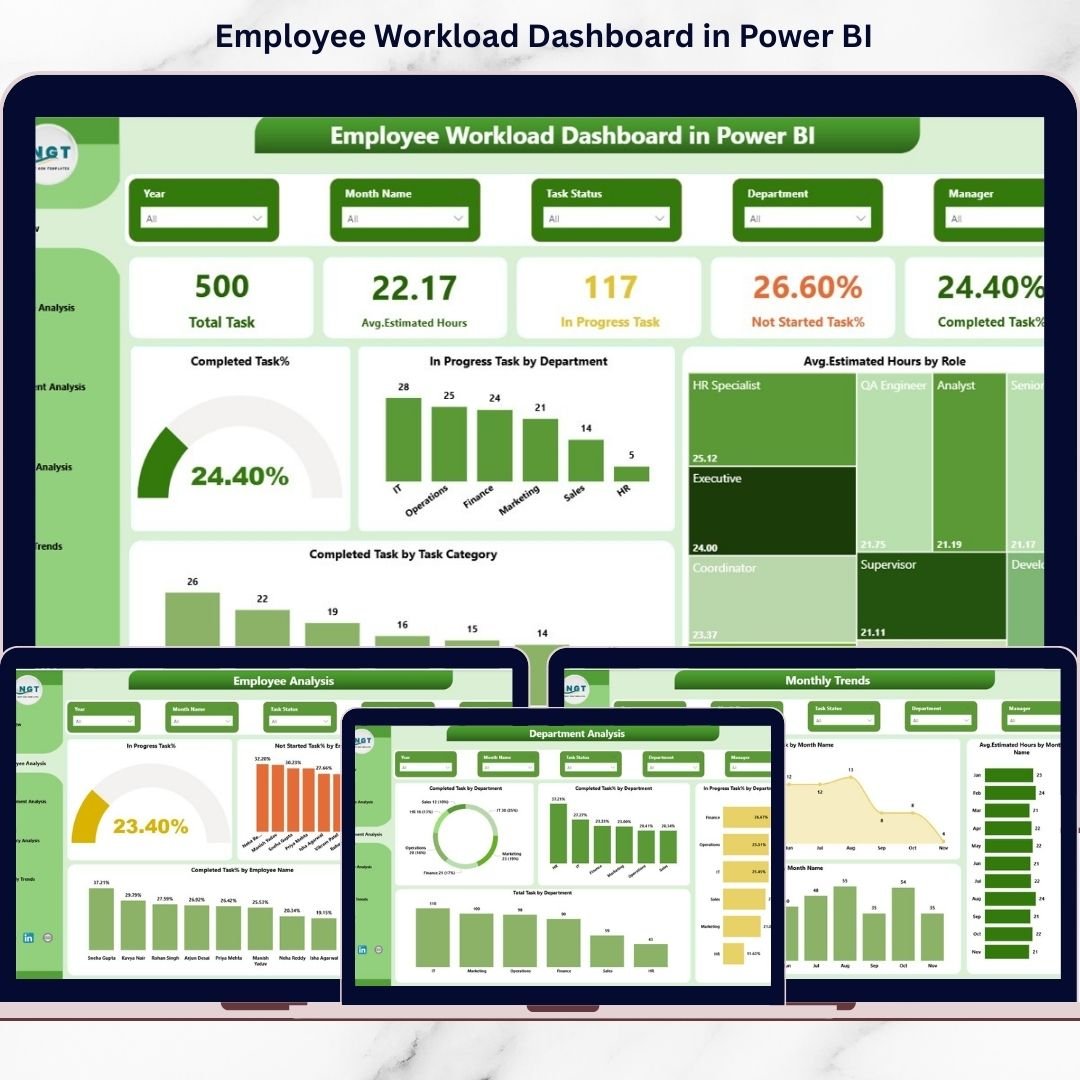
1️⃣ Overview Page
Your command center. Instantly see:
-
Total Tasks
-
Average Estimated Task Hours
-
In Progress Tasks by Department
-
Average Estimated Hours by Role
-
Completed Tasks by Category
With slicers, you can filter data by employee, department, role, category, or month to uncover hidden patterns.
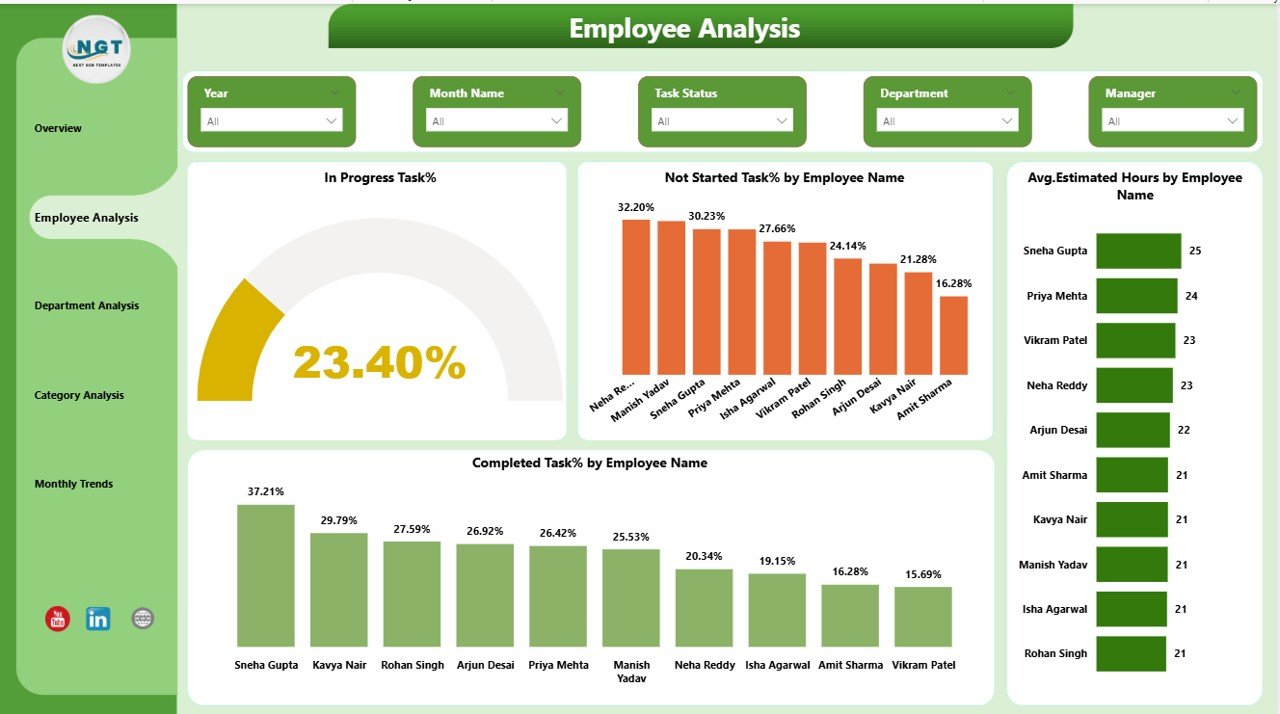
2️⃣ Employee Analysis Page
Analyze individual workload with:
-
In Progress % by Employee
-
Not Started % by Employee
-
Average Estimated Hours
-
Completion %
Identify overloaded employees and redistribute tasks efficiently.
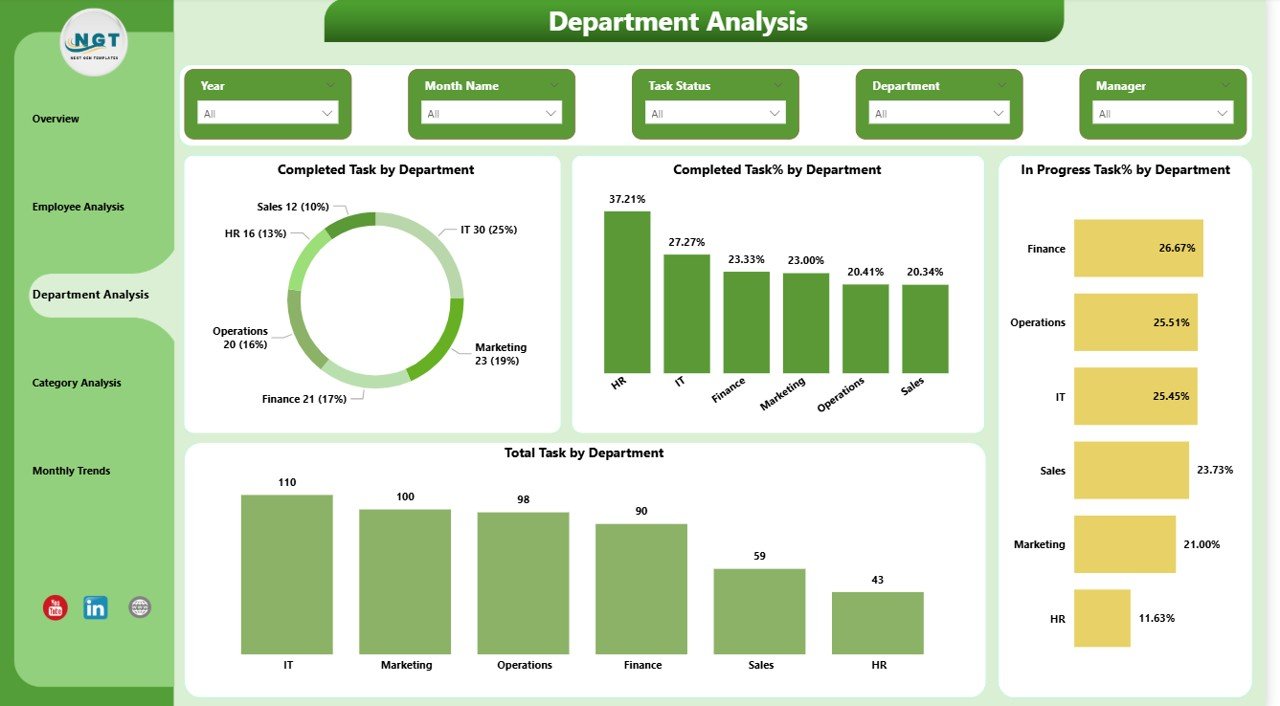
3️⃣ Department Analysis Page
Compare departments with:
-
Total Tasks by Department
-
Completed %
-
In Progress %
-
Overall Task Distribution
Balance cross-functional workload and eliminate bottlenecks.
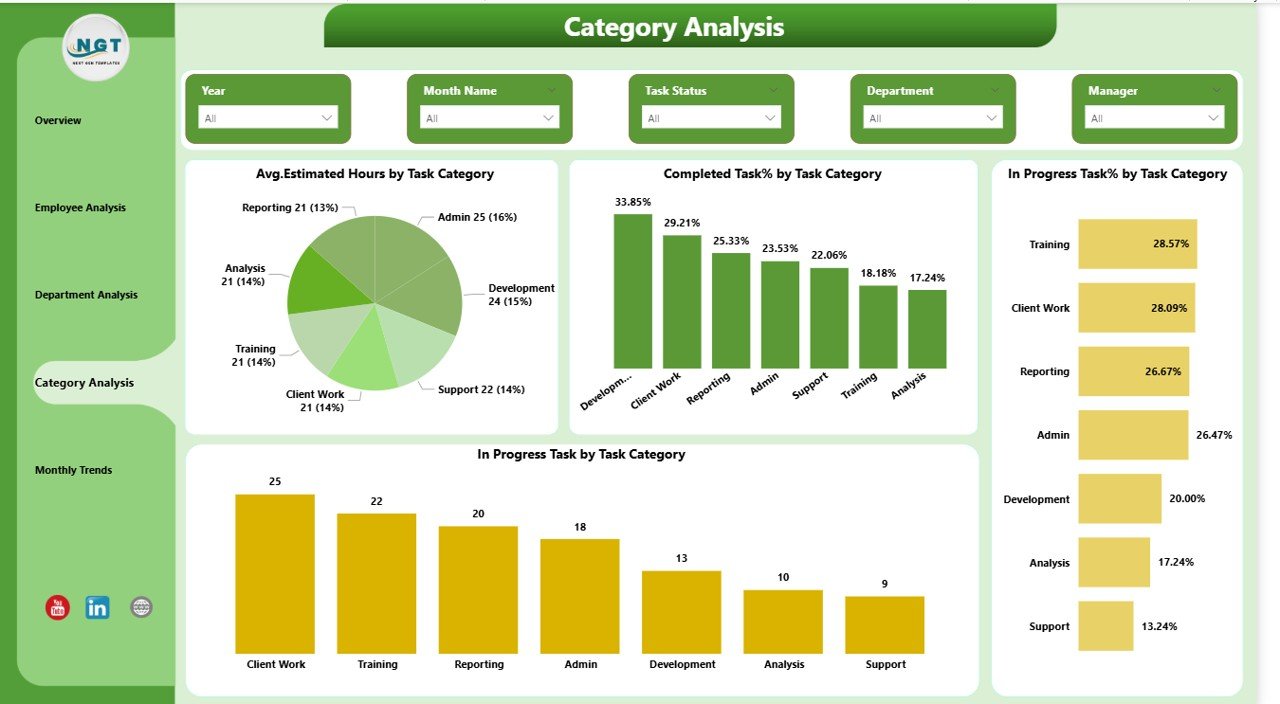
4️⃣ Category Analysis Page
Understand which task types consume more time:
-
Average Estimated Hours by Category
-
Completion % by Category
-
Delay Indicators
Improve task planning and resource allocation.
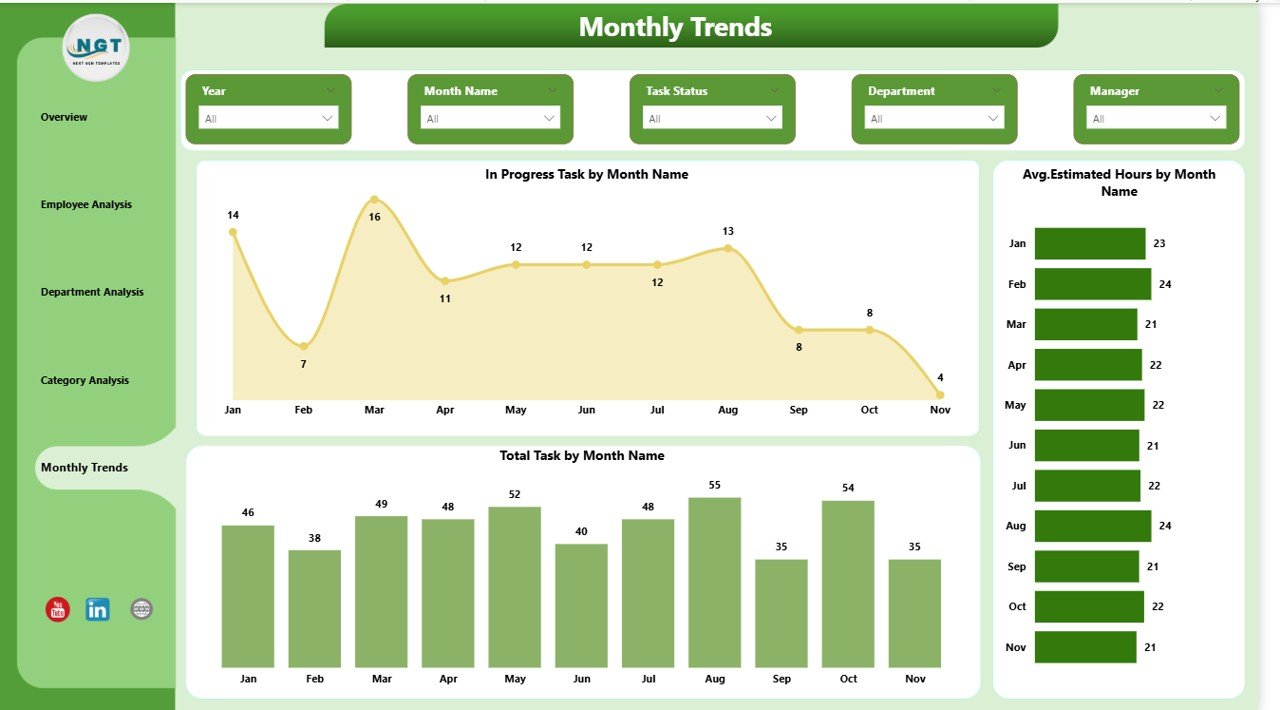
5️⃣ Monthly Trends Page
Track workload fluctuations:
-
Total Tasks by Month
-
In Progress Tasks by Month
-
Average Estimated Hours by Month
Predict future workload spikes and plan staffing accordingly.
🛠️ How to Use the Employee Workload Dashboard
Using this dashboard is simple:
1️⃣ Connect your task dataset (Employee Name, Department, Role, Task Category, Status, Estimated Hours, Date).
2️⃣ Refresh the Power BI file.
3️⃣ Use slicers to filter by employee, department, or month.
4️⃣ Analyze KPIs and workload patterns.
5️⃣ Take proactive action based on insights.
Within minutes, you move from confusion to clarity.
👥 Who Can Benefit from This Employee Workload Dashboard?
This dashboard is perfect for:
-
👨💼 HR Managers – Monitor workload balance and prevent burnout
-
📋 Project Managers – Allocate tasks effectively
-
🏢 Department Heads – Track team performance
-
📊 Business Analysts – Generate productivity insights
-
🚀 Growing Startups – Maintain structured task tracking
-
🏭 Enterprises – Improve workforce efficiency
Whether you manage 10 employees or 1,000, this dashboard scales effortlessly.
This dashboard does more than track tasks. It improves transparency. It enhances accountability. It supports fair task distribution. It reduces reporting time. It empowers data-driven decisions.
Stop relying on assumptions. Start managing with confidence.
Click here to read the Detailed blog post
Watch the step-by-step video tutorial: