Are you still managing heritage tourism performance using scattered spreadsheets and manual reports? It’s time to upgrade your decision-making with a smarter, faster, and fully interactive solution 🚀
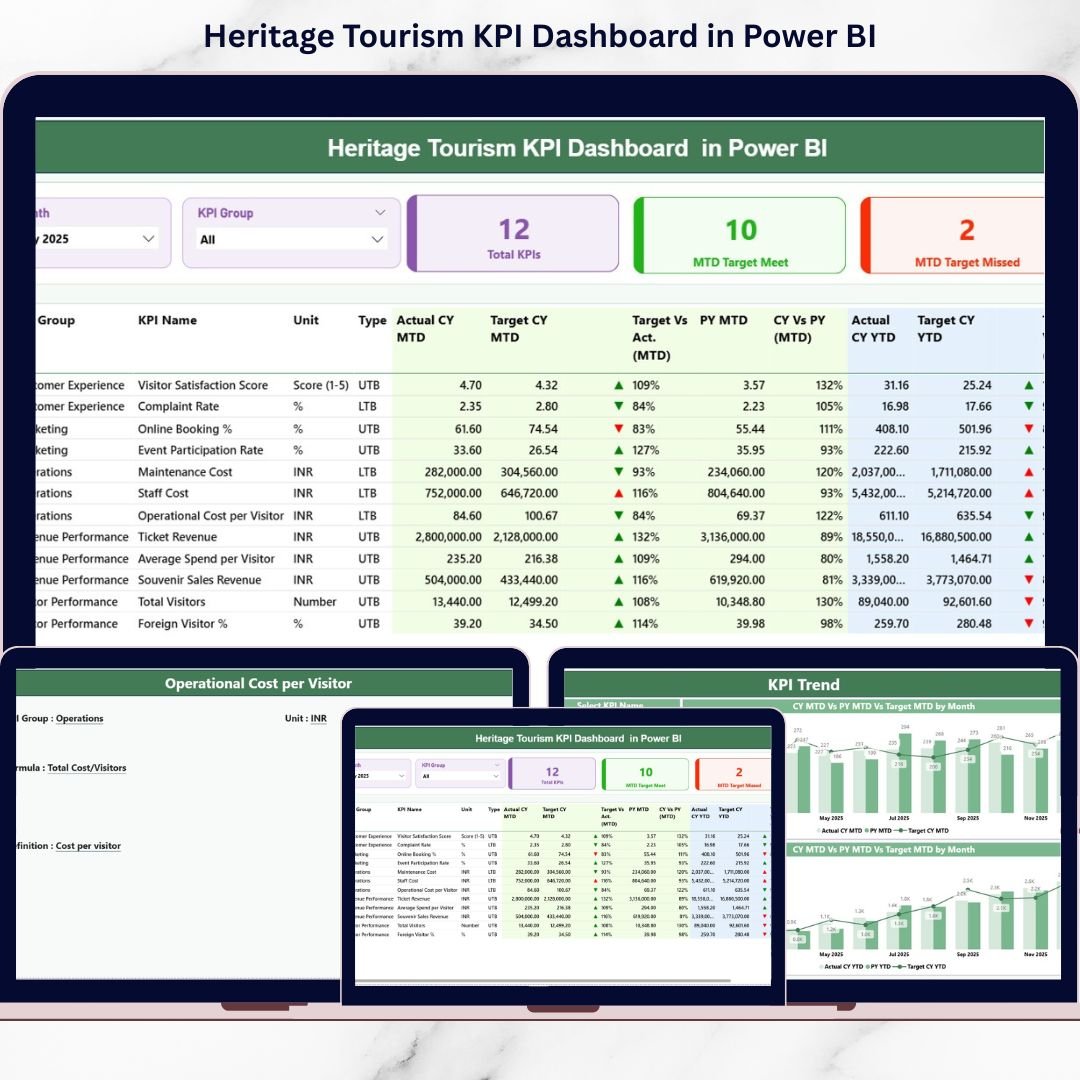
The Heritage Tourism KPI Dashboard in Power BI is a professionally designed performance monitoring system built specifically for tourism boards, cultural departments, museums, heritage sites, and government authorities. It transforms complex tourism data into clear, visual insights so you can track growth, control budgets, and improve strategic planning effortlessly.
This ready-to-use Power BI dashboard connects seamlessly with Excel, allowing you to update data without modifying the dashboard structure. Simply refresh — and your reports are updated instantly.
Key Features of Heritage Tourism KPI Dashboard in Power BI 📊
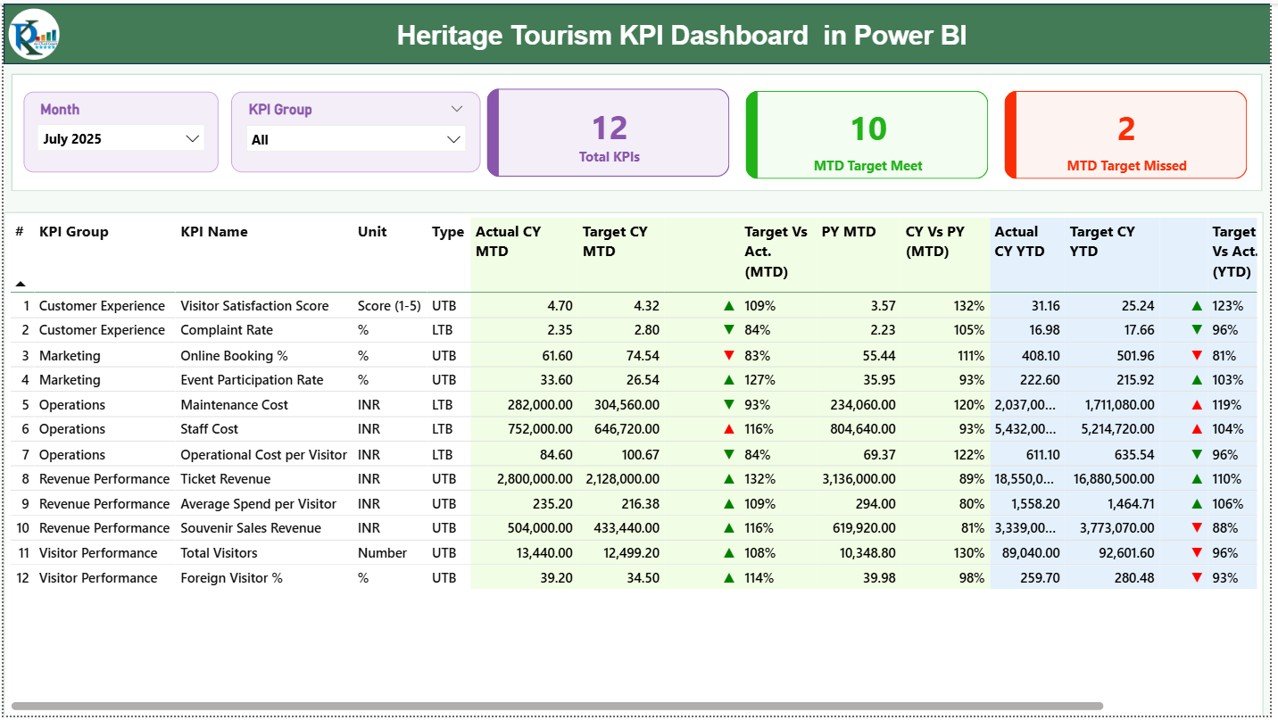
✅ Interactive Summary Page with Month and KPI Group slicers
✅ KPI Cards showing Total KPIs, Target Met, and Target Missed
✅ MTD and YTD performance tracking
✅ Target vs Actual comparison with visual indicators (▲ / ▼)
✅ Year-over-Year (CY vs PY) comparison
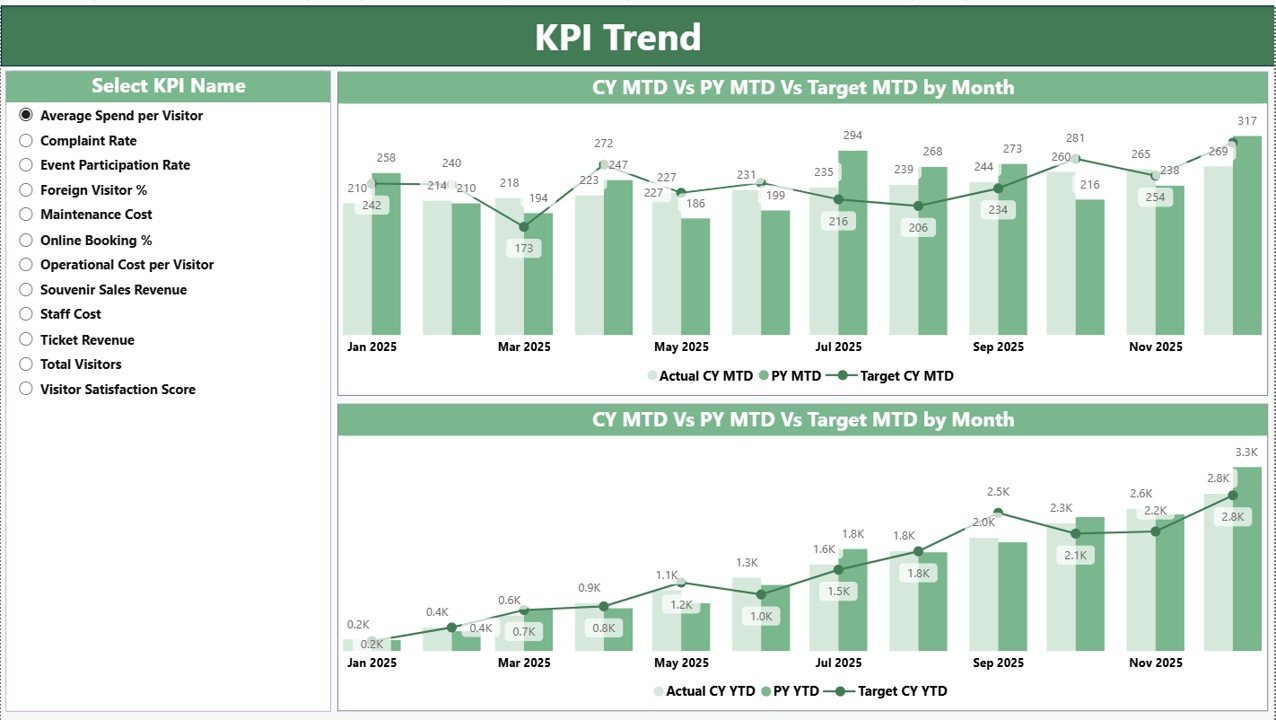
✅ Combo charts for trend analysis
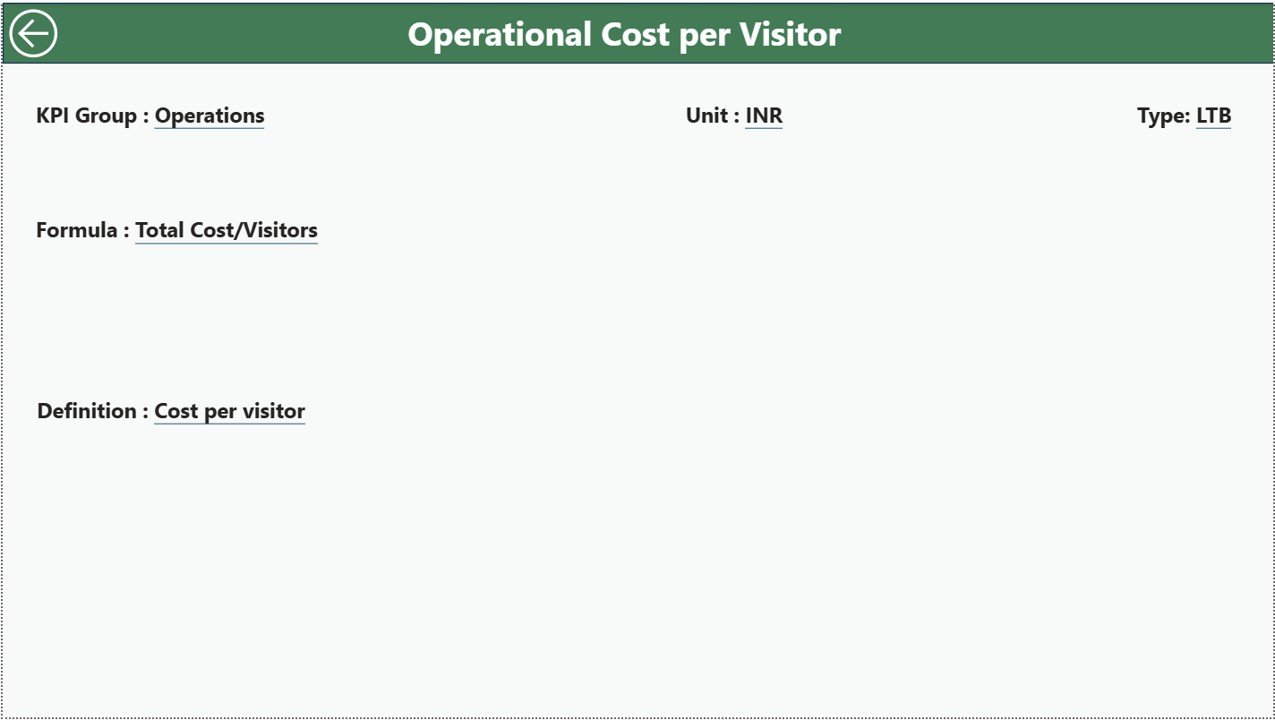
✅ Drill-through KPI Definition page
✅ Excel-connected dynamic data model
The dashboard visually highlights performance using green ▲ for achievements and red ▼ for gaps. This allows management to identify issues in seconds instead of reading long reports.
With MTD (Month-to-Date) and YTD (Year-to-Date) views available simultaneously, you gain both short-term and long-term visibility into tourism performance.
What’s Inside the Heritage Tourism KPI Dashboard in Power BI 📂
This Power BI file contains 3 structured dashboard pages:
🔹 Summary Page – The main control center with KPI cards, slicers, and detailed performance tables.
🔹 KPI Trend Page – Visual combo charts comparing Current Year, Previous Year, and Targets.
🔹 KPI Definition Page – Drill-through page showing KPI formulas, units, types (LTB/UTB), and definitions.
In addition, the connected Excel file includes:
📁 Input Actual Sheet
📁 Input Target Sheet
📁 KPI Definition Sheet
This structure makes the dashboard fully dynamic and scalable. You can easily add new KPIs without redesigning the report.
How to Use the Heritage Tourism KPI Dashboard in Power BI ⚙️
Using this dashboard is simple:
1️⃣ Enter your actual MTD and YTD values in the Input Actual sheet.
2️⃣ Update monthly targets in the Input Target sheet.
3️⃣ Define KPI logic in the KPI Definition sheet.
4️⃣ Open Power BI and refresh the data.
That’s it! Your dashboard updates automatically.
Always use the first date of the month (for example, 01-Jan-2024) to ensure accurate time intelligence calculations.
The slicers allow you to filter by Month and KPI Group instantly, giving you focused insights without complexity.
Who Can Benefit from This Heritage Tourism KPI Dashboard in Power BI 🎯
✔️ Government Tourism Departments
✔️ Heritage Site Authorities
✔️ Cultural Trusts
✔️ Museums & Historical Monuments
✔️ Tourism Boards
✔️ Financial & Planning Teams
If your organization manages visitor counts, ticket revenue, restoration projects, maintenance budgets, or event performance, this dashboard is designed for you.
It supports key heritage KPIs such as:
Visitor Count
International Visitors
Ticket Revenue
Donation Income
Project Completion %
Restoration Budget Variance
Complaint Resolution Time
By tracking these metrics visually, leadership teams make faster and more confident decisions.
This dashboard improves transparency, accountability, and strategic planning. Instead of guessing performance trends, you monitor them in real-time. Instead of complex reports, you get clean, visual insights.
If you want a structured, powerful, and professional solution to manage heritage tourism performance — this dashboard is your competitive advantage.
Click here to read the Detailed blog post
Visit our YouTube channel to learn step-by-step video tutorials:
👉 https://www.youtube.com/@PKAnExcelExpert