Cloud infrastructure is the backbone of modern digital businesses. However, when cloud KPIs are tracked using raw reports or disconnected spreadsheets, costs escalate, performance issues go unnoticed, and optimization becomes reactive.
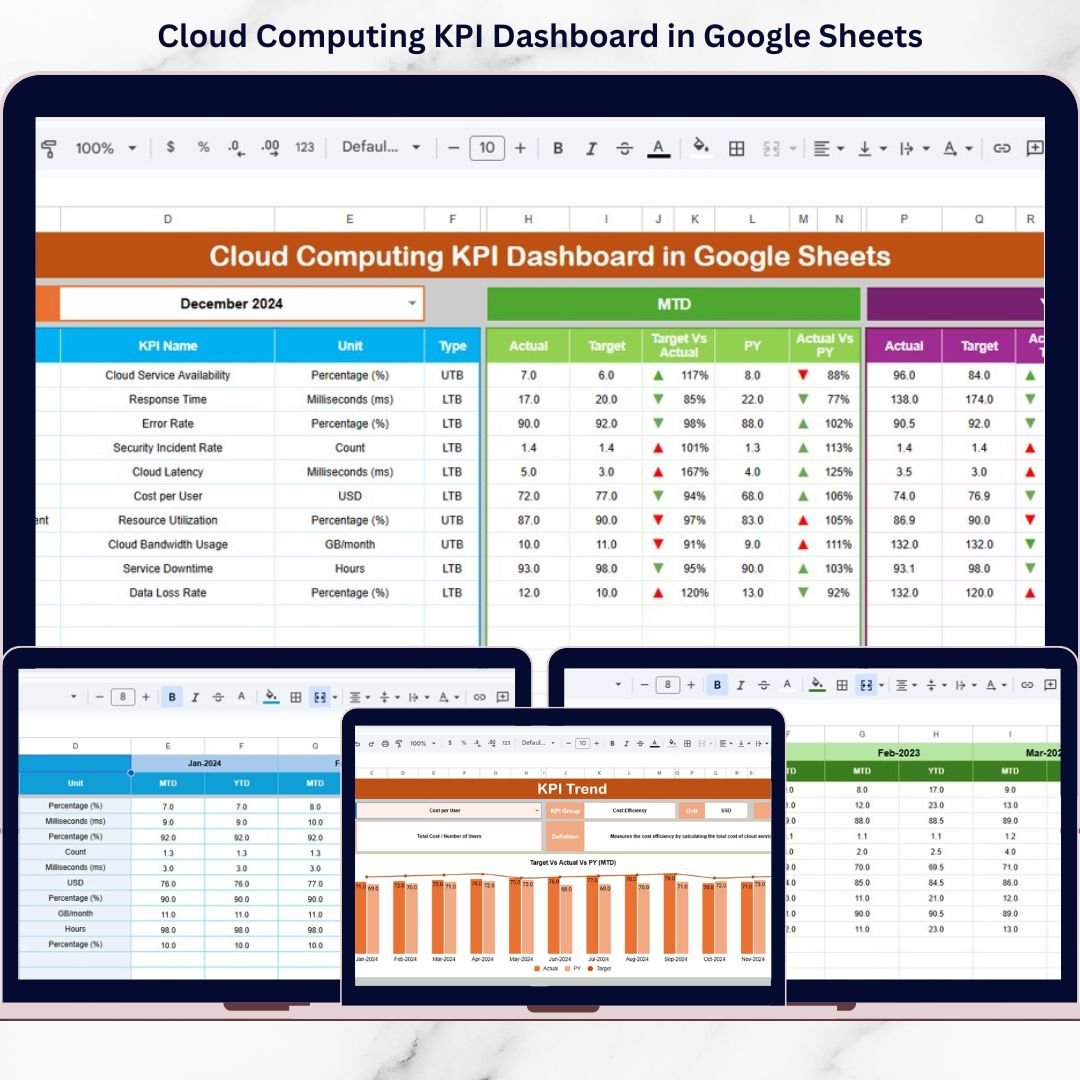
The Cloud Computing KPI Dashboard in Google Sheets is a ready-to-use, professional analytics solution designed to help organizations monitor cloud cost, performance, availability, and reliability KPIs from a single centralized dashboard. Instead of manually comparing reports, teams can instantly track MTD, YTD, Target vs Actual, and Year-over-Year performance using dynamic visuals and structured data.
Built entirely in Google Sheets, this dashboard delivers clarity, control, and collaboration without requiring expensive BI tools.
🚀 Key Features of Cloud Computing KPI Dashboard in Google Sheets
✅ MTD & YTD KPI Tracking for real-time cloud performance monitoring
✅ Target vs Actual Comparison with automatic variance indicators
✅ Previous Year vs Actual Analysis to measure improvement or decline
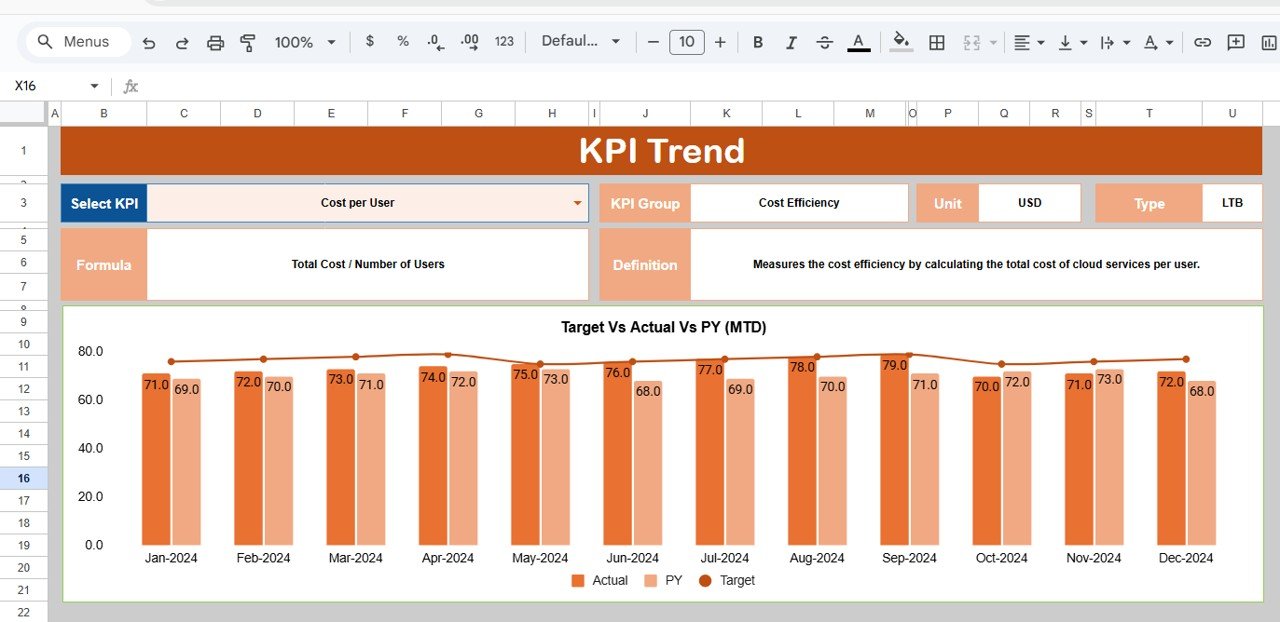
✅ Dynamic KPI Trend Charts for short-term and long-term insights
✅ LTB / UTB KPI Classification for accurate interpretation
✅ Conditional Formatting & Arrows for quick performance signals
✅ Structured KPI Definition Table for consistency and governance
✅ Google Sheets–Based Design for easy sharing and collaboration
📂 What’s Inside the Cloud Computing KPI Dashboard
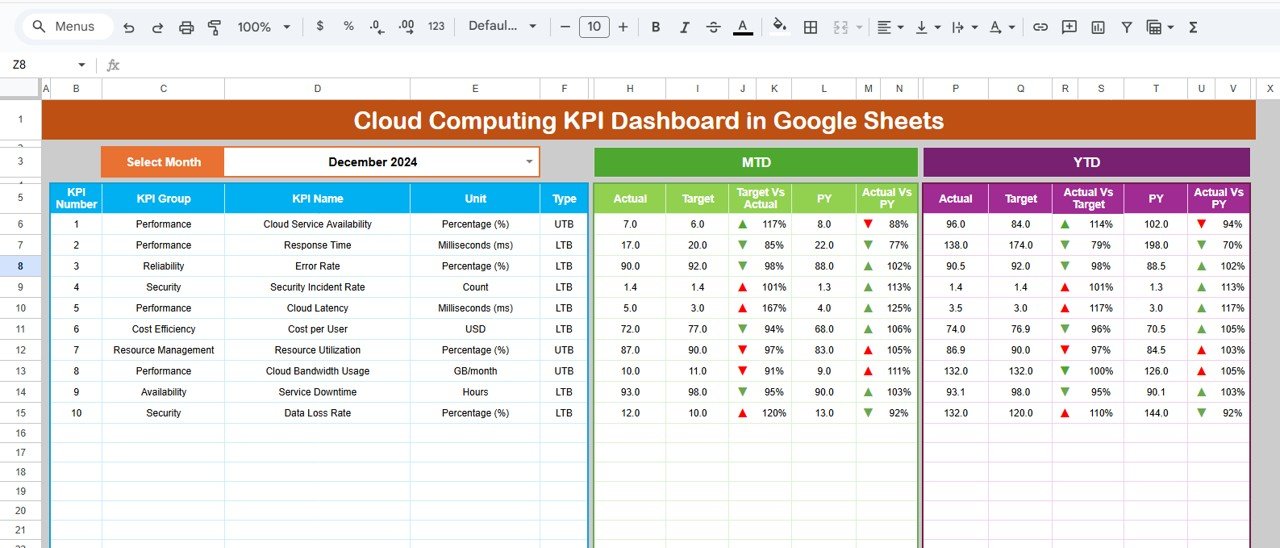
📌 Dashboard Sheet (Main Dashboard)
The control center of the dashboard that updates automatically based on the selected month.
It displays MTD, YTD, Target, Previous Year values, and performance indicators using arrows and color formatting.
📌 KPI Trend Sheet
Analyze individual KPIs with MTD and YTD trend charts showing Actual, Target, and Previous Year performance.
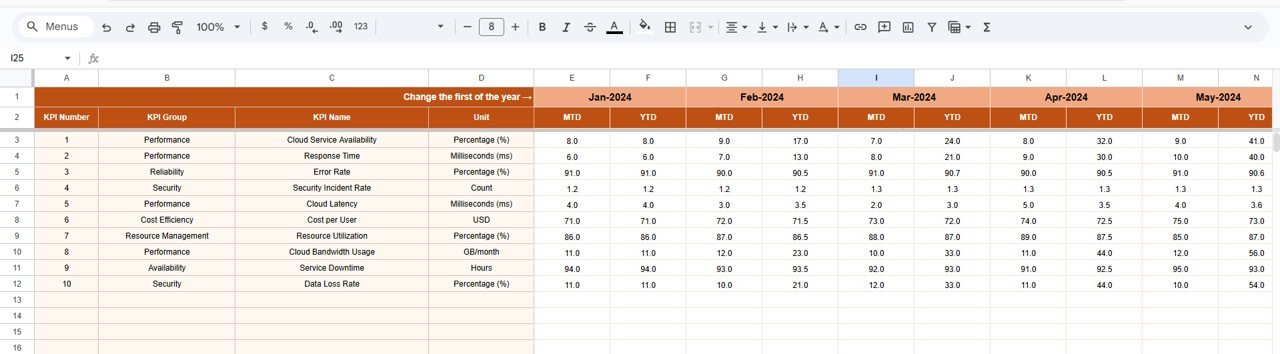
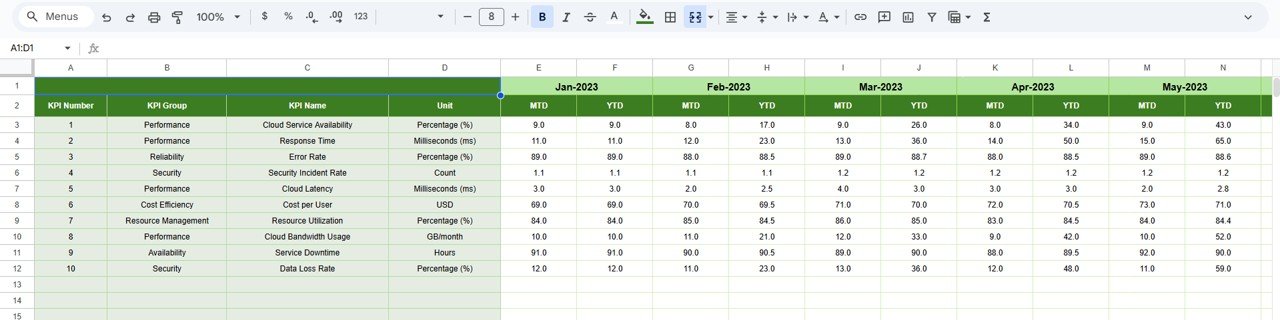
📌 Actual Number Sheet
Enter actual cloud KPI values. Change the first month of the year, and the dashboard recalculates all periods automatically.
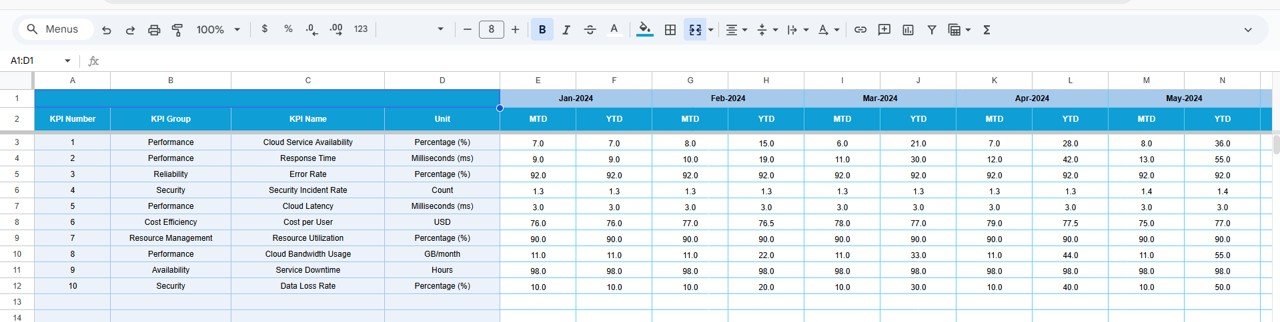
📌 Target Sheet
Maintain monthly MTD targets and cumulative YTD targets separately for clean planning and variance analysis.
📌 Previous Year Number Sheet
Store historical KPI data to enable accurate year-over-year comparisons.
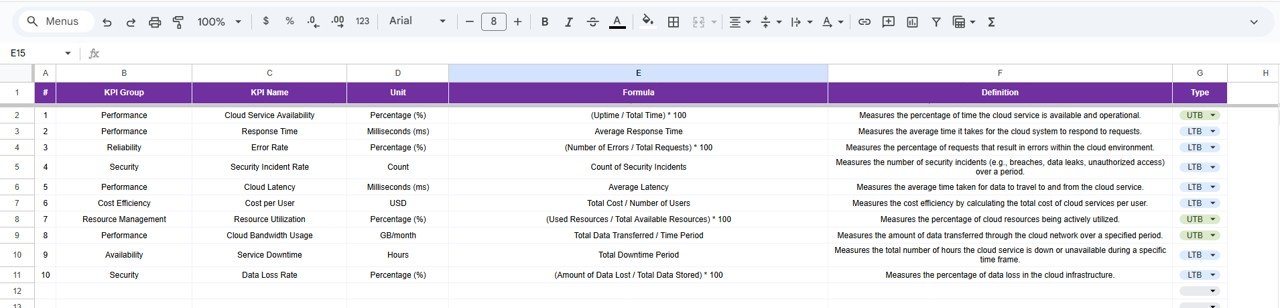
📌 KPI Definition Sheet
A master reference table containing KPI name, group, unit, formula, definition, and KPI type (LTB / UTB).
Every sheet is designed to support accurate tracking, analysis, and decision-making.
🛠️ How to Use the Cloud Computing KPI Dashboard
1️⃣ Define your KPIs in the KPI Definition sheet
2️⃣ Enter Actual, Target, and Previous Year values
3️⃣ Select the desired month from the dropdown
4️⃣ Review MTD and YTD performance instantly
5️⃣ Analyze trends and variances visually
6️⃣ Take proactive cloud optimization actions
No complex formulas. No BI learning curve. Just actionable cloud insights.
🎯 Who Can Benefit from This Cloud Computing KPI Dashboard
👨💻 Cloud Architects – Monitor performance and reliability KPIs
📊 IT Operations Teams – Track availability and optimization metrics
💰 Finance Teams – Control cloud costs and budget variance
📈 Business Leaders – Evaluate cloud ROI and efficiency
🧠 DevOps Teams – Identify trends and performance gaps
🏢 Technology Managers – Align cloud KPIs with business goals
Whether managing a single cloud platform or multiple services, this dashboard scales easily.
🔗 Click here to read the Detailed blog post
Watch the step-by-step video tutorial:


