Staying compliant in today’s highly regulated environment is not optional—it’s business-critical. Yet, many organizations still struggle with scattered Excel files, delayed reports, and manual compliance tracking. This leads to missed risks, slow decisions, and unnecessary stress during audits.
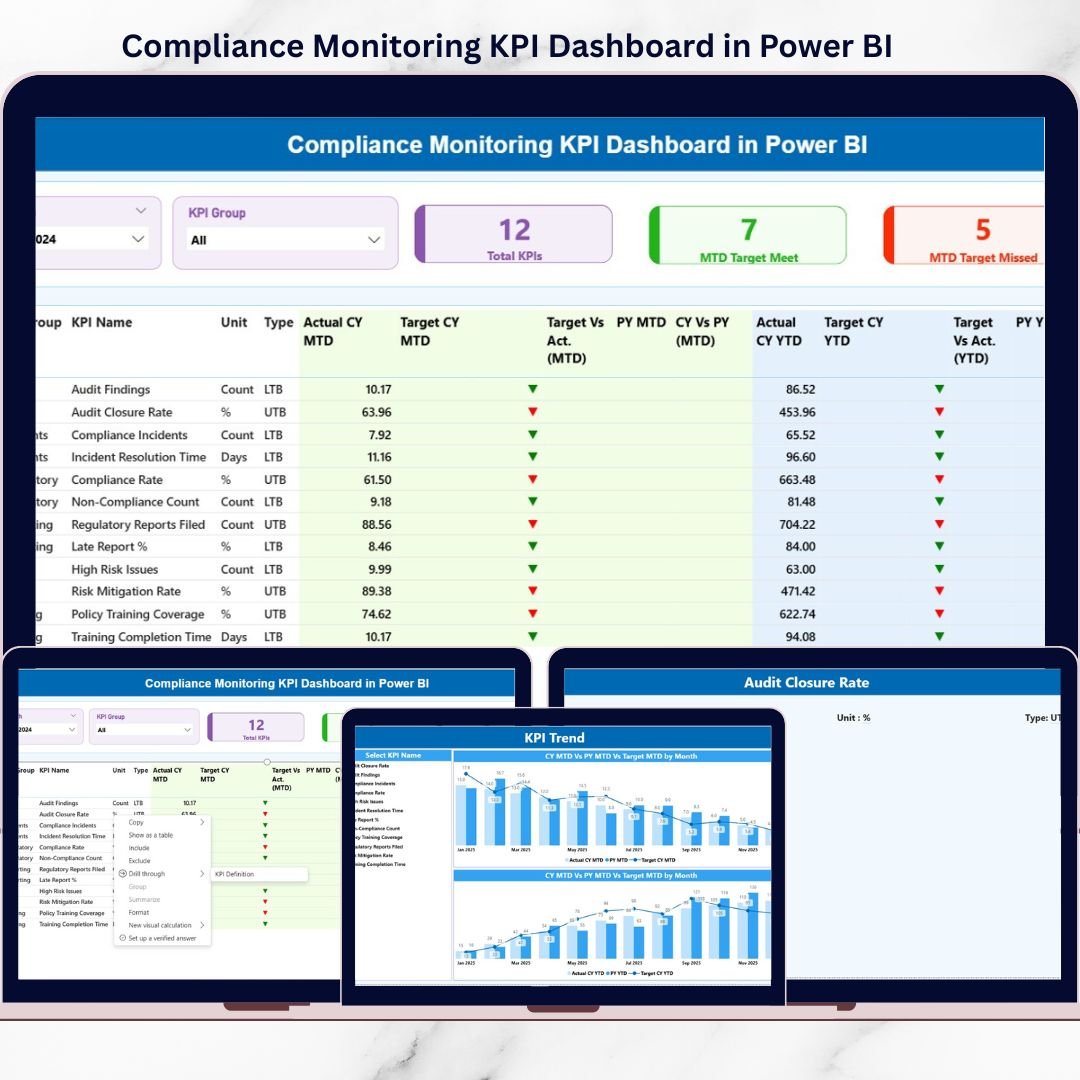
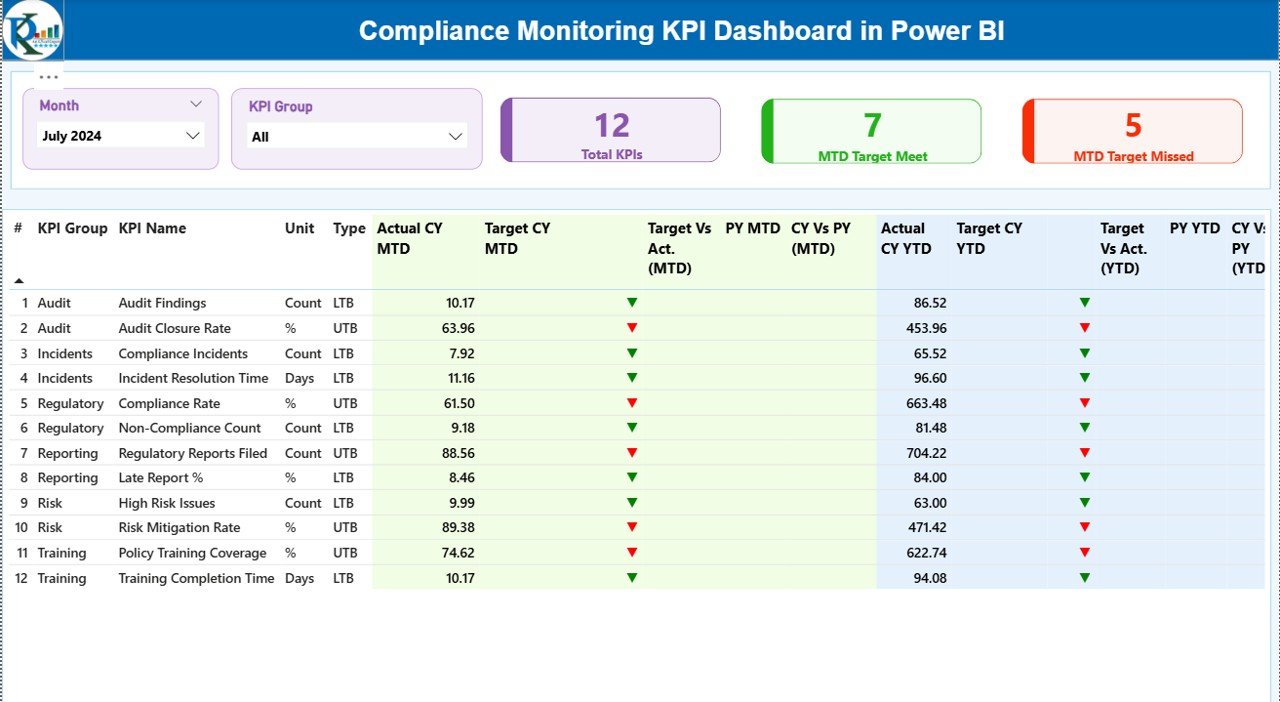
The Compliance Monitoring KPI Dashboard in Power BI is a ready-to-use, professional analytics solution designed to simplify compliance tracking, improve visibility, and support proactive risk management. Instead of reacting to compliance failures, this dashboard helps you monitor performance in real time, identify gaps early, and take action with confidence.
Built on a structured Excel data model and powered by interactive Power BI visuals, this dashboard transforms complex compliance data into clear, actionable insights—without coding or technical complexity.
🚀 Key Features of Compliance Monitoring KPI Dashboard in Power BI
✅ Centralized Compliance Tracking – Monitor all compliance KPIs from a single, interactive dashboard
✅ MTD & YTD Performance Analysis – Track both short-term and long-term compliance performance
✅ Target vs Actual Comparison – Instantly identify KPIs meeting or missing targets
✅ LTB & UTB KPI Classification – Clear performance logic using Lower-the-Better and Upper-the-Better indicators
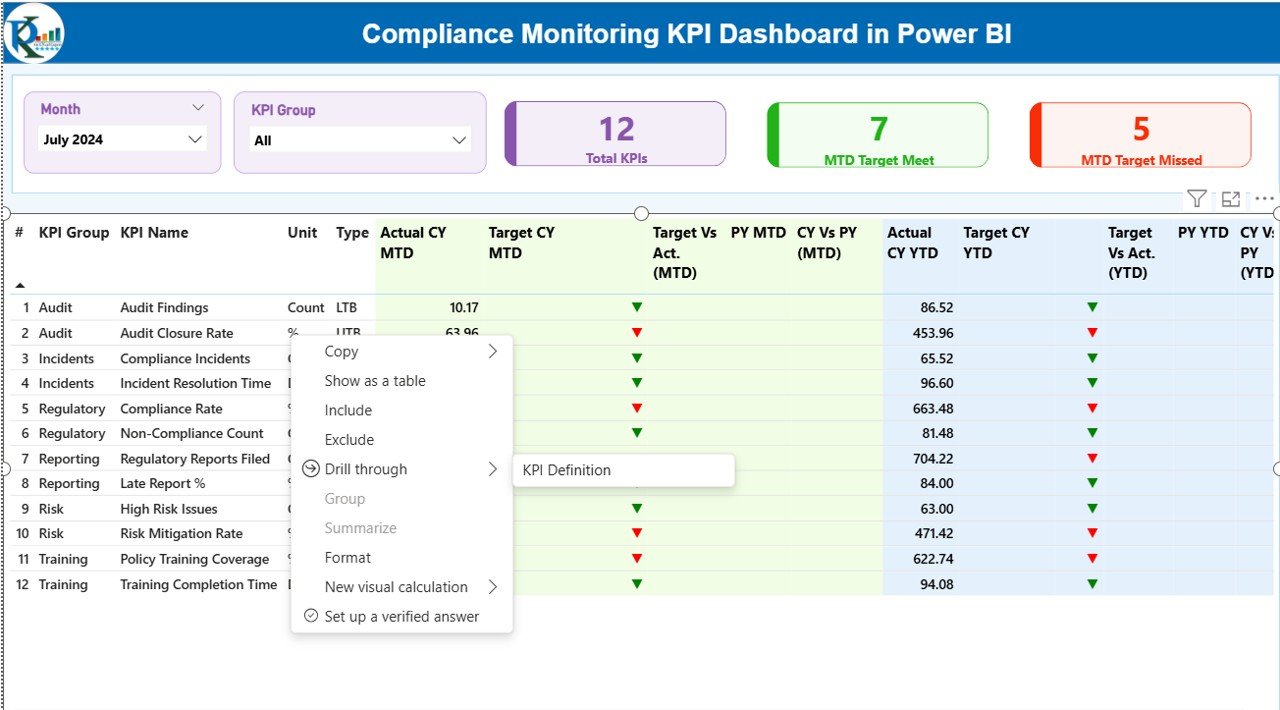
✅ Dynamic KPI Cards – Quick view of total KPIs, target met, and target missed counts
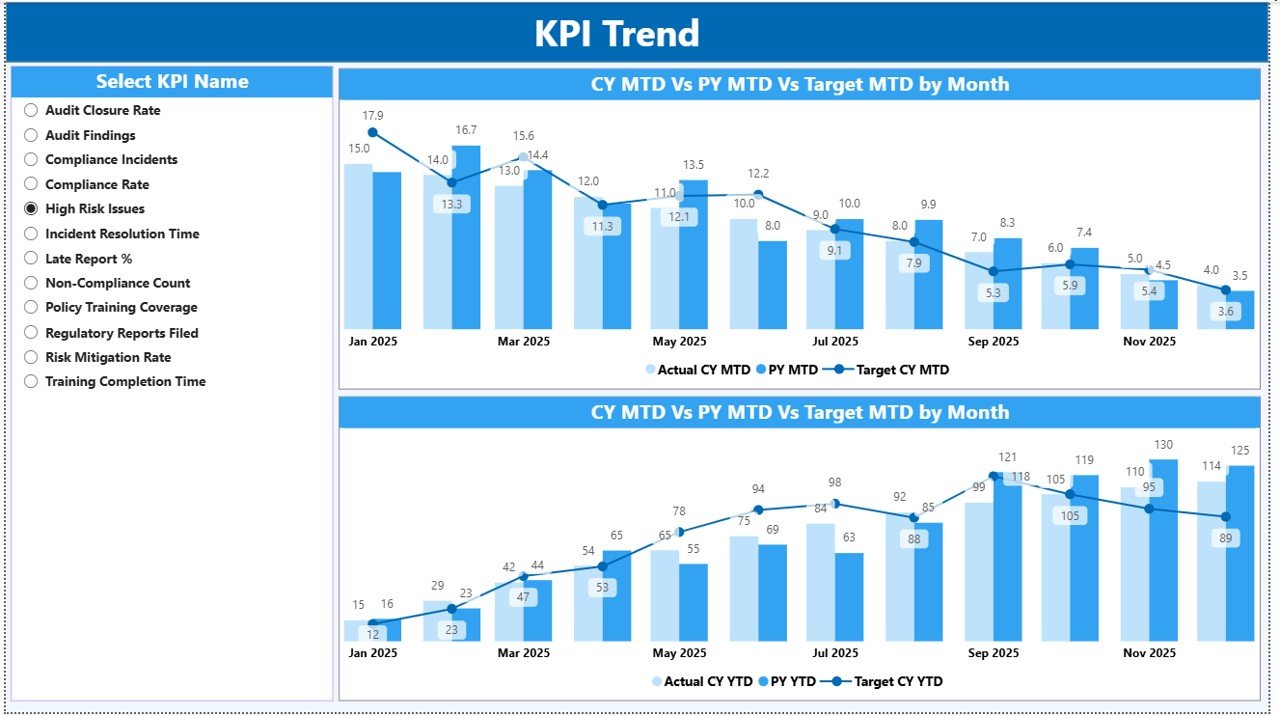
✅ Trend Analysis with Visuals – Analyze current year, previous year, and target trends
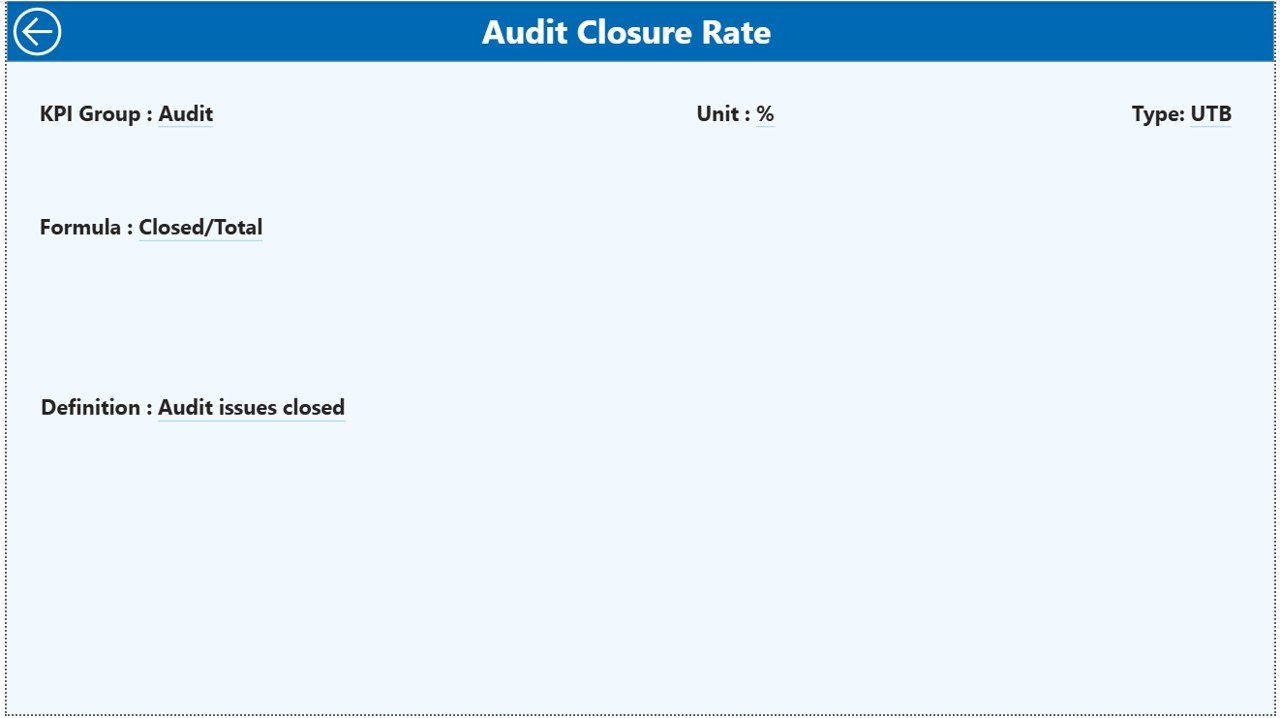
✅ Drill-Through KPI Definitions – View formula, definition, and purpose without clutter
✅ Excel-Driven Data Model – Simple data updates with instant Power BI refresh
✅ Professional & Audit-Ready Design – Ideal for compliance reviews and leadership reporting
📦 What’s Inside the Compliance Monitoring KPI Dashboard
This digital product includes a fully built Power BI dashboard file along with a structured Excel data source.
🔹 Power BI Dashboard Pages
-
Summary Page – High-level compliance overview with slicers, KPI cards, and detailed KPI table
-
KPI Trend Page – MTD and YTD trend analysis using combo charts
-
KPI Definition Page – Drill-through page showing KPI formula, definition, and interpretation
🔹 Excel Data Structure
-
Input_Actual Sheet – Stores actual MTD and YTD compliance values
-
Input_Target Sheet – Captures target MTD and YTD values
-
KPI Definition Sheet – Defines KPI number, group, unit, formula, and type
This clean structure ensures data accuracy, consistency, and easy maintenance.
🧭 How to Use the Compliance Monitoring KPI Dashboard
Using this dashboard is simple and efficient:
1️⃣ Update compliance data in the Excel input sheets
2️⃣ Refresh the Power BI dashboard
3️⃣ Use Month and KPI Group slicers to filter insights
4️⃣ Review KPI cards to assess compliance health
5️⃣ Analyze MTD and YTD performance
6️⃣ Drill through to KPI definitions for clarity
No coding. No manual reporting. Just powerful insights.
🎯 Who Can Benefit from This Compliance Monitoring KPI Dashboard?
This dashboard is ideal for:
✔ Compliance Officers – Monitor regulatory adherence proactively
✔ Internal Audit Teams – Improve audit readiness and reporting clarity
✔ Risk & Governance Managers – Identify compliance gaps early
✔ Legal & Regulatory Teams – Track obligations with confidence
✔ Senior Leadership & Boards – Gain high-level compliance visibility
It works across industries such as finance, healthcare, manufacturing, IT, and regulated services.
Click here to read the Detailed blog post
Watch the step-by-step video tutorial:


Reviews
There are no reviews yet.