Running marketing campaigns without tracking ROI is like spending money without knowing returns. Marketing teams invest across multiple channels, regions, and objectives, but without clear visibility, even high-budget campaigns fail to deliver results. Manual reports, scattered sheets, and delayed insights make optimization difficult and costly.
That is exactly why the Campaign ROI and Performance Dashboard in Google Sheets is an essential tool for modern marketing teams.
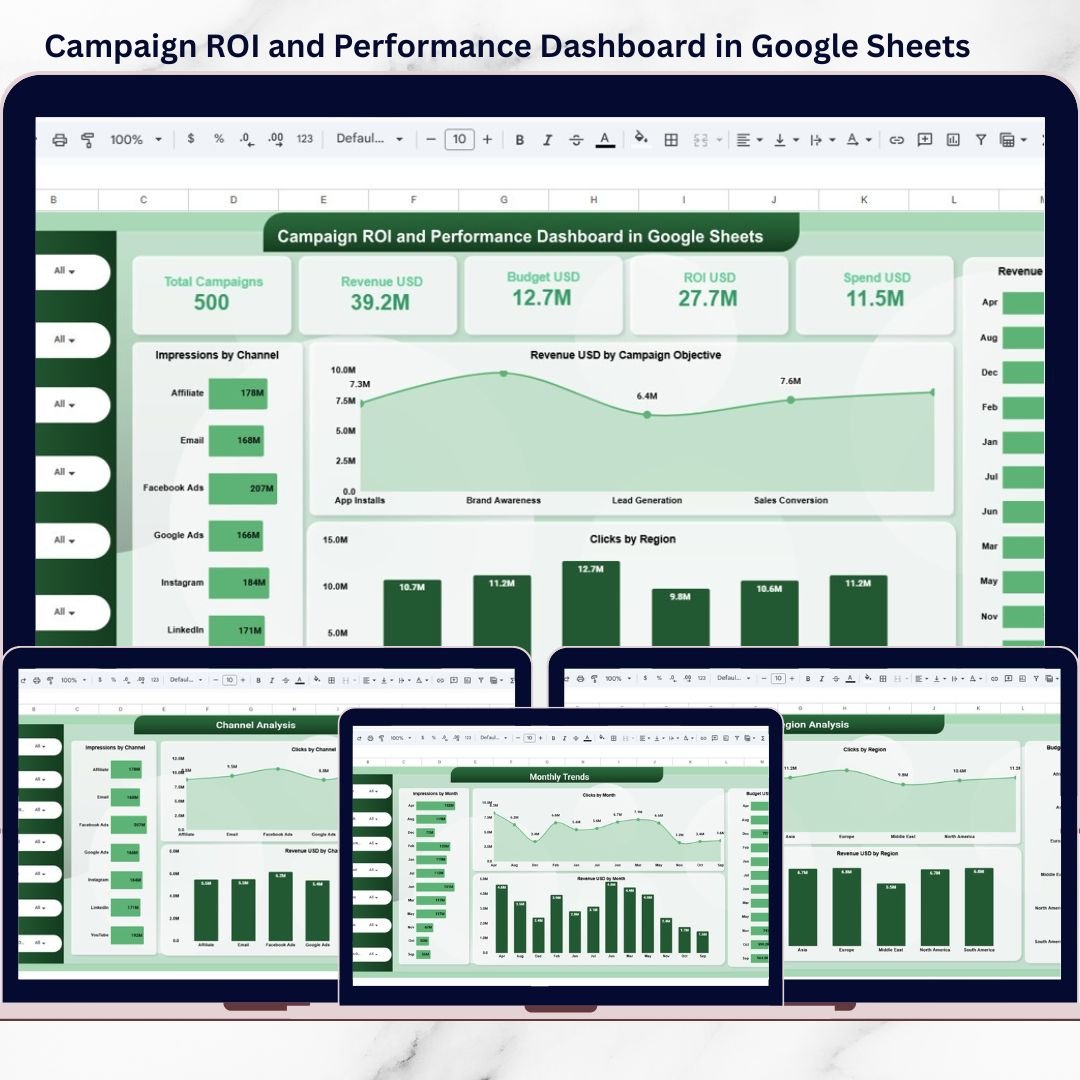
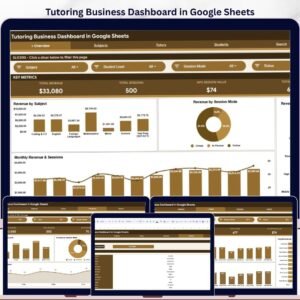
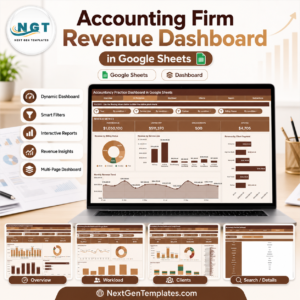
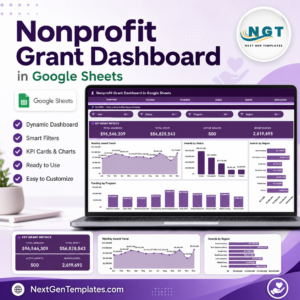
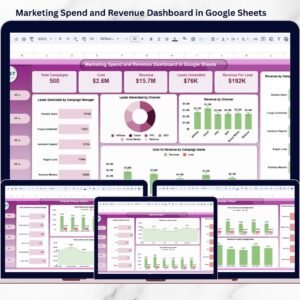
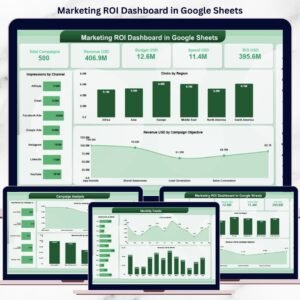
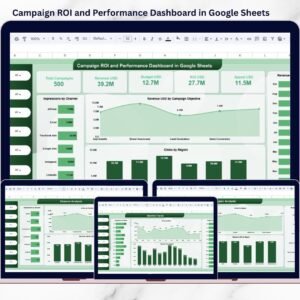
This ready-to-use Google Sheets dashboard converts raw campaign data into clear KPIs, interactive charts, and ROI-focused insights. Instead of manually calculating performance, teams get instant clarity on impressions, clicks, conversions, revenue, spend, and ROI—all in one centralized dashboard.
Built completely in Google Sheets, this dashboard is cloud-based, collaborative, easy to update, and accessible from anywhere. Whether you manage a few campaigns or hundreds, this dashboard helps you make data-driven marketing decisions with confidence.
## 🚀 Key Features of Campaign ROI and Performance Dashboard in Google Sheets
📊 Complete Campaign ROI Tracking
Monitor revenue, spend, budget, and ROI in one centralized view.
🎯 Multi-Channel Performance Analysis
Analyze campaign results across Email, Google Ads, Facebook, LinkedIn, YouTube, and more.
🌍 Region-Wise Campaign Insights
Compare impressions, clicks, revenue, and budget across regions.
📈 Campaign Objective Comparison
Evaluate performance by objectives like Lead Generation, Sales, Traffic, and Awareness.
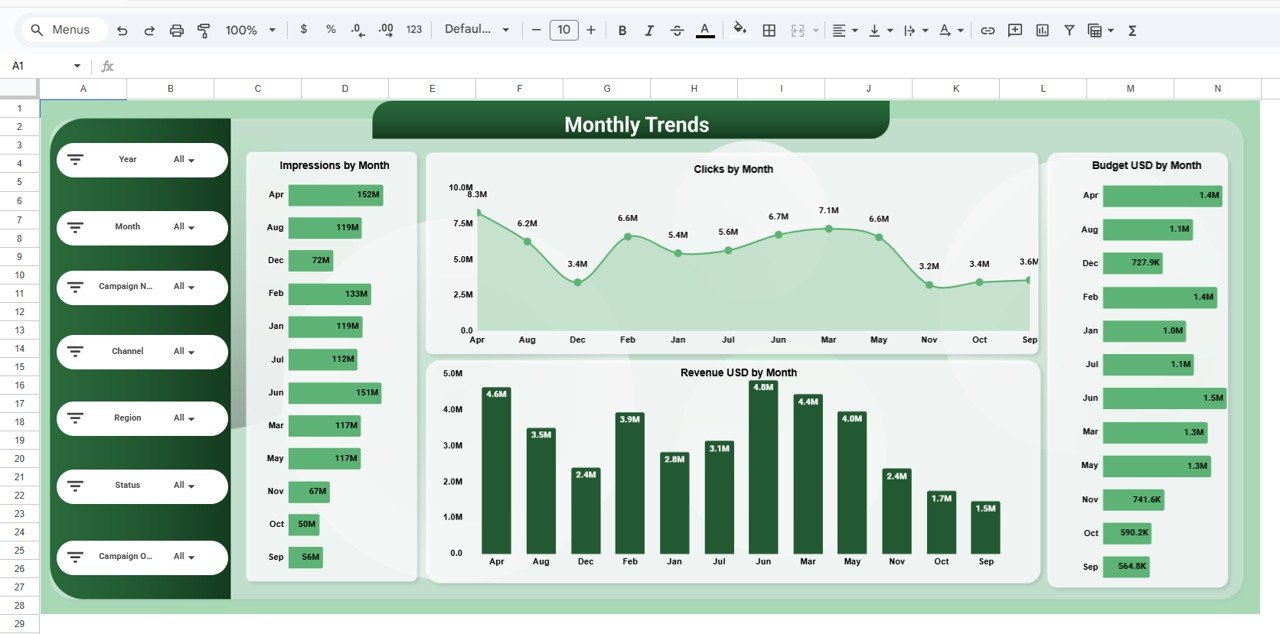
📅 Monthly Performance Trends
Track how impressions, clicks, revenue, and spend change over time.
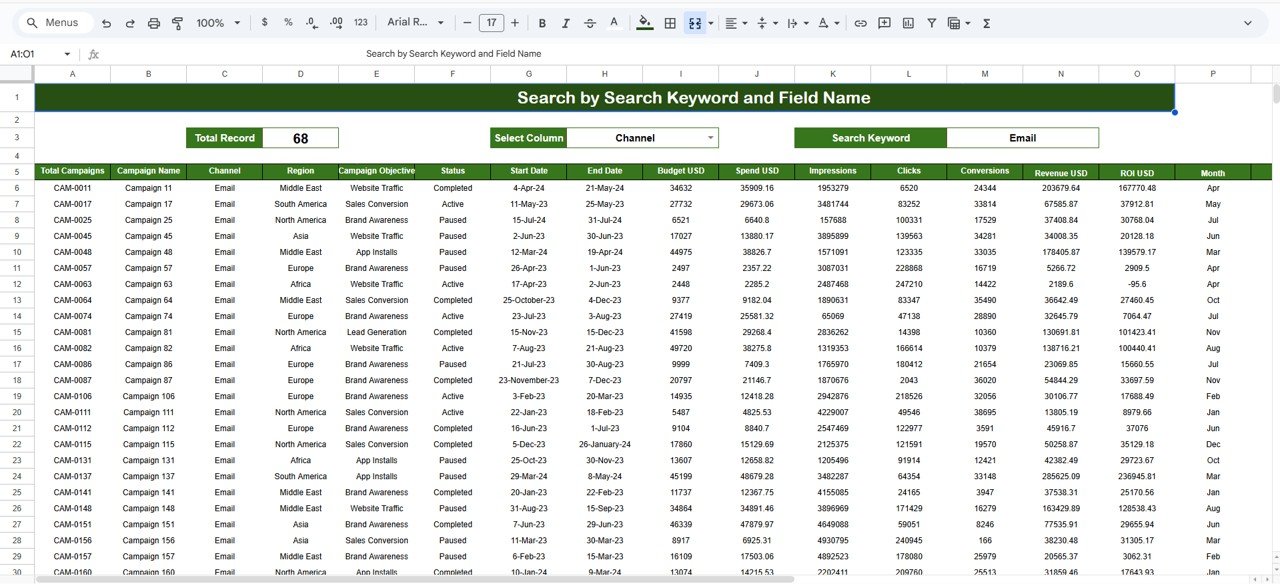
🔍 Searchable Data Table
Find individual campaign details instantly using keyword search.
🎛️ Dynamic Slicers & Filters
Filter reports by year, month, channel, region, campaign name, objective, and status.
☁️ 100% Google Sheets Based
No software installation—simple, fast, and collaborative reporting.
## 📦 What’s Inside the Campaign ROI and Performance Dashboard
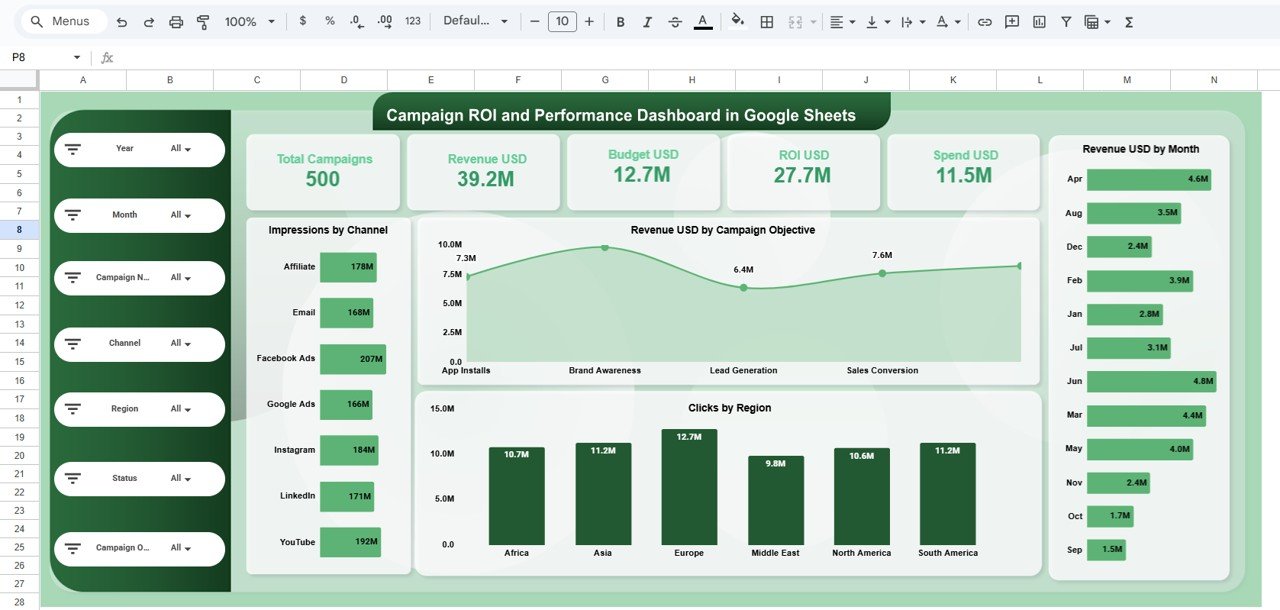
📄 Overview Page
High-level KPIs including total campaigns, revenue, budget, spend, and ROI with supporting charts.
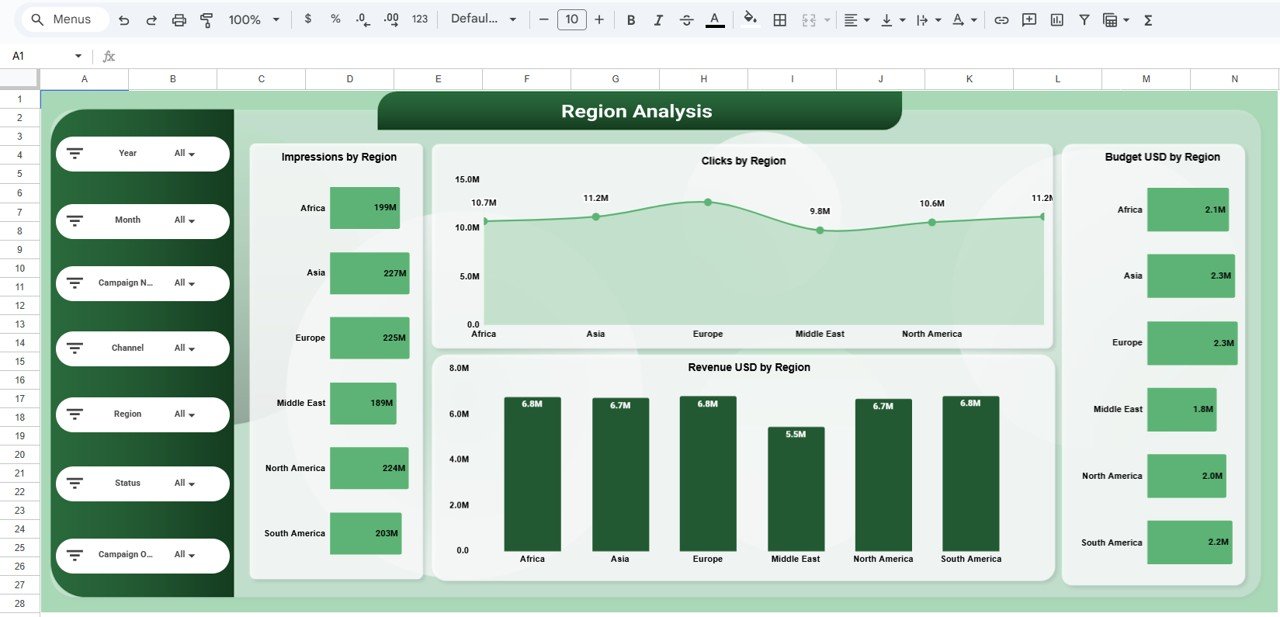
🌍 Region Analysis Page
Impressions, clicks, revenue, and budget comparison across regions.
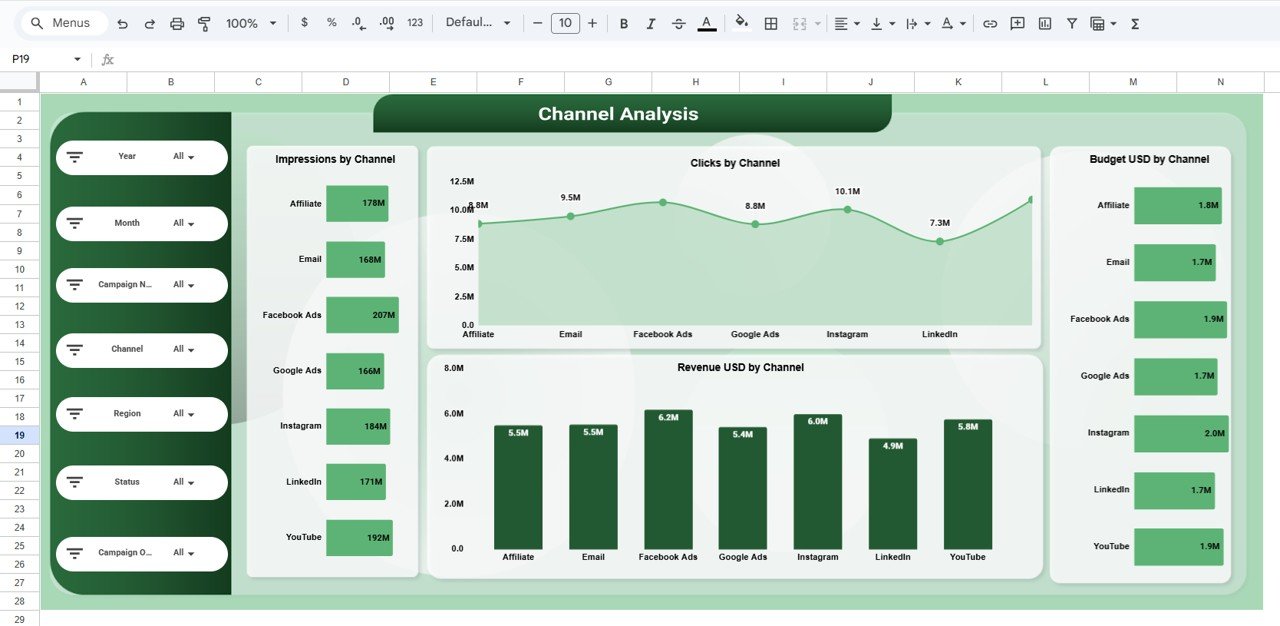
📣 Channel Analysis Page
Performance comparison across marketing channels to identify high-ROI platforms.
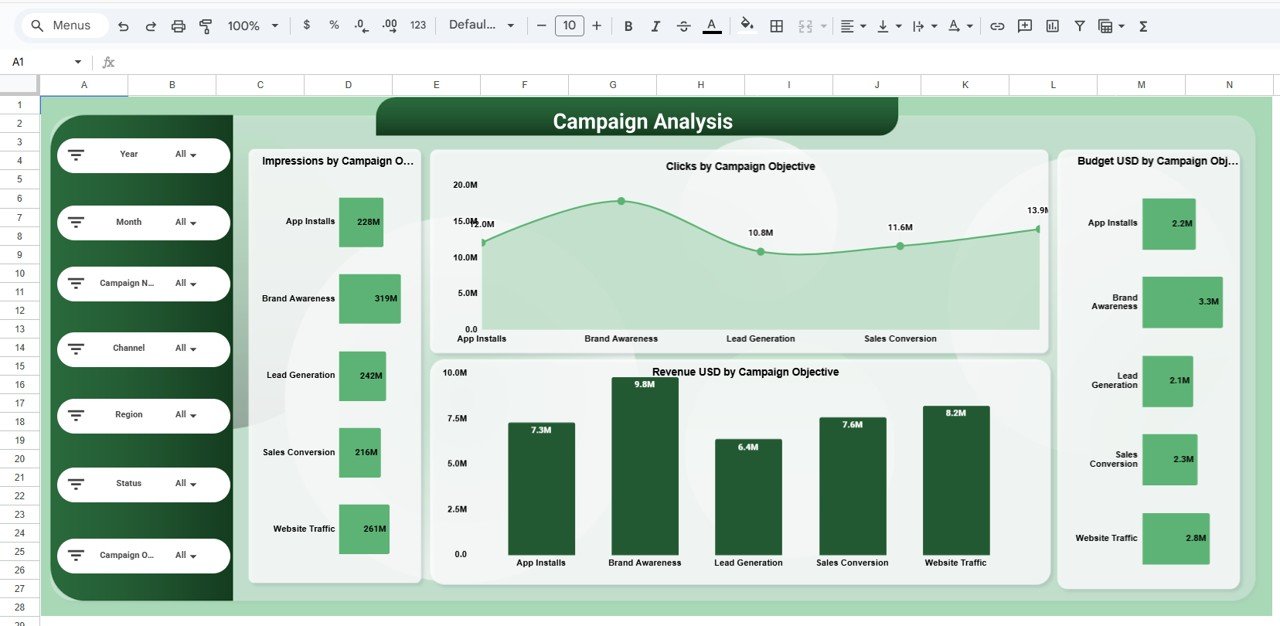
🎯 Campaign Objective Analysis Page
Analyze which objectives deliver the best results and ROI.
📆 Monthly Trends Page
Visualize performance patterns across months for better forecasting.
📋 Detailed Data Table View
Campaign-level metrics including impressions, clicks, conversions, revenue, ROI, and status.
## 🛠️ How to Use the Campaign ROI and Performance Dashboard
1️⃣ Enter or paste campaign data into the raw data table
2️⃣ KPIs and charts update automatically
3️⃣ Use slicers to filter by channel, region, month, or campaign
4️⃣ Analyze ROI, spend efficiency, and performance trends
5️⃣ Share the dashboard with stakeholders for real-time collaboration
No advanced Google Sheets skills required—the dashboard is beginner-friendly and ready to use.
## 🎯 Who Can Benefit from This Campaign ROI Dashboard
📊 Digital Marketing Teams
🚀 Performance & Growth Marketers
📈 Marketing Managers & CMOs
🏢 Agencies managing multiple campaigns
💼 Business Owners & Founders
🌱 Startups and Enterprises
This dashboard is ideal for anyone who wants clarity, control, and measurable ROI from marketing efforts.


Reviews
There are no reviews yet.