Construction projects succeed or fail based on equipment availability, utilization, maintenance, and cost control. However, many construction companies still rely on manual equipment logs, isolated spreadsheets, or delayed MIS reports. As a result, downtime increases, maintenance issues go unnoticed, and project productivity suffers.
That is exactly where the Construction Equipment KPI Dashboard in Google Sheets delivers real value.
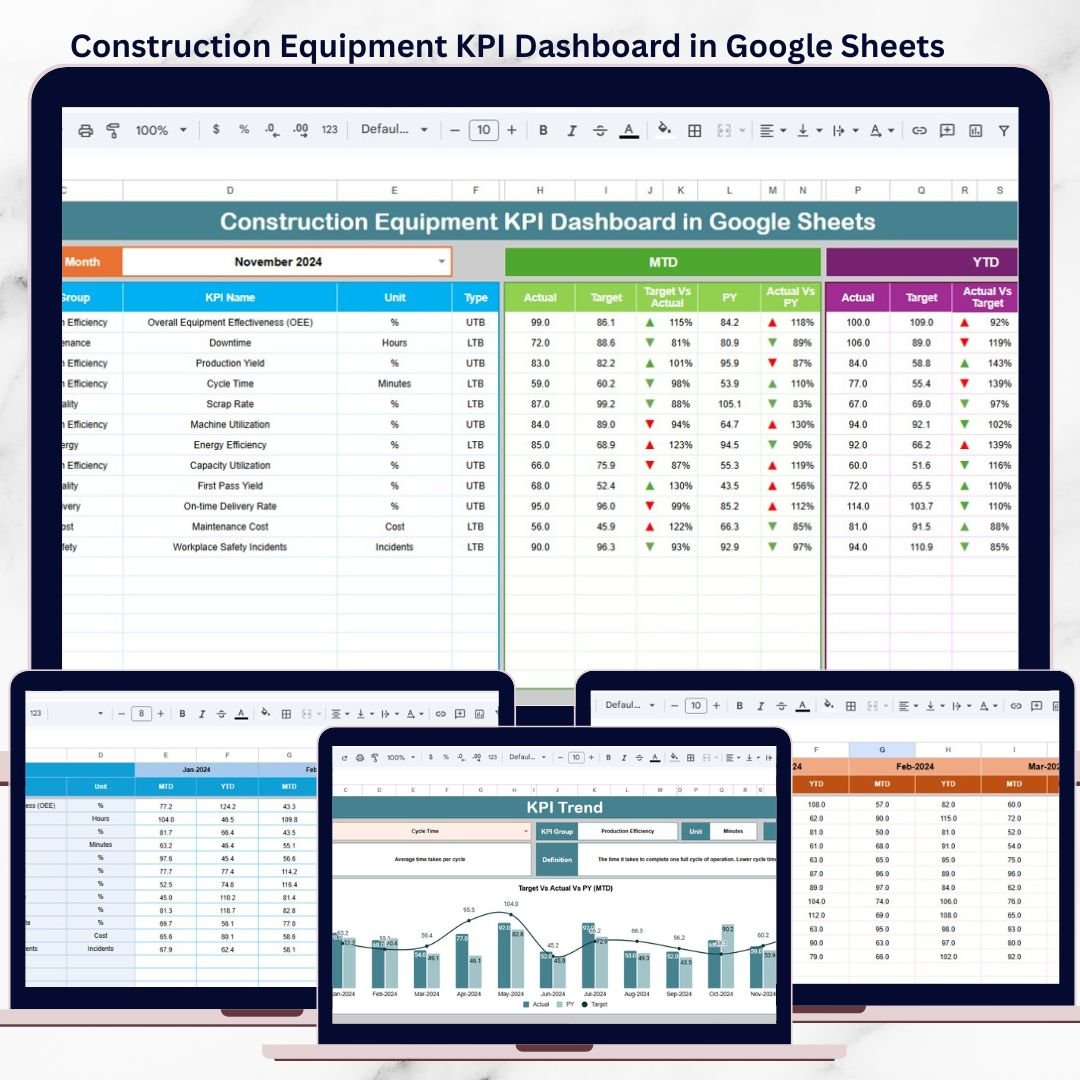
This ready-to-use Google Sheets dashboard provides a centralized, visual, and data-driven view of equipment performance. Instead of reacting to problems after they occur, construction teams can monitor utilization, downtime, cost, and productivity in real time—all from a single dashboard.
Built entirely in Google Sheets, this dashboard enables real-time collaboration, easy updates, and instant access from anywhere, making it ideal for fast-moving construction environments.
⭐ Key Features of Construction Equipment KPI Dashboard in Google Sheets
📊 Centralized Equipment KPI Dashboard
Track all equipment KPIs in one clear and interactive dashboard.
📅 Dynamic Month Selection
Change the month once and the entire dashboard updates automatically.
📈 MTD & YTD Performance Tracking
Monitor Month-to-Date and Year-to-Date performance side by side.
🎯 Actual vs Target Comparison
Instantly identify whether equipment performance meets defined targets.
📉 Previous Year Comparison
Measure improvement or decline using year-over-year analysis.
🚦 Visual Performance Indicators
Up and down arrows highlight positive and negative performance instantly.
📘 Standardized KPI Definitions
Clear units, formulas, and KPI logic ensure consistent reporting.
☁️ Built in Google Sheets
Cloud-based access with real-time collaboration and sharing.
📦 What’s Inside the Construction Equipment KPI Dashboard in Google Sheets?
This dashboard includes six well-structured worksheets, each designed for a specific purpose:
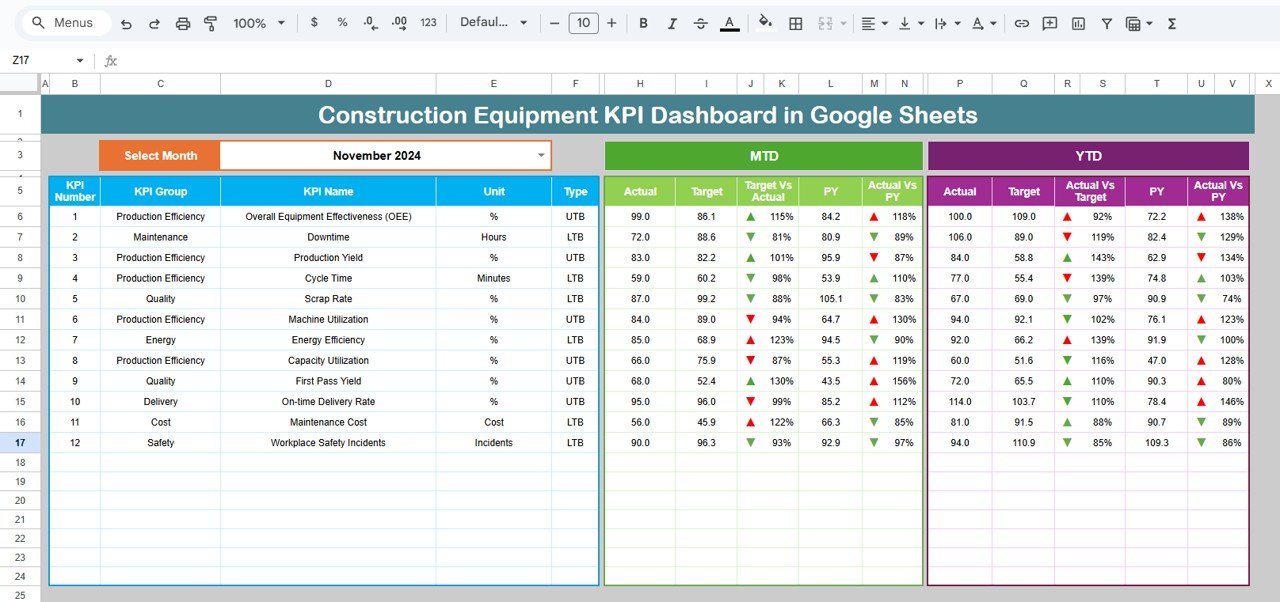
📌 Dashboard Sheet
The main reporting view showing all equipment KPIs with MTD and YTD comparisons, variance analysis, and visual arrows.
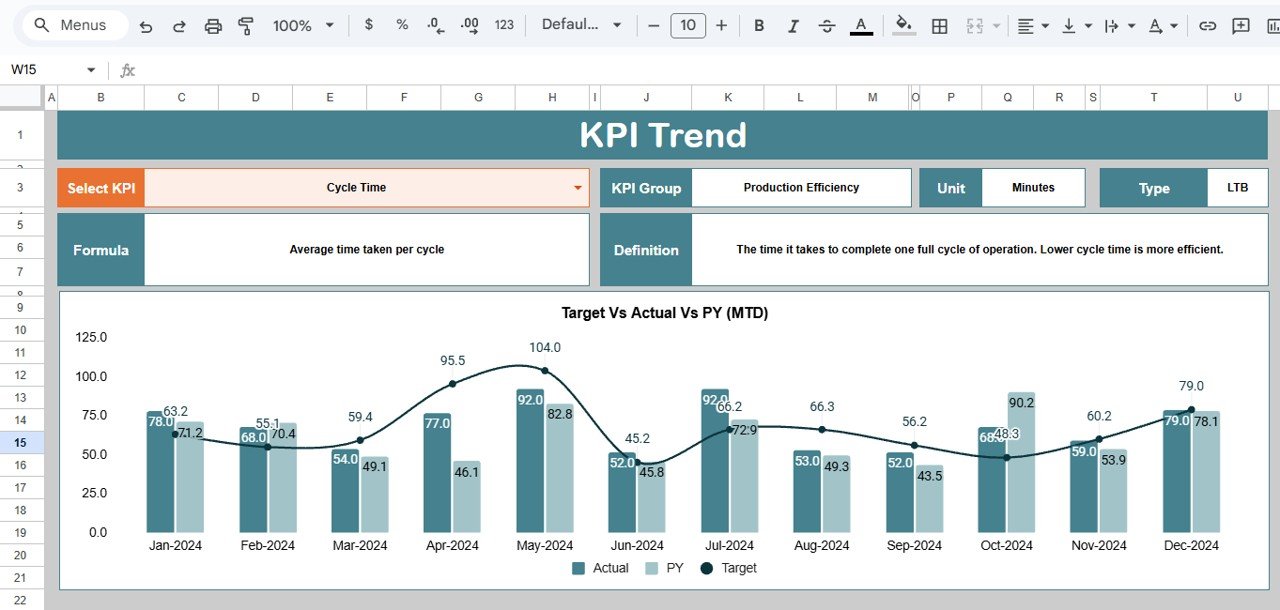
📌 KPI Trend Sheet
Detailed KPI-level analysis with trend insights, KPI unit, type (LTB/UTB), formula, and definition.
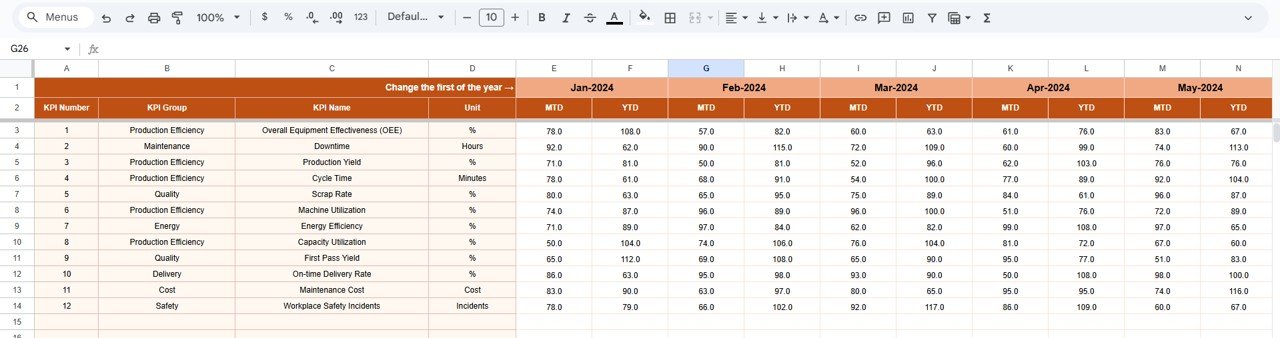
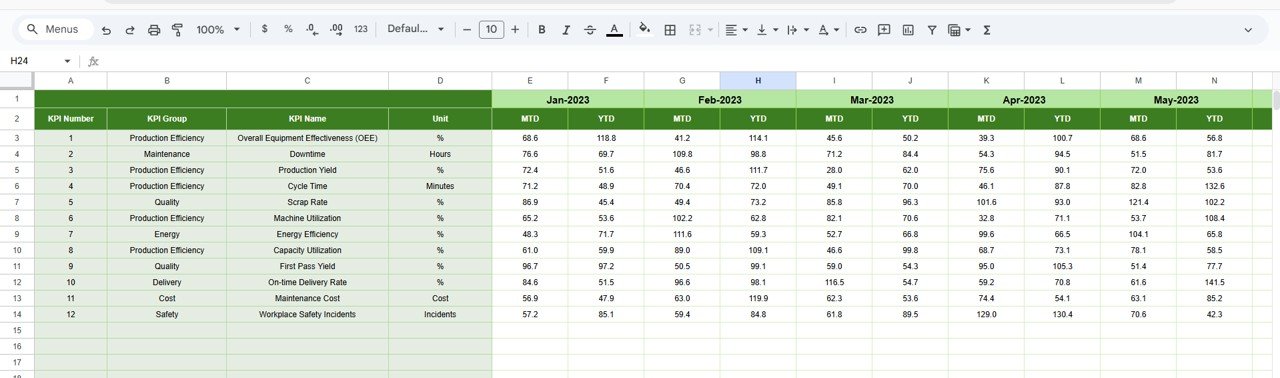
📌 Actual Number Sheet
Simple and structured data entry for monthly MTD and YTD actual values.
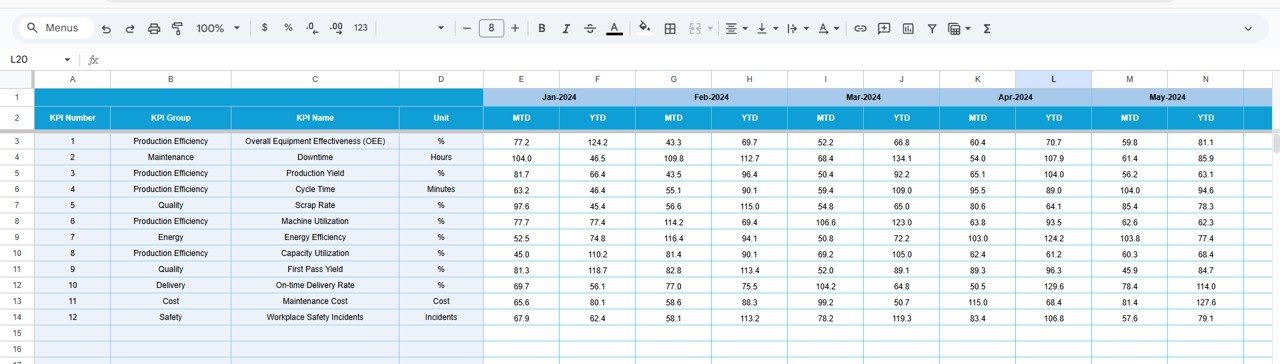
📌 Target Sheet
KPI-wise monthly targets for accurate performance benchmarking.
📌 Previous Year Number Sheet
Stores historical data to support year-over-year performance analysis.
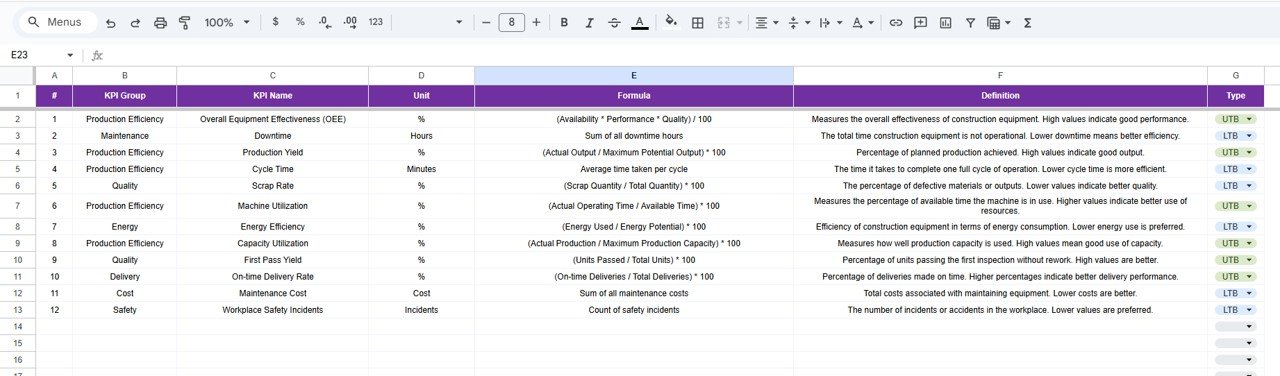
📌 KPI Definition Sheet
Defines KPI name, group, unit, formula logic, and KPI type for clarity.
Together, these sheets create a complete equipment performance monitoring system.
🛠️ How to Use the Construction Equipment KPI Dashboard in Google Sheets
Using this dashboard is simple and does not require advanced technical skills:
1️⃣ Review or define KPIs in the KPI Definition Sheet
2️⃣ Enter actual performance values in the Actual Number Sheet
3️⃣ Add target values in the Target Sheet
4️⃣ Input previous year data for comparison
5️⃣ Select the required month on the Dashboard
6️⃣ Instantly review MTD, YTD, and variance insights
All calculations and visuals update automatically, allowing teams to focus on decisions—not formulas.
👷 Who Can Benefit from This Construction Equipment KPI Dashboard?
This dashboard is ideal for:
🏗️ Project Managers
🏭 Plant & Equipment Managers
🛠️ Maintenance Teams
📊 Operations & Planning Teams
💰 Cost Control & Finance Teams
🏢 Construction Company Owners
Whether managing a single site or multiple projects, this dashboard adapts easily.
🚀 Why This Dashboard Is a Must-Have for Construction Teams
✔ Reduces equipment downtime
✔ Improves utilization and productivity
✔ Tracks cost overruns early
✔ Saves hours of manual reporting
✔ Enhances accountability across teams
✔ Eliminates the need for expensive BI tools
This dashboard transforms Google Sheets into a powerful equipment performance management tool.
🔗 Click here to read the Detailed blog post
Watch the step-by-step video tutorial:
📺 Visit our YouTube channel to learn step-by-step video tutorials and dashboard walkthroughs.


Reviews
There are no reviews yet.